Bitcoin BEARISH 4 Hour Chart - Trend Line Support BrokeBitcoin has broke down through an important trend line support level on the 4 hour chart. It is currently in the process of re-testing the line before a continuation down again. It's possible that Bitcoin may gain short-term up to around $100000 before the re-testing is complete. Or it may just start falling like a rock before then.
The trend line was tested multiple times and is a reliable signal of what is to come. This also agrees with my analysis on the weekly chart too. Both charts indicate a potential drop for Bitcoin to around $75000.
Please note: this is a crazy world and anything could happen, but this is my analysis based solely on the chart. I would say the same if it were corn, copper, or whatever else. Be cautious buying Bitcoin anytime soon based solely on hype! As I said above, it could gain short term to re-test the line which is now resistance, but it will probably be short-lived.
Bitcoin (Cryptocurrency)

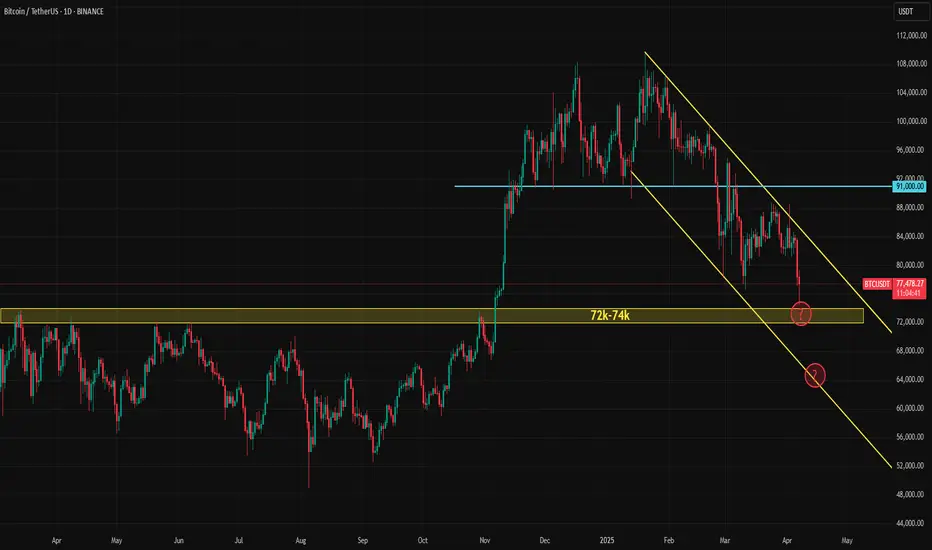
Bitcoin Attempts to Bounce from Key Support ZoneIn our last BTC post, we mentioned that decision time had arrived—and the market has made its move. The downtrend is resuming with max-pain.
Today, Bitcoin tested a major support zone at 72,000–74,000. This area, once a key resistance, now serves as critical support.
Now, another decision point is approaching. Will the market recover and Bitcoin follow, pushing toward the upper boundary of the trend channel? Or will a break below this support send BTC toward the lower edge of the channel, triggering a strong move that shakes out the bulls before a potential recovery?
You Won't Believe Who Saved Bitcoin: GMEThis last week was interesting to say the least but the most interesting thing to watch was the incredibly influx of volume into INDEX:BTCUSD
As the week progressed into Thursday and Friday and equity markets sold off big the volume of trading in Bitcoin more than doubled... yet the price remained stagnant.
A month ago I did a study of correlation and relative movements between stocks and Bitcoin to answer the question: "What would happen to Bitcoin if Stocks Crash?" The TL;DR was that 75% of all weeks exhibited a positive correlation with nearly 50% a "high" correlation. Also, when equities have sold off big over the past decade Bitcoin had sold off at least two times or more.
Correlations are not an absolute and can change but this week something unique was clearly going on. If the standard correlation had been allowed to play out on Thursday INDEX:BTCUSD would have fallen more than -8% and Friday more than -11%. It would have triggered mass liquidations. But that did not happen.
This was a critically important Support for Bitcoin to hold and someone knew it... enter Ryan Cohen.
Michael Saylor with NASDAQ:MSTR is definitely NOT the one deploying cash to prop up Bitcoin.
His buys have been entirely NOT-Strategy-ic and has mostly bought highs. He has made a virtue out of being a really bad "trader" uncaring about price and timing. That plan has not worked to push Bitcoin to new a new All Time High nor saved it from the bear trend in 2025.
Cohen, however, is a renowned trader/investor that should know market structure and would have the sense to deploy cash at the perfect time. Just this week two things happened: Cohen took out a loan backed by his NYSE:GME shares and GameStop completed a convertible note offering, like Microstrategy has done, to raise 1.4 Billion in cash to buy Bitcoin. That gave him lots of cash at the critical point at the end of the week.
So do they get to win? Very possible. It depends on equities. If stocks rise in the coming week then the Bitcoin correlation may resume and INDEX:BTCUSD be lifted. If the U.S. economy enters a recession, the stock market route deepens, or if they used all of their available cash to exhaustion then the plan could fail and Bitcoin will fall in sync.

Bitcoin’s Make-or-Break Moment: Eyes on $70KBitcoin price almost reached the $74k support area, which is critical for the bull run continuation.
This zone has acted as a strong resistance in the past, and a clean bounce from here could signal renewed strength and confidence in the market.
However, if this support fails to hold and BTC closes the weekly candle below the $70k level, it would likely mark the end of the current bull phase and signal the beginning of a distribution phase or even the early stages of a new bear market.
That doesn’t necessarily mean Bitcoin will crash straight to $50k — corrections are rarely that linear. But it would drastically reduce the chances of seeing new all-time highs in this cycle.
The next rally, if it happens, would probably be more muted and shorter-lived.
Hopefully BTC will manage to avoid this scenario and hold above the support area.
On the positive side, if BTC holds above $70k and we see strong demand stepping in, it could set the stage for a healthy bounce and continuation of the uptrend.
Still I expect that BTC will test 70k level and if we see strong buying pressure on that level we can expect some recovery.

Bitcoin drops. What's next?Hello, Traders!
Bitcoin price continues to fall towards the next big support area at 74k-70k.
Currently, there is no sign of BTC reversal, and it seems that this correction phase will last long.
Ideally, the faster BTC finds its local bottom, the faster it starts to rise again.
However, the current market conditions suggest that a period of consolidation might be necessary before a meaningful recovery.
I doubt that the BTC price will fall below 70k despite all the negative sentiment surrounding it at the moment.
More likely, we will see strong buying pressure at those levels, as institutional investors and long-term holders step in to accumulate at what they perceive as a discount.
Also, the stochastic RSI on a weekly scale has dropped to 0, which historically indicates that momentum is oversold and a potential reversal could be near.
If we see a bullish cross on the SRSI on a weekly timeframe, this might act as a catalyst for a price rebound, possibly pushing BTC toward new highs.
Another indication of a possible bottom is the Fear & Greed Index, which currently sits at around 20.
This level reflects extreme fear in the market, a condition that has often preceded local bottoms in previous cycles.
Historically, such extreme fear tends to trigger a shift in sentiment, leading to increased demand and a subsequent price recovery.
Furthermore, on-chain metrics suggest that long-term holders remain unfazed by the recent downturn, with exchange reserves continuing to decline. This indicates that a significant portion of BTC supply is being moved to cold storage, reducing selling pressure.
Additionally, open interest in the futures market has seen a decline, which could mean that excessive leverage is being flushed out—a necessary step for a healthier market structure.
If BTC manages to hold the 70k support level and confirms a reversal with increasing volume, we could see a strong recovery phase unfold.
However, if the price breaks below this key support, the next significant area to watch would be around 65k, where additional buying interest might emerge.
Please don’t forget to boost this idea and leave your comments below.

ITS TIME , FINAL WAVE FOR BITCOIN HAS BEGAN The final wave for Bitcoin has officially started; 200k by September 2025 is the call. So far, since October 2024, we have been getting every macro move correct. Going to avoid repeating a lot of content from the previous two TAs; check it out below.
The lower high on the RSI called the momentum shift on this one; it was clear.
December 17th, 2024, calling for a pullback down to 82k for wave 4 to complete; it hit 77k, pretty close.
So last time, I was wrestling with two different dates for a cycle top; the first one was May 2025, and the second was September 2025.
It is clear to me now that mid to late September 2025, Bitcoin will peak at around 200k. It could go slightly higher, but the 185-200k region has a higher outcome.
So, I've been using this small-time Fib, and last time when we hit the 0.618, it was the breakout week for Bitcoin from the long range. We're here again; this week is the big pivot and start of wave 5.
The hash ribbon has confirmed a buy signal, and more importantly, it flashed buy in my Time Fibonacci week. Amazing. If you've been with me for years, you already know that this is the best signal for Bitcoin there is. It is so damn good; this gives so much more weight to my thesis.
Stars seem to align again. They constantly try to shake you out; this is the game. Who is going to fade the hash ribbon buy? It's been the easiest play time and time again.
Seriously, though, for just a moment—are you really going to fade the hash ribbon? :)

BTC is still bullish!!!🚨 CRYPTOCAP:BTC is dipping hard! 🚨
📍 All eyes on $72,000 — this could be the ultimate buy zone:
🔽 Why this level matters:
1️⃣ Bottom of the blue wedge
2️⃣ Flipped resistance → support
3️⃣ Major demand zone
4️⃣ Classic -34% pullback move
📊 This could be a textbook entry point.
Are you ready to catch the bounce?

Bitcoin at MAJOR SUPPORT! Intraday Update: Bitcoin has hit major support at the 74000 level (today's lows at 74420) which should allow for a move back above the 80K level. A move below 74K level could put the 68848 level in view,

I'm Bullish, but... BTC / USDHello my friends,
At a minimum we're looking at 30 days inside this wedge before breaking out and testing the $96k range once again. Trust me, Bitcoin must form a bullish structure before doing anything interesting.
It could wick to FWB:73K but I'm thinking the heavy orders around $75k might hold and we range instead of dumping more.
Keep an eye on this wedge.
Trade thirsty, my friends!

Bitcoin Key levels for a tradeBitcoin Key levels for a trade
81k - local swing buy zone
76 - 78k area - swing long zone

Pullback to 80KMorning folks,
So, our long-term bearish journey that we were following for 4-5 weeks comes to an end. BTC more or less hit our 74K target and strong weekly support area .
The next one stands around 69K, but market strongly needs a new driving factor to break ~70K support area, and hardly this will happen this week.
Taking in consideration that market is oversold, now we set a tactical target- pullback to 80K resistance area , and then we will see, should be sell again or not.

Will BITCOIN prove to be resilient amidst this market crash??Bitcoin (BTCUSD) just hit its 1W MA50 (red trend-line) for the first time since September 06 2024, while completing the first 1D Death Cross since August 09 2024. This is a critical double combo development as last time those conditions emerged it was a bullish signal.
Despite the theoretically bearish nature of the Death Cross, the last one on 1D was formed just four days after the market's previous major long-term bottom of August 05 2024. That bottom was exactly on the level that the market hit today, the 1W MA50.
The 1W RSI sequences among the 2 fractals are identical and if it wasn't for the abysmal negative market fundamentals regarding the back-and-forth tariffs, that would be an automatic long-term buy entry, the 3rd on of this Bull Cycle.
The only condition we can technically rely on right now, amidst the stock market crash, is for the weekly candle to close above the 1W MA50, as it did on August 05 2024. In that case and of course if and only if the trade war gets under control (and/ or the Fed makes an urgent rate cut), we can expect a new long-term Bullish Leg to begin towards $150k and above.
Failure to address those concerns and a 1W candle close below the 1W MA50, can result into a stronger sell-off towards $50000 and the next long-term technical Support level of the August 05 2024 Low (49150). That would also be a major Support cluster as the 1W MA200 (gray trend-line) is just below that level (and holding since October 16 2023) and by the time of the drop, the market may test that as well.
So what do you think? Will BTC turn out to be resilient amidst this market crash or will it follow suit and decline towards $50k? Feel free to let us know in the comments section below!
-------------------------------------------------------------------------------
** Please LIKE 👍, FOLLOW ✅, SHARE 🙌 and COMMENT ✍ if you enjoy this idea! Also share your ideas and charts in the comments section below! This is best way to keep it relevant, support us, keep the content here free and allow the idea to reach as many people as possible. **
-------------------------------------------------------------------------------
💸💸💸💸💸💸
👇 👇 👇 👇 👇 👇

Where can Bitcoin turn bullish again? (2D)Before anything, pay attention to the timeframe of the analysis. This is a 2-day timeframe, so it will take time.
The green zone is where Bitcoin can start moving toward the specified targets. If the ATH is broken, Bitcoin could also move toward $120K and $140K. However, based on the chart, there is currently no certainty about Bitcoin’s final target.
Reaching the green zone may take more than 4 to 5 weeks.
We are looking for buy/long positions in the green zone.
A daily candle close below the invalidation level will invalidate this analysis.
For risk management, please don't forget stop loss and capital management
When we reach the first target, save some profit and then change the stop to entry
Comment if you have any questions
Thank You

BTC HTF ThoughtsChart from end of Dec/early Jan. Idea back then was that the top is in, and we'll revisit at least 51.5 levels. IMO low will be between 41.5-32.5, with potential to reach 23s.
However, it won't happen in one day and it's finally at prices i want to scale in and hold for the next weeks/months incase i'm wrong with the macro idea.
I'm a buyer between 74-62, levels in between are 72, 69, 65 and 62.

Bitcoin is at a decision point.I would not be surprised if Bitcoin started correction waves from the Fibonacci 1.618 point.
RSI also looks weak.
Less likely, correction waves may begin after Fibonacci rises to 2.618 levels.
Harmonic patterns often target Fibonacci 1.618 levels.
Trump has had a major impact on the world economy and politics recently. This impact has also affected the crypto markets. Therefore, it makes sense to revise our analysis.
* What i share here is not an investment advice. Please do your own research before investing in any digital asset.
* Never take my personal opinions as investment advice, you may lose all your money.

Bitcoin BTC - Buy The News, Correction Is Almost Over Hello, Skyrexians!
The anticipated move has happened, BINANCE:BTCUSDT has retested the recent low and its dominance continues growing, alts are bleeding. When this nightmare will be finished and do we have any chance to see the reversal now?
Let's take a look at the daily time frame. As we pointed out earlier Bitcoin has printed wave 1 inside larger degree wave 3 and after that dropped in the wave 2. We have already told you 2 times that correction is over when price was next to $77-78, but multiple retests are not forbidden. 0.61 Fibonacci zone is the place where correction can be finished, so it can dump up to $73k. Two facts we need to rely on to find the correction bottom are: bullish divergent bar and the first green column on Awesome oscillator in conjunction with the divergence.
Best regards,
Skyrexio Team
___________________________________________________________
Please, boost this article and subscribe our page if you like analysis!

$BTC Inverse Head and Shoulders Finally FormedAnd just like that, the Death Cross has formed the right shoulder for the Inverse H & S idea I formed on March 14th
We may sit a bit more downside to retest the 50WMA at $76k for confirmation
If we get a V-shaped recovery tomorrow, this very well could be the bottom for CRYPTOCAP:BTC

BITCOIN Will GO UP! Buy!
Hello, My guys!
And welcome to the todays analysis!
BITCOIN has tanked recently but
the bulls stood their ground so we
Are seeing a powerful rebound
And we will be expecting to continue!
Good Luck Everyone!

Possible Huge Long Zone on Bitcoin ⚡ Bitcoin (BTC/USDT) – Daily Chart: Bullish Reversal on the Horizon? 📈
(Please check my previous posts before reading this last one regarding BTC)
BTC just tapped into a high-confluence Long Zone between $73,700 – $65,260, which acted as a powerful demand area during the last rally back in late 2024. After a recent drop of today, price is now sitting at a key decision level. 🟢
🔹 Long Zone: $73,700 – $65,260
🔹 Historical Support: Held in late 2024 before a major run
🔹 Target Level: $108,000
🔹 Potential Breakout Zone: A strong close above $108,000 as higher targets
📈 If price holds this zone, we could see a strong bullish reversal toward the $108,000 or higher. The descending wedge pattern hints at a textbook accumulation-to-expansion setup—but only with proper confirmation. 🚀
🟢 High reward-to-risk setup for swing traders watching for trend shifts.
⚠️ Don’t rush in. Look for signs of strength before entering and take care of your risk management system.
Are you bullish on BTC/USDT once it touches the $73,700 level? Let’s discuss! 👇

ETHEREUM SHORT TO $786! (UPDATE)ETH dumping really hard! The Crypto market overall is very bearish right now, but ETH specifically I’ve been calling it since 2024.
$786 still remains our Wave C target of my ‘Elliott Wave Theory’ strategy. Let’s see if we still a straight dump towards $786, or do we see some sort of slow down in bearish momentum.

NASDAQ, S&P 500 and CoinMarketCap movements, Bitcoin chart
Hello, traders.
If you "Follow", you can always get new information quickly.
Please click "Boost" as well.
Have a nice day today.
-------------------------------------
We need to check the movement after a new candle is created.
USDT, USDC should gap up to know that funds have flowed into the coin market.
On the other hand, if there is a gap down, I think funds have flowed out of the coin market.
Therefore, I think USDT or USDC are showing the size and flow of funds in the coin market.
-
(BTC.D 1M chart)
If BTC dominance is maintained above 62.47 or continues to rise, altcoins are likely to show a large decline.
Therefore, in order for an altcoin bull market to begin, it must fall below 55.01 and remain there or continue to decline.
-
(USDT.D 1M chart)
USDT is a fund that has a large influence on the coin market.
Therefore, if USDT dominance rises, it means that the coin market is likely to show an overall decline.
On the other hand, if it falls, it can be interpreted that the coin market is likely to show an overall rise.
In order for the coin market to start an upward trend, it must fall below 4.97 and remain there or continue to decline.
In particular, if the Fibonacci ratio rises above 0.618, the coin market is likely to plummet.
If it remains above the Fibonacci ratio of 0.618, it is likely to rise to around 7.14.
-------------------------------------------
(NAS100USD 12M chart)
It has currently entered the most important support and resistance zone.
-
(1W chart)
Therefore, the maximum decline point is expected to be around 14922.2.
In order to continue the uptrend, the price must be maintained above the M-Signal indicator on the 1M chart.
Therefore, the key is whether it can receive support near the most important support and resistance zone and rise above the M-Signal indicator on the 1M chart.
---------------------------------------------
(SPX500USD 1W chart)
The key is whether it can be supported around 4773.4-4846.1 and rise above the M-Signal indicator on the 1M chart.
If not, the maximum decline is expected to be around 3875.1-4116.0.
---------------------------------------------
(BTCUSDT 1M chart)
As I mentioned before, since the dotted trend line (1) is not acting as a clear trend line, there is a high possibility of volatility.
Therefore, when the StochRSI indicator creates a peak in the oversold zone and rises this time, there is a possibility that a trend will be formed as a trend line between lows is created.
However, the high-point trend line and the low-point trend line must be formed in the same direction.
In other words, since the current high-point trend line is creating an upward trend line, the low-point trend line that will be created this time must also create an upward trend line.
In that sense, the 69000-73199.86 section can be seen as an important support and resistance section.
If it falls below 69000, it is likely to touch the Fibonacci ratio section of 0.886 (56227.18) ~ 1 (61338.93), which was the previous high point section.
-
(1D chart)
On the last day of this volatility period, it fell below the upward trend line (2), showing a large decline.
Since it fell below the downward trend line, there is a possibility that it will continue to fall further.
At this time, the key is whether it can rise with support near 73499.86.
The next volatility period is around April 25 (April 24-26).
The point of interest is whether the price is maintained near 73499.86 or 89294.25 after the next volatility period.
-
The 73499.86 point is the HA-High indicator point on the 1M chart.
The M-Signal indicator on the 1M chart is rising to around 73499.86.
Therefore, if support is confirmed near the M-Signal indicator on the 1M chart, I think it is an aggressive buying period.
If it falls below the M-Signal indicator on the 1M chart, it is a buying period until it rises again and supports near the M-Signal indicator on the 1M chart.
The next time to buy is when it shows support near the Fibonacci ratio range of 0.886 (56227.18) ~ 1 (61338.93) that I mentioned in the 1M chart explanation.
-
Thank you for reading to the end.
I hope you have a successful trade.
--------------------------------------------------
- This is an explanation of the big picture.
I used TradingView's INDEX chart to check the entire range of BTC.
I rewrote the previous chart to update it while touching the Fibonacci ratio range of 1.902 (101875.70) ~ 2 (106275.10).
(Previous BTCUSD 12M chart)
Looking at the big picture, it seems to have been maintaining an upward trend following a pattern since 2015.
That is, it is a pattern that maintains a 3-year uptrend and faces a 1-year downtrend.
Accordingly, the uptrend is expected to continue until 2025.
-
(Current BTCUSD 12M chart)
Based on the currently written Fibonacci ratio, it is displayed up to 3.618 (178910.15).
It is expected that it will not fall again below the Fibonacci ratio of 0.618 (44234.54).
(BTCUSDT 12M chart)
Based on the BTCUSDT chart, I think it is around 42283.58.
-
I will explain it again with the BTCUSD chart.
The Fibonacci ratio ranges marked in the green boxes, 1.902 (101875.70) ~ 2 (106275.10) and 3 (151166.97) ~ 3.14 (157451.83), are expected to be important support and resistance ranges.
In other words, it seems likely that they will act as volume profile ranges.
Therefore, in order to break through these ranges upward, I think the point to watch is whether they can receive support and rise near the Fibonacci ratios of 1.618 (89126.41) and 2.618 (134018.28).
Therefore, the maximum rising range in 2025 is expected to be the 3 (151166.97) ~ 3.14 (157451.83) range.
In order to do that, we need to see if it is supported and rises near 2.618 (134018.28).
If it falls after the bull market in 2025, we don't know how far it will fall, but based on the previous decline, we expect it to fall by about -60% to -70%.
Therefore, if it starts to fall near the Fibonacci ratio 3.14 (157451.83), it seems likely that it will fall to around Fibonacci 0.618 (44234.54).
I will explain more details when the bear market starts.
------------------------------------------------------

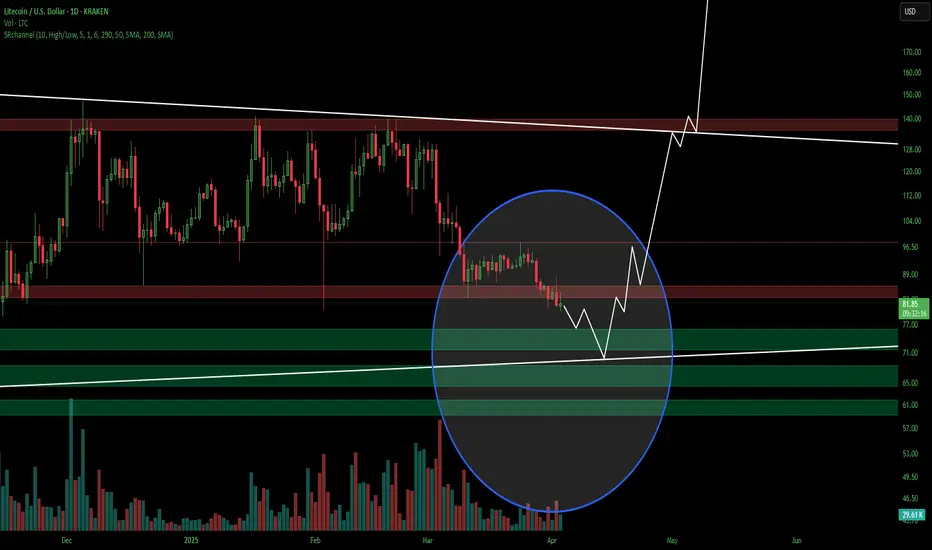
LTCUSD Litecoin OH NO TARIFFS! Everyone SELL NOW!The market reacted to the tariffs negatively as expected. I don't think these tariffs will last long. Countries will cave and remove their tariffs. Bottom line is they need us more than we need them. Once global free and easier trade starts you're going to see a boom cycle like never before. This is the bottom and the beginning of the biggest bull run you'll ever see. I don't get involved in politics but this move that Trump made with the tariffs is going to be a major positive for the USA and the world moving forward. This isnt 1929, we live in a much more advanced world now. Collapses and depressions are a thing of the past in my opinion.
As for Litecoin I see it coming down to test around $70 dollars by the middle of April. This is also timed almost perfectly to the 2017 run Litecoin had, coincidentally trump was starting his first term in 2017 as well. Also timed perfectly to when tax day is over for USA.
Many have capitulated and sold everything thinking a giant recession is coming, or a war, or a collapse, or aliens, or you name it people are scared of their own shadows lately. Like a plague of Grackles where one gets spooked and the whole lot of them get scared and take off when they dont even know why. This is how the markets work though, most will make the wrong decision so the few who made the right decision can profit from their mistakes. Once the market starts to run again those who sold will think its just a fake pump or dead cat bounce and wont buy in. Then the market will continue to rise and rise and finally when its near an all time high those who capitulated and sold early will fomo back in and buy the top to provide liquidity for those who were called crazy for buying the bottom. Its a cycle thats been happening since markets started.
So Im sticking with my predictions for Litecoin, I am not falling for this bear trap crap. Im doubling down. This is not financial advice. This is just my opinion.
Bitcoin Outlook Amid Uncertainty and Mempool Congestion
This chart captures the current critical juncture for Bitcoin as it tests the 0.618 Fibonacci retracement level (~$74,277), a zone historically associated with trend reversals. The bounce or breakdown from this region may shape the mid-term trajectory.
The recent drawdown is not happening in a vacuum. Global macroeconomic turbulence including increasing U.S. tariffs, rising bond yields, and parallels to the 1985 Plaza Accord suggests deeper structural fragility. If history rhymes, we may be staring at the early tremors of a broader economic reset, possibly invoking a modern black swan event.
Technically, if support holds, Bitcoin may attempt a retracement back to the 0.5 or 0.382 levels (~$81,000–$87,000), but failure to defend this zone could open the door to the 0.786 retracement at $64,753 or worse, the full retrace to $52,622.
Compounding the uncertainty, network congestion continues to pressure transaction times and fees, especially during volatility spikes. Traders and institutions seeking faster confirmation may benefit from acceleration services to avoid critical delays during times of stress.
To help mitigate transaction bottlenecks during peak periods, a BTC accelerator Like fujn.com offers a Bitcoin transaction accelerator service for users who need faster confirmation times. This becomes especially valuable during mempool congestion, which often spikes alongside macro-driven volatility and sell-offs.
As technicals and fundamentals intertwine, keep an eye on both the chart and the mempool.
