BITCOIN - Price Could Be Heading Towards 60K...After multiple rejections at higher price levels, the most recent major rejection—followed by a break of the lows—suggests that the corrective move we've seen since the end of February may have concluded.
In this video, I outline the key reasons why a larger upside move no longer appears likely.
With the potential end of the corrective wave combinations now in sight, I'm shifting to a bearish outlook, targeting a potential move down to $61K. To validate this view, we need to see a break below $81,222, confirming the start of a deeper breakdown.
As it stands, I can no longer support a short-term bullish scenario unless we see a strong break above $84,715. However, given the recent sharp move to the downside, this seems unlikely and may, in fact, mark the beginning of a larger downward trend.
Bitcoin (Cryptocurrency)

Short Position BTC/USDTBitcoin is approaching a key Short Zone between $83,443 – $84,616, a region where previous price action has shown clear rejections. This resistance zone is marked in red on the chart. We’re currently hovering just below that at $83,000.
🔹 Short Entry Zone: $83,443 - $84,616
🔹 Target Profit (TP): $80,233
🔹 Risk/Reward Ratio: Solid RRR setup for disciplined traders
📌 If price re-tests this zone and fails to break higher, this could be an ideal area for short entries with a clean downside toward the TP zone highlighted in green.
⚠️ Always manage your risk. Wait for rejection confirmation signals before entering.

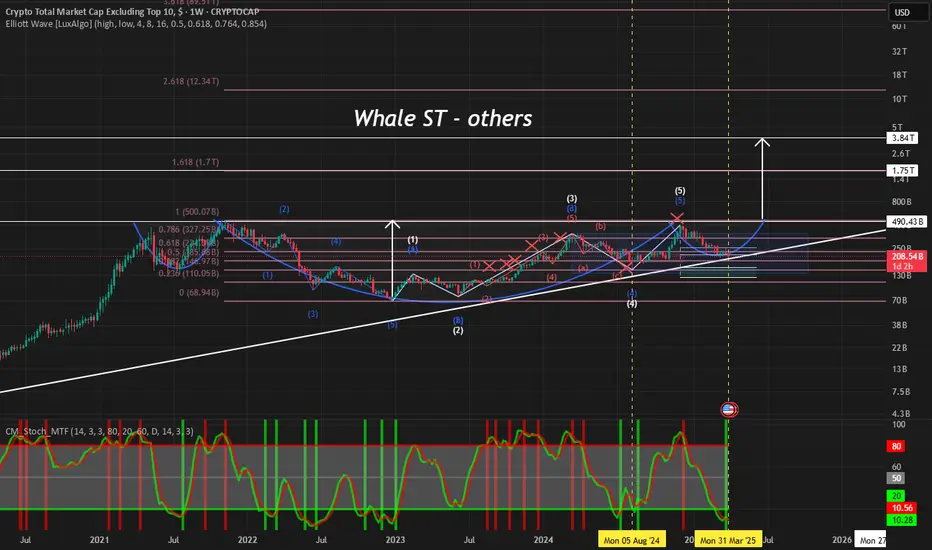
$others @whalest_The Others chart has not yet seen its old peak. I think the big rise will start soon. This chart represents other altcoins except for big projects. There will be exciting times soon.
SAY IT BACK BTCBitcoin is in the retest phase after the handle cup formation breakout, after which the rise phase will be inevitable.

Alert! Bitcoin Below 90K—20X (Top Altcoins Choice —Your Pick)Bitcoin is still trading below $85,000 and $90,000, the best possible entry prices and timing before the major 2025 bull-market cycle. This cycle is expected to last a long time and reach prices as high as $250,000, more or less.
Right now it is possible to buy Bitcoin up to 20X, experts only.
I am opening several potions, one with 20X, some with 10X and another one with 8X. The market will take care of the rest. This is truly a once in a half decade opportunity.
Bitcoin is not the only Crypto of course and leverage is not the only option we also have spot. Many Altcoins are set to grow really strong and will grow really fast in this bull-market cycle. An Altcoins can grow 100% while Bitcoin grows 10%. Others can grow 300-400% when Bitcoin grows 30%. Choose wisely. There are many options. Plan ahead.
This is a friendly reminder because time is running out.
The time to enter the market, the time to buy is now, or weeks and months ago.
We are still within the accumulation phase.
We are still at bottom prices.
The time to buy is when prices are low trading near support —now!
Now is the best time to buy and hold.
Thanks a lot for your continued support.
Let's do a Top Altcoins Choice —Your Pick (Name Your Altcoins) session for the good old days. I will make a new post with instructions. If you want to participate, please leave a comment letting me know. I will take a maximum of 700 requests, 3 per user.
Thanks a lot for your continued support.
Bitcoin is going up!
Namaste.

Cryptocurrency and Stocks will DecoupleI still remember the AI saying that NVDA was going to 320 "in the near future." This was back in June 2024. No matter when you asked the AI, its only prediction would be up, it couldn't make an analysis based on the data coming from the chart. The program wasn't very intelligent, that's what I concluded.
I disagreed. NVDA is going down and this is now fully confirmed.
We are seeing a very long distribution phase and the crash is now taking place.
Ok, but what about Bitcoin?
Bitcoin will decouple from traditional markets, just look at the news.
While Cryptocurrency is due a generational bullish wave, the stock market is due a generational retrace.
I honestly don't know how the stock market will perform but I can look at individual charts. NVDA is bearish and going down strong.
NVDA, TSLA, the SPX, the NDX and Crypto are not the same. These are two completely different monsters.
The SPX and NDX is landline.
Crypto is free wireless internet for all.
The SPX and the NDX is centralization and control.
Bitcoin is decentralization, innovation, technology and freedom.
Times change.
The stock market will recover and it is sure to continue growing long-term.
Will the establishment let it crash or will they jump in and pump it up?
I don't know. But NVDA is bearish and going down. What one does, the rest follows.
But, what about Bitcoin? Bitcoin is going up.
It is very simple. They will decouple, they will not move together anymore. Many, many Altcoins are trading at bottom prices, many stocks are trading high up.
The giant stocks will crash, while the Cryptocurrency market goes up. This is one more of the reasons why we are about to experience the biggest bull-market in the history of Crypto.
People are evolving, the world is changing. We are changing from centralized monopoly money, to a free decentralized technology that is available for all.
Money is not the paper, the shiny stone or the codes; money is what we decide to use for the purpose of exchanging value.
At one time, salt used to be money as well as cows. Sea shells, glass and cacao are also on the list. People used to use these things as money.
The argument that Bitcoin has no value is obviously flawed. If you want to buy a Bitcoin you have to pay a price, that's value, nothing more.
If we decide to use something as money, it becomes money.
Bitcoin is money for the new generation.
The old generation dies out and a new one takes its place.
Life will continue to evolve and money will do the same.
Now it is Bitcoin, later down the road it will be something else. But Bitcoin has value, it is really expensive and it will continue to grow.
After the crash, NVDA will recover for sure.
Namaste.

LTC ANALYSIS (support & resistance)🔮 #LTC Analysis 🚀🚀
💲💲 #LTC is trading between support and resistance area. There is a potential rejection again from its resistance zone and pullback from its major support area. If #LTC sustains above major support area then we will a bullish move till its major resistance area
💸Current Price -- $82.20
⁉️ What to do?
- We have marked crucial levels in the chart . We can trade according to the chart and make some profits. 🚀💸
#LTC #Cryptocurrency #DYOR

COTI ANALYSIS 📊 #COTI Analysis
✅There is a formation of Descending Channel Pattern in weekly time frame in #COTI.
Also there is a perfect breakout and retest. Now we can expect a bullish move from major support zone. If not the we will see more bearish move and then a reversal in #COTI.
👀Current Price: $0.06390
🎯 Target Price : $0.08660
⚡️What to do ?
👀Keep an eye on #COTI price action and volume. We can trade according to the chart and make some profits⚡️⚡️
#COTI #Cryptocurrency #Breakout #TechnicalAnalysis #DYOR

IP ANALYSIS🔮 #IP Analysis 💰💰
🌟🚀 As we can see that #IP is trading in a symmetrical triangle and there was a breakdown of the pattern. Last time there was a bullish move from the same support level. We can expect again a bullish momentum from its major support level🚀🚀
🔖 Current Price: $4.190
⏳ Target Price: $5.500
#IP #Cryptocurrency #DYOR

TONUSDT BuyTON Buy signal on H4 chart. Daily trend is strong enough to push price higher. Risk reward 1/5

XAU/USD: First Long,Then SHORT! (READ THE CAPTION)By examining the gold chart on the 15-minute timeframe, we can see that the price is currently trading around $3122, and I expect the price to soon reach higher levels such as $3128, $3133, $3135, and $3143, and after reaching each of these important levels, we will probably see an initial negative reaction!
Ultimately, I expect a strong rejection from the price once gold reaches $3144!
The level of this analysis is very high, so make sure to study it carefully!
Don’t forget to support this analysis!
Please support me with your likes and comments to motivate me to share more analysis with you and share your opinion about the possible trend of this chart with me !
Best Regards , Arman Shaban

TradeCityPro | Bitcoin Daily Analysis #52👋 Welcome to TradeCity Pro!
Let's delve into the analysis of Bitcoin and the key cryptocurrency indices. Today, we have a detailed analysis on hand, and I want to start from scratch by drawing all the lines for Bitcoin and other indices so we can get informed about the higher time frames without drawing unnecessary lines.
🔍 Let's get into the analysis, where the charts will be examined in weekly, daily, and 4-hour time frames.
🦁 Bitcoin Analysis
📅 Weekly Time Frame
Let's explore the weekly timeframe. As you can see, the market trend is bullish, and since the price reached the low of 16,000, a bullish structure has formed, and the price has moved upward along a curved trendline. The trendline isn’t very clear on the chart, so I'll put another chart below for you if needed.
✔️ Currently, after two powerful bullish legs that occurred after breaking 31,000, the price has reached the resistance of 104,000 and has entered a corrective phase. The price was moving up with high momentum and no divergence until it reached 71,000, but the next peak at 104,000 was accompanied by divergence, and now the RSI is near triggering this divergence.
⚡️ Overall, the price is in a very critical and sensitive area, and breaking the 44.83 area on the RSI could activate the divergence, and simultaneously, the price may also break the curved trendline, which is not a good sign for the bullish trend and could indicate a trend reversal.
🔼 We must consider that the last bullish leg from 54,000 to 104,000 was much shorter compared to the leg from 31,000 to 71,000. However, I personally see the trend as bullish until the price drops below the 71,000 area, and until a lower high and low are seen below this area, the trend will remain bullish.
📊 If the price sharply falls, breaking 54,000 will confirm a trend change. However, we can get confirmation of a trend change sooner in lower time frames, which I will discuss in the continuation of the analysis.
💥 But everything is set for Bitcoin to rise. The RSI oscillator is at its main bottom, and in this bullish cycle, each time the RSI reached this area, the next bullish leg started. On the other hand, the price has reached the curved trendline, and there is positive news like Bitcoin's strategic reserves in the US, so conditions are ripe for a rise.
📈 Thus, with a break of 104,000, we can confirm the next leg and buy Bitcoin targeting a new ATH.
🎯 To find the target, we can use Fibonacci Extension. As you see, the price has moved up to the 0.618 Fibonacci level and reached the 104,000 area, currently in a corrective phase to 0.382. If it can rise above 0.618 again, the next targets are 0.786, 1, and 1.272, which correspond to areas 123,000, 154,000, and 204,000, respectively.
👀 Let’s go to the daily timeframe to observe the price details more closely.
📅 Daily Timeframe
In the daily timeframe, as you can see, in the bullish leg that occurred after breaking 71,000, the price moved upward and reached 106,000 and, after breaking the 0.236 Fibonacci overlapping with 92,000, went into a deeper correction to 0.5.
⭐ In this corrective leg, the price has created a descending trendline that has been touched several times by the price and is now still engaging this area. If it can break this trendline, the correction will end, and we could see a price increase again.
🧩 In the RSI oscillator, a resistance has formed at 52.26, and breaking this area could bring bullish momentum into the market, which increases the likelihood of breaking the trendline and activating its trigger.
⚡️ There is also a temporary support in the area of 82,124, and if the price gets rejected from the trendline, the likelihood of breaking this support increases, and the price could undergo another bearish leg down to areas 76,000 or 71,000.
🛒 Currently, for buying Bitcoin in spot, the first trigger is the breaking of 87,740, which is a trendline trigger and will be activated after the trendline is broken. The main trigger will be after breaking 106,546, which is the ATH, and a new bullish phase could start.
☘️ The next trigger for Bitcoin is further falls and reaching lower support areas. If the price reaches areas 76,000 or 71,000 and forms a structure there, with the break of the ceiling of the structure, we can carry out a spot purchase, and if this happens, I will specify its triggers in future analyses.
⏳ 4-Hour Time Frame
Let's go to the 4-hour timeframe to review the triggers for Bitcoin futures.
🎲 As you see in this timeframe, a descending triangle has formed, and the price is moving inside it. The dynamic line of this triangle is the daily trendline, and the static line of this triangle is the 81,509 area, which both are important areas and can have a significant impact on the price.
✔️ We are currently in the latter half of the triangle, which is why behaviors and irrational fluctuations have increased, and as you can see, the price has once broken the ceiling of this triangle but couldn’t reach the trendline break trigger and has returned to the triangle.
📈 Currently, for a long position with the break of 84,414, you can enter a position. This position is risky because the trigger is inside the triangle and will be a prelude to breaking the daily trendline. The next main trigger will be after breaking the trendline and activating the 88,344 trigger.
🔽 For a short position, the bottom 81,509 is a very important floor, and with the break of this area, the price can move towards the triangle's target and the 78,620 support.
👑 BTC.D Analysis
📅 Weekly Time Frame
Let's move on to the analysis of Bitcoin dominance. In the weekly timeframe, as you see, a slow and steady bullish trend has been created after breaking 47.33, moving upward along with a bullish trendline, and has once broken this trend from below but has returned above this dynamic area.
🧲 As long as this index is bullish in the bullish legs of the market, Bitcoin will move up more than altcoins, and the increase in Bitcoin dominance causes altcoins to behave very similar to Bitcoin, and it is less likely that the trends of altcoins and Bitcoin diverge.
📚 You can see the impact of this trend inside the Bitcoin and altcoin charts. Bitcoin has registered its previous peak at 106,000 and has recorded a much higher ATH compared to 69,000, but most altcoins in this leg that the market had didn't even reach their previous peaks.
✨ The trend is still bullish without any weakness, and recently, an important ceiling in the area of 60.37 has been broken and has pulled back to it, and now it is moving towards the next resistance, namely 71.43.
💥 But I think dominance will fall before it reaches 71.43 because the dominance is very high right now, and any correction that Bitcoin has causes very severe falls inside the chart, and well, when altcoins fall enough, whales and major investors will enter the altcoin market, which naturally causes Bitcoin dominance to fall.
🔑 So to know when major investors and whales enter altcoins, we have to wait until Bitcoin dominance falls, and this event is currently happening in the weekly timeframe after breaking the trendline and confirming a trend change below this trendline, and until then, Bitcoin will be the capital for better purchases.
📅 Daily Timeframe
Let's move to the daily timeframe. As you can see, after breaking the resistance of 60.37, dominance created a box between 60.37 and 62.16, and now with the break of the box's ceiling, a new bullish leg of dominance has started.
✔️ I usually analyze dominances only with simple tools like support and resistance, but now because I can't get any targets out for dominance, I took help from Fibonacci, and as you see, the potential resistances of dominance are 63.31, 65.15, and 66.49.
🔍 Currently, there is no sign of weakness or trend change in this timeframe, but if for any reason dominance falls and returns below 62.16, we will take the main confirmation of trend change from 60.37.
😎 Let's go to the 4-hour timeframe to find suitable triggers for these dominance futures.
⏳ 4-Hour Time Frame
In this timeframe, we have a temporary ceiling in the area of 63.02, and if it is broken, the price can continue its bullish movement.
💫 For dominance to fall, we currently don't have any triggers in this timeframe and have to wait for a bearish structure to form.
📈 Total2 Analysis
📅 Weekly Timeframe
Let's move on to the analysis of Total2. In this chart, we can very clearly see the impact of Bitcoin dominance on altcoins.
👀 As you can see, the conditions of Total2 are very similar to Bitcoin and are converging, but Bitcoin in the last bullish leg it had registered a new ATH, and Total2 could not do this. On one hand, Bitcoin has just reached its curved trendline and is reacting to it, but Total2 has broken this trend line and has performed a bearish leg. For example, Bitcoin has not yet reached the 71,000 area, but Total2 has long broken 1.21T and is moving towards the bottom of 816B.
🔑 The reason for all these events is that Bitcoin dominance is bullish and causes more money relative to altcoins to enter Bitcoin, and this also makes the bullish trend of Bitcoin more powerful than this index.
🛒 For buying altcoins, the triggers of Total2 are areas 1.21T and 1.61T, but until Bitcoin dominance falls and its trendline is broken, do not pay attention to these triggers and enter the market with Bitcoin triggers while dominance is bullish.
📅 Daily Time Frame
Let's move to the daily timeframe. Concurrent with the fall of Total2, a descending channel has formed, which in Bitcoin was a descending trendline, but here, as you can see, Bitcoin is involved in breaking the trendline and starting an upward wave, but Total2 has long been rejected from the trendline and is involved in breaking the middle line of the channel, which overlaps with the 961B area, and with the break of this area, the next price leg can start.
⚡️ This is another example of the impact of Bitcoin dominance on the market. I mentioned these examples to get you to take dominances seriously and know how important they are and can help us in analysis.
🔽 The trigger for the fall and bearish turn of Total2, as I said, is the breaking of 961B, and if this area is broken, the price can move to the static supports of 816B and 683B. The dynamic support is the bottom of the channel, which can act as a support to prevent the price from falling.
📈 For bullishness and buying spot, breaking 1.1T is suitable. Again, I remind you that until Bitcoin dominance falls, these triggers are not very useful and do not initiate the trend of altcoins.
⏳ 4-Hour Time Frame
Let's move to the 4-hour timeframe to review the triggers for futures.
⭐ In this timeframe, I don't have much to say, and I just want to specify the triggers for you. For a long position, the area of 1.02T is suitable, but it is better that this happens after breaking the channel, which would turn it into a better trigger. The main long position will occur after breaking 1.1T.
📉 But for a short position, we have a very good and important trigger in the area of 961B, and I suggest that you definitely have a short position on an altcoin if this area is broken.
✔️ USDT.D Analysis
📅 Weekly Time Frame
In the weekly timeframe, Tether dominance has created a large box between 3.78 and 6.21 and has been moving between these two areas since early 2024.
💥 On the other hand, it has a descending trendline that the price has touched twice, and now it has reached it for the third time. A trendline that has been reacted to twice is not a very reliable trendline, but if the price returns from this area this time, we can confirm that this trendline exists and is a dynamic supply area.
☘️ Currently, with the range box that has formed, we have a very easy job for Tether dominance. With the break of 6.21, we confirm bullishness, and with the break of 3.78, we confirm bearishness.
📅 Daily Time Frame
Let's move to the daily timeframe, where we can witness more details.
🎲 As you can see, the price is very close to the trendline that was evident in the weekly timeframe and can activate its trigger.
⚡️ If the trendline is broken, a very important trigger exists in the area of 5.68, and with the break of this area, we can get confirmation of the bullishness of dominance at least until the ceiling of 6.34.
🧲 On the other hand, if dominance is rejected from this trendline, with the break of 5.03, dominance can create another bearish leg down to 5.37 or 3.78.
💣 I have nothing else to say about Tether dominance because its trend is ranging, and its situation is clear for now, let's move to the 4-hour timeframe to review the triggers for futures.
⏳ 4-Hour Time Frame
In this timeframe, we can change the trigger for bullishness a bit and bring it to the area of 5.56. If this area is broken, dominance can start a bullish leg.
🧩 For Tether dominance to fall, we also have a riskier trigger in the area of 5.43, and the main trigger will still be the area of 5.03.
🚨 This was a complete analysis of Bitcoin and the indices. It had been a while since we had looked at the higher timeframes, so I decided to review all the symbols in three timeframes. I hope this helps you and you can use this analysis.
❌ Disclaimer ❌
Trading futures is highly risky and dangerous. If you're not an expert, these triggers may not be suitable for you. You should first learn risk and capital management. You can also use the educational content from this channel.
Finally, these triggers reflect my personal opinions on price action, and the market may move completely against this analysis. So, do your own research before opening any position.

HelenP. I Bitcoin can rebound up from support zone to trend lineHi folks today I'm prepared for you Bitcoin analytics. Some time ago, BTC showed a strong downward move that brought the price into the support zone between 82200 and 80900 points. This area acted as a major demand zone, and after several retests, the price formed a solid base. From this support, BTC made a sharp bullish impulse, breaking through local resistance and heading toward the descending trend line. Eventually, the price reached the key resistance zone and tested the trend line, but failed to break through it. After that, BTC started to decline again and returned to the support zone around the 82200 level, where it is currently consolidating. At the moment, the price is trading near the lower boundary of the support zone. The strong reaction from this zone in the past and the overall price structure suggest that bulls are still active. Given the previous impulse move, the bounce from the support, and the clear target structure, I expect BTCUSDT to rise from the current level toward my goal at 87500 points. If you like my analytics you may support me with your like/comment ❤️

BITCOIN SHORT FROM RESISTANCE
BITCOIN SIGNAL
Trade Direction: short
Entry Level: 84,003.04
Target Level: 81,357.30
Stop Loss: 85,763.63
RISK PROFILE
Risk level: medium
Suggested risk: 1%
Timeframe: 1h
Disclosure: I am part of Trade Nation's Influencer program and receive a monthly fee for using their TradingView charts in my analysis.
✅LIKE AND COMMENT MY IDEAS✅

Ethereum TA 25.4.5Hello everyone, I hope you are doing well. Ethereum on the 4-hour timeframe got rejected after hitting a strong order block and started forming new lows. Given the current chart conditions, we have two order blocks in the high price area and we expect the price to return to these levels. If we see a short setup, we will enter a short position with a target of 1750. For now, I am not suggesting a long position and will wait until the pullback on the chart is complete.
⚠️ This Analysis will be updated ...
👤 Sadegh Ahmadi: GPTradersHub
📅 25.Apr.5
⚠️(DYOR)
❤️ If you apperciate my work , Please like and comment , It Keeps me motivated to do better

Bitcoin TA 25.4.5Hello friends, I hope you are doing well. In this daily timeframe, we have an order block that has caused a price level to break. Inside this daily order block, there is a hidden order block that can be observed in the 4-hour timeframe, which has the potential to push the price down to $74,000. We are waiting for the price to reach this order block as indicated in the chart, and then we will look for a trigger in the 15-minute and 5-minute timeframes to set up a short position with a target of $74,000. This is my roadmap. If there are any changes, I will definitely inform you.
⚠️ This Analysis will be updated ...
👤 Sadegh Ahmadi: @GPTradersHub
📅 25.Apr.5
⚠️(DYOR)
❤️ If you apperciate my work , Please like and comment , It Keeps me motivated to do better

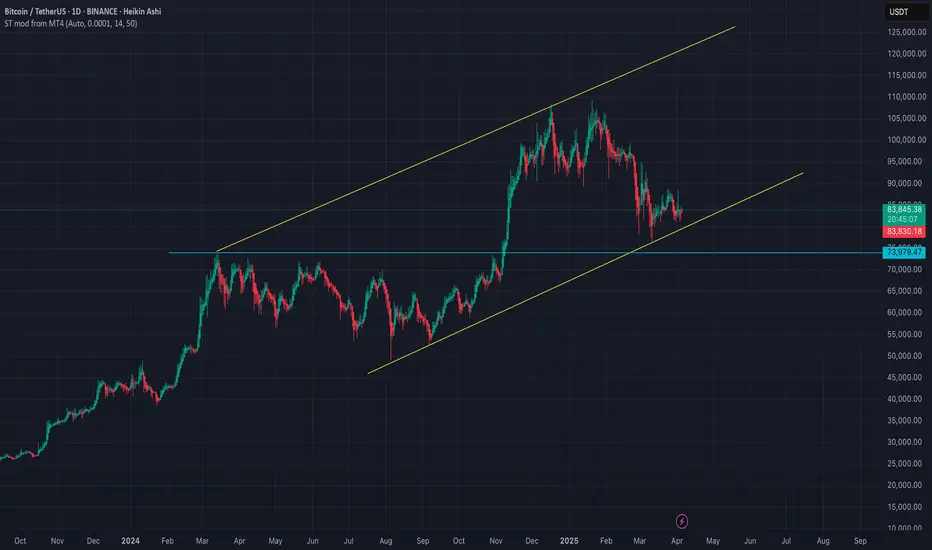
levels to watch I had previously highlighted a potential top around the 100-108k range, with a measured target of around the 75k level. The market did, in fact, drop to around 76k. For now, it's respecting the uptrend channel, and we can expect the market to target 90,000. If those levels are breached, it could push the market above 100,000, with new highs potentially reaching around 125,000, as I mentioned in my earlier article.
$VIX Hits 45! $BTC Historically Pumps Soon AfterThe TVC:VIX has only hit above 45 on 5 occasions in the history of CRYPTOCAP:BTC
Each time it did, BTC pumped at least 20%

Check if it can rise along the rising trend line (2)
Hello, traders.
If you "Follow", you can always get new information quickly.
Please click "Boost" as well.
Have a nice day today.
-------------------------------------
We need to see if USDT and USDC can continue the gap uptrend.
-
(BTC.D 1M chart)
If BTC dominance rises above 62.47 and maintains or continues to rise, altcoins are likely to record a larger decline.
Therefore, you should think about how to respond to the altcoins you are trading.
If the uptrend continues, it is expected to rise to the Fibonacci ratio range of 0 (73.63) ~ 1 (77.07).
In order for the altcoin bull market to begin, it must fall below 55.01 and be maintained or show a downward trend.
-
(USDT.D 1M chart)
In order for the coin market to begin an upward trend, the USDT dominance must fall below 4.97 and be maintained or show a downward trend.
If it does not, and it rises, the coin market is likely to show a downward trend.
We need to see if it can meet resistance near the Fibonacci ratio of 0.618 and fall.
If not, the coin market will show a large downward trend as it rises to around 7.14.
-
USDT is likely to continue to rise.
This is because it is the fund that supports the coin market.
Due to this, USDT dominance is also likely to continue its upward trend.
Therefore, rather than following the overall flow of USDT dominance, it is better to look at where it starts to decline.
-----------------------------------------
(BTCUSDT 1D chart)
Whether the price can be maintained above the M-Signal indicator on the 1D chart while maintaining the price above the upward trend line (2) and passing through April 4-6 is the key.
In order to continue the upward trend, it must rise above 89294.25, so if possible, we should also look at whether it can rise above 89294.25.
If it does not and falls along the downward trend line, it is possible that it will touch around 73499.86 during the volatility period around April 25.
-
The most recently formed high-point trend line is trend line (3).
And, the recently formed low-point trend line is the (2) trend line.
Since these two trend lines are not moving in one direction, we can see that we are currently in the volatility zone.
If the StochRSI indicator rises this time and forms a peak in the overbought zone and then falls, the high-point trend line will draw an upward trend line like the low-point trend line.
When that happens, it seems likely that the trend will start.
Therefore, the point of interest is whether the two volatility periods in this April, around April 5 and around April 25, will become turning points.
-
Thank you for reading to the end.
I hope you have a successful trade.
--------------------------------------------------
- This is an explanation of the big picture.
I used TradingView's INDEX chart to check the entire BTC range.
I rewrote the previous chart to update it by touching the Fibonacci ratio range of 1.902 (101875.70) ~ 2 (106275.10).
(Previous BTCUSD 12M chart)
Looking at the big picture, it seems to have been maintaining an upward trend following a pattern since 2015.
In other words, it is a pattern that maintains a 3-year upward trend and faces a 1-year downward trend.
Accordingly, the upward trend is expected to continue until 2025.
-
(Current BTCUSD 12M chart)
Based on the currently written Fibonacci ratio, it is displayed up to 3.618 (178910.15).
Fibonacci ratio 0.618 (44234.54) is not expected to fall again.
(BTCUSDT 12M chart)
Looking at the BTCUSDT chart, I think it is around 42283.58.
-
I will explain it again with the BTCUSD chart.
The Fibonacci ratio ranges marked in the light green boxes, 1.902 (101875.70) ~ 2 (106275.10) and 3 (151166.97) ~ 3.14 (157451.83), are expected to be important support and resistance ranges.
In other words, it seems likely to act as a volume profile range.
Therefore, in order to break through this section upward, I think the point to watch is whether it can rise with support near the Fibonacci ratios of 1.618 (89126.41) and 2.618 (134018.28).
Therefore, the maximum rising section in 2025 is expected to be the 3 (151166.97) ~ 3.14 (157451.83) section.
To do that, we need to look at whether it can rise with support near 2.618 (134018.28).
If it falls after the bull market in 2025, we don't know how far it will fall, but considering the previous decline, we expect it to fall by about -60% to -70%.
So, if the decline starts near the Fibonacci ratio 3.14 (157451.83), it seems likely that it will fall to around Fibonacci 0.618 (44234.54).
I will explain more details when the downtrend starts.
------------------------------------------------------

#BTC #BTCUSD #BTCUSDT #BITCOIN #LONG #SWING #Analysis #Eddy#BTC #BTCUSD #BTCUSDT #BITCOIN #LONG #SWING #Analysis #Eddy
BTCUSDT.P Swing Long Analysis With Entry Point
This is my first possible scenario and analysis of Bitcoin's future trend.
This Analysis is based on a combination of different styles, including the volume,ict & Price Action Classic. (( Head & Shoulder Pattern ))
Based on your strategy and style, get the necessary confirmations for this Swing long to enter the trade.
Don't forget risk and capital management.
Entry point already touched : 🟢 79285.50
The responsibility for the transaction is yours and I have no responsibility for not observing your risk and capital management.
🗒 Note: The price can go much higher than the first target, and there is a possibility of a 500% pump on this currency. By observing risk and capital management, obtaining the necessary approvals, and saving profits in the targets, you can keep it for the pump.
Spot Investing : ((long 'buy' position)) :
🟢 Entry 1 : 79285.50
🟢 Entry 2 : 61845.77 (( This Entry is for secound scenario ))
First entry point calculations :
⚪️ SL : Behind the last shadow created.
⚫️ TP1 : 250000 ((215.32%))
⚫️ TP2 : 500000 ((530.63%))
⚫️ TP3 : 999000 ((1160.00%))
‼️ Futures Trading Suggested Leverages : 3-5-7
The World Let it be Remembered...
Dr. #Eddy Sunshine
4/4/2025
Be successful and profitable.
Do you remember my first Bitcoin swing long signal entry & targets?
My first swing long signal was provided on BTC, which was spot pumped by more than 150% and was profitable :


Bitcoin's Buy Zone Revealed: The R/Evolution Of FinanceFor this bull-market, the buy-zone can extend as high as $100,000. This is because Bitcoin is set to grow above $160,000 to reach $180,000 and even up to $200,000 in the latter part of 2025. So even $100,000 can be a good entry for total profits of 100% when we reach 200K... If it goes higher, better!
Let's try again.
How are you feeling today?
A new day, a new chart; a great market.
While Bitcoin is solid right now, price-wise, it is still trading within our buy-zone.
Below $90,000 Bitcoin is an awesome buy. Have people been telling you this lately?
Yes? No!
No??? I am shocked. This is pure evil.
Bitcoin is now a great opportunity, a great buy when you consider that it will be trading 50% higher in a matter of months. Even better when you consider that everything that is Crypto related is set to grow.
Well, it is no problem, I am here to show my support.
Bitcoin is set to rise and it will rise really strong.
The last chance to buy at low prices is present and available now.
Bitcoin is an awesome buy below $90K.
Anything below 90,000 is great.
Below 80,000 is awesome but a rare opportunity and likely gone. This kind of price was only available for a few hours in 2025. Bitcoin has never closed below 80K weekly in its history. Were you aware of this fact?
The saying normally goes, "Sell in May and go away."
In 2025, this won't be the case.
The saying now is, "Buy everything now and become rich."
"Buy everything and hold strong."
Cryptocurrency is set to rise. Bitcoin is still trading at a nice price within our long-term accumulation-entry (buy) zone. The time is now.
Regardless of your strategy, your system, your method or your plan; accumulation is great.
You can accumulate now. If prices drop, buy more. If prices rise, buy more. When the rise becomes strong, hold. When the top is in or close, start to take profits because after a strong bullish phase comes a correction. You don't want to be caught holding during the correction. You can buy when prices are low. Hold as the market grows. Sell when the market peaks. If you sell when the market peaks, you can buy back-in when the next low is in. There is plenty of time to decide and take action. There is no way to miss a good entry.
Consider the chart and market now. Bitcoin has been sideways for months. Many months we have time to plan and buy. It will be the same after the end of the bullish cycle, so it will be wise to take profits when prices are up.
Buy and hold now. Sell later when everything grows.
I will be here to alert you of great timing to sell at the top.
Right now we are at the bottom. Nothing more needs to be said.
Bitcoin is trading within our long-term buy-zone.
You know what to do.
Take action.
Thanks a lot for your continued support.
Cryptocurrency was invented to usher a financial revolution. A revolution that is beneficial for all those involved. Everybody can win with Crypto, even the banks, if they adapt to the evolution of finance.
Imagine going against email and the Internet because it is new and you are the owner of the mailbox.
In retrospect, we know this to be simply unreasonable, we can only adapt and change because reality is always changing, no matter what our beliefs are or preferences. Today it is the same.
We have new money and humanity will never look back again.
We are in the early days of the Internet. The early days of Crypto. Those taking action now, will be looking like geniuses 10-20 years ahead. It is not too late. It is pretty early. Really early. Crypto is less than 20 years old. There are Bitcoins to be mined until 2140.
Join the revolution now, become the evolution of finance you yourself and get rich in the process.
Thank you for reading.
Namaste.

BTCUSD: Conservative September Target $150kBitcoin remains neutral on its 1W technical outlook (RSI = 46.307, MACD = 1999.100, ADX = 44.501), firmly supported on top of the 1W MA50. On this analysis you see the Channel Up that dictated the price action of the last three Cycles. Since December 2023 BTC has traded solely inside the 0.382 - 0.618 Fibonacci Zone, the median zone of the Channel Up. The Theory of pre-Halving / post-Halving symmetry implies that the time range from the Cycle Bottom to the Halving is almost the same as the time from the Halving to the Cycle Top. Since on the current Cycle, the time from the Bottom to the Halving has been 76 weeks, in theory the Top should be another 76 weeks from the Halving. We take the worst case estimate of 74 weeks like the 2017 Top. That's the end of September. And with regards to the target, a conservative estimate is just over the 0.5 Fib at 150k, like the highs of December 2024 and March 2024.
## If you like our free content follow our profile to get more daily ideas. ##
## Comments and likes are greatly appreciated. ##
