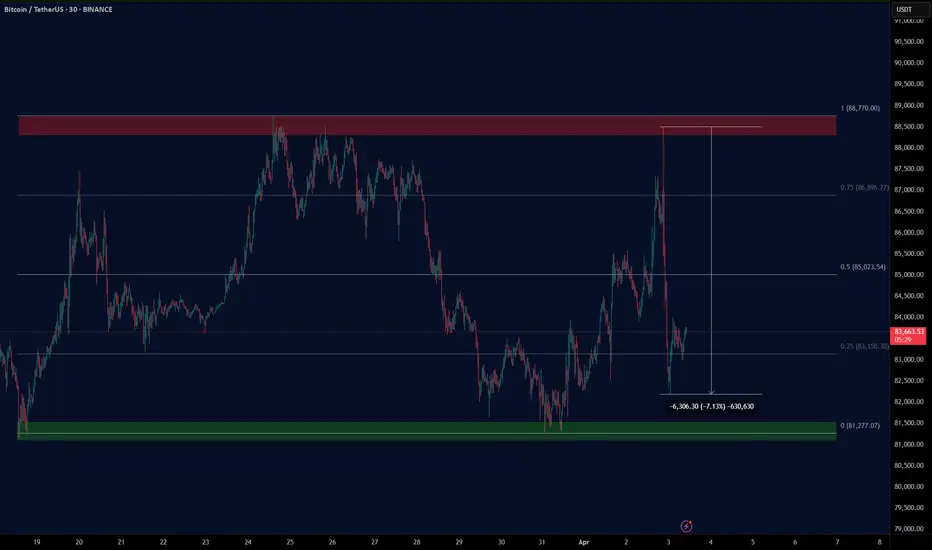
BITCOIN - Long Trade Price Action Update...In this video, I break down the latest price action while incorporating some AriasWave analysis along the way.
There's nothing unusual happening—just psychological reactions testing your patience.
Welcome to the world of trading lol, where you can be riding high one moment and facing losses the next, shifting between excitement and frustration.
Today, I dive into the psychology of trading—what drives a trader’s mindset, the balance between logic and mental discipline, and how mastering both can help grow your bank account. Everything begins in the mind, whether it’s knowledge or habit.
I remain bullish, and while the external picture hasn’t changed much, what about your internal one?
Bitcoin (Cryptocurrency)

$BTC RUNNING IS NOT OVER!CRYPTOCAP:BTC RUNNING IS NOT OVER!
Bitcoin will enter a new uptrend phase with the support it finds from the weekly uptrend support and the Bollinger Band lower point.

86K for another short sellMorning folks,
So, not occasionally we said in previous 2-3 updates that BTC action doesn't look bullish and we suggest a new nosedive. Now we have bearish engulfing pattern on weekly chart . And consider these two Fib levels for another short entry attempt. Of course, 86K would be just perfect, but it could start earlier. One of the possible shapes we consider a downside butterfly.
In general, re-test of 70-73K area on average fits to our long-term view.
In a case if 86K will be broken, it could mean that market is tending to 93.5K target, based on daily AB=CD pattern . But we consider this scenario as less probable due on overall BTC heavy performance in a recent few weeks.
Thus, for now, if you want to make a scalp long trade, you could try, but better to set initial target not higher than 86K.
Our major scenario is bearish and we consider 84K and 86K Fib levels for accumulation of a bearish position, unless something extraordinary will happen.
Profit to everybody, Peace.

BTC TARIFF TALKAs President Trump steps up on the stage to deliver his tariff plan BTC had a steady price rise going into the talk, a nice HH & HL LTF structure up into range high/ last weeks high, then as the speech began all of the progress made throughout the day wiped in less than 2 hours to reset BTC's price to Tuesdays low.
In the end the news event gave volatility as expected but ultimately the structure remains the same, rangebound. As the Tax year comes to an end it would be a hard ask for this choppy price action to shift bullish when institutions are going to be window dressing their portfolios for the next financial year.
In essence A continued LTF range with an overall HTF bearish trend looks to continue, this is compounded by yet another failed attempt at the 4H 200 EMA which had temporarily been broken but sent back below by the tariff announcements.
The SPX, DJI & NASDAQ Futures pre-market is looks dreadful so a revisit on the range low is probable on the cards at some stage today.
BITCOIN is exactly where it's supposed to be.Bitcoin (BTCUSD) is under heavy pressure lately due to the trade tariffs but as long-term investors, we shouldn't let this volatility affect us.
The MVRV has been one of the most consistent cyclical Top (sell high) and Bottom (buy low) indicators giving only a maximum of two optimal signals in each Cycle and it shows that the market is nowhere near a Top.
On the contrary the MVRV has spend the first 3 months of the year correcting from the 0.382 Fibonacci level to the 0.236. This is the exact same score it had i March 2017. Even in the other two Cycles that wasn't this low on Fibonacci levels, it still made a correction, flashing a red signal.
As the 1W MA50 (blue trend-line) continues to support, there are far more greater probabilities that the market will recover, turning the recent trade volatility into the best buy opportunity of 2025.
As far as a Cycle Top is concerned, it has always been an excellent exit signal when the MVRV hit the 0.786 Fib.
So do you think that will be the case? Feel free to let us know in the comments section below!
-------------------------------------------------------------------------------
** Please LIKE 👍, FOLLOW ✅, SHARE 🙌 and COMMENT ✍ if you enjoy this idea! Also share your ideas and charts in the comments section below! This is best way to keep it relevant, support us, keep the content here free and allow the idea to reach as many people as possible. **
-------------------------------------------------------------------------------
💸💸💸💸💸💸
👇 👇 👇 👇 👇 👇

Bitcoin: 120 In April, Part 2The market already bottomed.
The stage is set for the biggest bull-market in the history of Cryptocurrency.
The year is 2025. The bull-market starts in 2025 and can easily go beyond this year into early 2026.
Good things are about to happen.
Prepare for profits (change).
How are you feeling today my friend in this wonderful day?
Bitcoin bottomed and this is great.
Consolidation is something good that we can all appreciate. A time to rest, study, work and prepare for all the positive that we are about to experience. The market is good.
The market never moves in one single direction for too long. The market alternates and after a very strong wave, it gives us rest to prepare for what comes next. The rest period is reaching its end.
Bitcoin bottomed 28-February 2025.
A lower low and technical double-bottom happened 11-March 2025.
This is as good as it get.
Current market conditions allow for buying focused on the long-term.
This situation we are seeing now is amazing.
Traders, investors and the like can decide to buy spot and hold strong.
Leveraged traders can easily buy and hold up to 10X. Less than 8X is an easy entry with relatively low risk. Anything higher can be considered gambling.
At this point, loans can be taken out and the money goes into Crypto.
When a loan pays 6% yearly, or 20% if you live in a country like mine, Crypto will pay 600% in the same amount of time.
Getting a loan to buy Cryptocurrencies is not the best idea ever but it can be approached and benefit from by sound thinking and smart people. There are other ways to grow.
The market will go wild and will grow really strong.
While leverage can be used on the big projects, like Bitcoin, XRP and Cardano, Ethereum as well, smaller projects can offer the same growth potential but without the risk of a leveraged trade. That is, Bitcoin can grow 100% within 3-4 months. An Altcoin can grow 1,000% within 5 months and so on. Just some ideas.
Getting into the market can also happen gradually. Buy-in, buy into, accumulate with each check. Use the extra money to buy, buy and hold.
Fiat savings go into Crypto. The only way you are not into Crypto with fiat is if you are as old as Warren Buffet, that's the only reason not to buy Crypto, being too old. If you are less than 100 years of age, dive into Crypto because Crypto is the future of money and is here to stay.
We are gearing up for something great.
It is hard to put into words and it is impossible to transmit the actual feeling and experience through an article; everything will grow.
Remember late 2024?
What was the experience like?
Let's recap:
The market bottomed in August 2024 and went sideways for three months.
Then, in a matter of weeks, everything started to grow. Not everything but still, enough for us to profit and enjoy. The growth phase lasted as little as 1 full month. The consolidation period lasted on average 3 months. This time it will be different.
Consolidation (waiting time and the opportunity to buy low) has less than 1 month left.
The growth phase will last between 3-6 months. With a strong shakeout in-between but this is 3 to 6 times more than late 2024. So this is great.
If you knew in advance what was going to happen in late 2024, you know you could have made great profits and did great.
You know now what is about to happen, so why not take action now and do the same.
Now you can profit big time. No need to hold after the end of the bullish wave.
When prices are low it is the time to buy.
When prices are high it is the time to sell.
There are no missed opportunities. There is no need to hold for too long.
Yes, you can hold and will hold but only a portion, you have to sell when prices are up.
This time I will get it right.
I am buying NOW.
I am going LONG now.
I will sell when everything is up.
But what if it keeps on growing?
Be grateful for the profits when they come.
If everything keeps on growing, buy the pairs that are lower and enjoy those.
You need some targets and you need to take action. You are trading to take money home.
First you put money in and then you take it out.
What you take out will be many times more than what you initially bought.
Long long-term.
Buy weekly, monthly for 3-5 years and that's it.
You can use your portfolio as a savings account and withdraw when you feel like it or have a need.
You can go even longer, 10 years with no action other than to invest.
Once you feel ready, buy your mansion and enjoy the rich life.
Cryptocurrency is here to stay.
Cryptocurrency was developed to change the world. From a few entities controlling the money supply of the world, to everybody having access to wealth, success and growth.
You can make your own money now.
The 2025 bull-market is about to start.
Bitcoin is going up!
PS. We will consider a minimum of ~180,000 as the next All-Time High, with 200,000 and 220,000 being possible and ok. Anything lower or predicted earlier is now nullified. The sideways period has been long and strong. Bitcoin is definitely going to blow up. From November 2024 until now we have almost 5 months. That's enough to more than double prices-up, but the consolidation is not yet over. We have some time left. The Altcoins will move first. In the sense that they can produce stronger swings when they breakout.
Thank you for reading.
Namaste.
If you enjoy the article and would like to see more, leave a comment.

Vet 3x-9x leverage 5% allocationHello traders,
Here is a free sample VIP trade we offer every Wednesday. Profit targets listed by the green horizontal line.
Enjoy

Short Position BTC/USDT#Singal
BTC/USDT
🔴 Short Position
🎲 Entry @ 85,800
✅ Target1@ 85,000
✅ Target2 @ 83,535
✅ Target3 @ 81.384
✅ Target4 @ 78,647
❌ Stop Loss @ 89,551
Leverage: 5X_15X
Margin: 10% of Wallet Balance
⚠️"Take Care of Risk Management for Your Account"

ETHUSDFrankly, it has a very bad chart... The purple support area, $1,500, is the last stronghold for the bulls, and if it doesn't hold, we've officially entered a bear market and are headed towards $800-$1,000.

BTC update 28.03.2025The zone of interest I have outlined, when internal liquidity is achieved. In the same zone we have horizontal volumes.
So I'm waiting for a reaction from this zone
We are still continuing to form the bottom of the correction.
The next 4 days will be a struggle to close the monthly candle, it should close green.
Bets Regards, EXCAVO

Bitcoin Breaks Resistance – Bullish Flag in Play(Short-term)!!!Bitcoin ( BINANCE:BTCUSDT ) started to rise and pump after '' the Mastercard Plans to Enable 3.5 Billion Cardholders to Transact with Bitcoin and Crypto, " and the US indexes movements and managed to break the Resistance zone($84,380_$83,580) .
Bitcoin is moving near the Monthly Pivot Point and Support lines .
Bitcoin seems to be completing the Bullish Flag Pattern .
I expect Bitcoin to reach the Targets I have outlined on the chart in the coming hours and most likely fill the CME Gap($86,620_$86,565) .
There is a possibility that Bitcoin will fall again after this increase. What do you think!?
Note: The Crypto market is full of excitement. Please pay more attention to capital management than before.
Note: This analysis could be a short-term Roadmap for Bitcoin .
Note: If Bitcoin falls below $83,500, we should expect further declines, possibly heavy declines.
Please respect each other's ideas and express them politely if you agree or disagree.
Bitcoin Analyze (BTCUSDT), 15-minute time frame.
Be sure to follow the updated ideas.
Do not forget to put a Stop loss for your positions (For every position you want to open).
Please follow your strategy and updates; this is just my Idea, and I will gladly see your ideas in this post.
Please do not forget the ✅' like '✅ button 🙏😊 & Share it with your friends; thanks, and Trade safe.

BTCUSD: We are nowhere near the top.Bitcoin has turned neutral again on its 1D technical outlook (RSI = 52.405, MACD = -937.300, ADX = 31.574) and should turn bullish once it crosses above its 1D MA50, which is now a 2 month Resistance. This simple illustration of cyclical tops and bottoms shows that the market is nowhere near a top and we will not consider selling until we enter October (2025).
## If you like our free content follow our profile to get more daily ideas. ##
## Comments and likes are greatly appreciated. ##

BTC ANALYSIS (4H)If we look at Bitcoin on hourly timeframes, we expect a rejection from the red zone. However, this rejection must be strong because if it is weak, Bitcoin may not be inclined to correct further or might at least enter a choppy corrective trend.
The substructure is also bearish, a trigger line has been lost, and ultimately, we have a bearish iCH on the chart.
Closing a 4-hour candle above the invalidation level will invalidate this analysis.
For risk management, please don't forget stop loss and capital management
When we reach the first target, save some profit and then change the stop to entry
Comment if you have any questions
Thank You

Bitcoin- Short term recovery?As you know, I am bearish on Bitcoin in the long term. However, in the short term, the cryptocurrency could see a recovery.
Yesterday, the price tested the 81,000 support zone once again and rebounded from that level. Now, Bitcoin is pushing against the 83,500 resistance, and I believe a breakout is likely.
If that happens, we could see further gains, with 86,500 as the next key target for the bulls.
In conclusion, I’m bullish on BTC in the coming days and will be looking to buy dips.

BTC New Update (4H)This analysis is an update to the analysis you can see below in the "Related Analyses" section.
The price did not reach the Supply zone from our previous analysis. Instead, it formed a reversal pivot upon hitting a Supply.
Given that the larger structure is also bearish, we can look for sell/short positions in the Supply zone.
A daily candle closing above the invalidation level will invalidate this analysis.
Do not enter the position without capital management and stop setting
Comment if you have any questions
thank you


Bitcoin - What's Next?We have seen a major 3 Wave (Minor Wave I, II, III) Bullish completion on Bitcoin. What do you think the next move is? For those who understand the BASICS of the Elliott Wave Theory, will easily know what is happening next. I have explained for free plenty of times in this channel, how many waves are in a full bullish or bearish cycle🔥

BTC Major Breakout - Symmetrical TriangleBTC is currently trading in a symmetrical triangle. This pattern is indecisive and has a 50/50 chance of breaking to the upside or downside. Meaning in the coming days or weeks, BTC will have a major breakout.
My guess would be to the downside but honestly, the direction wont be clear until it actually breaks out.

BTC/USD: More Fall Ahead? (READ THE CAPTION)By analyzing the Bitcoin chart on the weekly timeframe, we can see that the price is currently trading around $83,000. This week alone, BTC has dropped by 6%, showing signs of bearish momentum. A correction toward the $70,000 zone seems likely in the near future. Key supply zones are located at $93,400 and $99,700, while key demand zones are at $80,800 and $73,700. This analysis will be updated accordingly.
Please support me with your likes and comments to motivate me to share more analysis with you and share your opinion about the possible trend of this chart with me !
Best Regards , Arman Shaban

EUR/USD: Ready for another Fall? (READ THE CAPTION)By examining the EUR/USD chart on the 3-day timeframe, we can see that the price has moved exactly as expected since our last analysis. After reaching the supply zone between 1.083 and 1.093, the pair began a correction and is currently trading around 1.079. Keep in mind, only if the price stabilizes below the 1.080 level can we expect further downside from this pair.
Please support me with your likes and comments to motivate me to share more analysis with you and share your opinion about the possible trend of this chart with me !
Best Regards , Arman Shaban

Déjà Vu, BTC's Historical Pattern EncoreIt is possible the pattern that shaped in late 2020 and 2021 might repeat again.
Everything just looks like the previous main high which is selected with the red square in the left of chart.
There is no guarantee even if it happens - movement and ratios of movement can be different.
Déjà vu on the charts isn't by chance.

BITCOIN This is where the most aggressive part begins.Bitcoin (BTCUSD) has turned sideways amidst the tariffs implementation today and on the longer picture (1W time-frame) it remains supported just above the 1W MA50 (blue trend-line). On this chart we display our Parabolic Growth Channel (PGC), which is the long-term Zone where BTC is a buy opportunity.
Throughout the market's historic Cycles, the time when BTC was supported above the 1W MA50 but still within its PGC was known as an Accumulation Phase (blue ellipse) before the final parabolic rally of the Cycle and its eventual Top (green Arc).
Based on this model, so far we haven't seen any such rally, despite the undoubtedly strong rallies of October 2023 - March 2024 and October 2024 - December 2024. Only the March 2024 and then the recent Tops can be counted as marginal breaches above the PGC and it's been no surprise that the market corrected back inside the Buy Zone but remained supported by the 1W MA50.
As long as it does, the probabilities of that final, most aggressive Cycle rally get stronger. On the last Cycle the peak was priced just above the 1.618 Fibonacci extension. That is currently a little below $170k and that is why our final Target is just below at $160000. Also right now we are marginally below the 0.618 Cycle top-to-top Fib, which is in line to where all previous final Cycle parabolic rallies started.
So do you think the 1W MA50 will now push BTC to its final Cycle rally? Feel free to let us know in the comments section below!
-------------------------------------------------------------------------------
** Please LIKE 👍, FOLLOW ✅, SHARE 🙌 and COMMENT ✍ if you enjoy this idea! Also share your ideas and charts in the comments section below! This is best way to keep it relevant, support us, keep the content here free and allow the idea to reach as many people as possible. **
-------------------------------------------------------------------------------
💸💸💸💸💸💸
👇 👇 👇 👇 👇 👇

BITCOIN - Long Trade Update - Third-of-a-Third Wave Incoming...In this video, I share an update on the developments I've observed since yesterday as we prepare for a move higher in a third-of-a-third wave.
As price movements become smaller and sharper at lower degrees, identifying the correct count becomes more challenging.
That’s why I always consider bearish alternatives and play devil’s advocate. However, at the moment, I don’t see any conflicting signals, so it’s just a matter of waiting for the next upward thrust to begin from here.
