BITCOIN Will it finally break the 2 month Resistance?Bitcoin / BTCUSD is having an impressive 1day candle,recovering the losses of the last 3 days and with the 1day RSI bouncing on its Rising Support.
Now it faces the most important Resistance of all, the Falling trend line that started on the January 20th ATH.
This is just under the 1day MA50 and this will be the 5th test.
If successful, it will be an early validation that the trend has finally shifted to long term bullish again.
The first technical target will be the 2.0 Fibonacci extension. Aim a little bit lower at the top of February's Resistance Zone at $100000.
Follow us, like the idea and leave a comment below!!
Bitcoin (Cryptocurrency)
Is Bitcoin on the Verge of a Massive Breakout?Bitcoin's wave ((4)) has successfully completed a W-X-Y corrective formation. If Bitcoin manages to decisively break above the key resistance level of 88,826, it could trigger a powerful impulsive rally, potentially driving prices toward the next major targets at 95,250 - 99,508 - 109,176.
Additionally, the parallel channel's lower trendline is offering substantial support, preventing further downside movement. A strong breakout above this channel could significantly enhance bullish momentum, increasing the probability of Bitcoin reaching new all-time highs.
We will update you with further information.
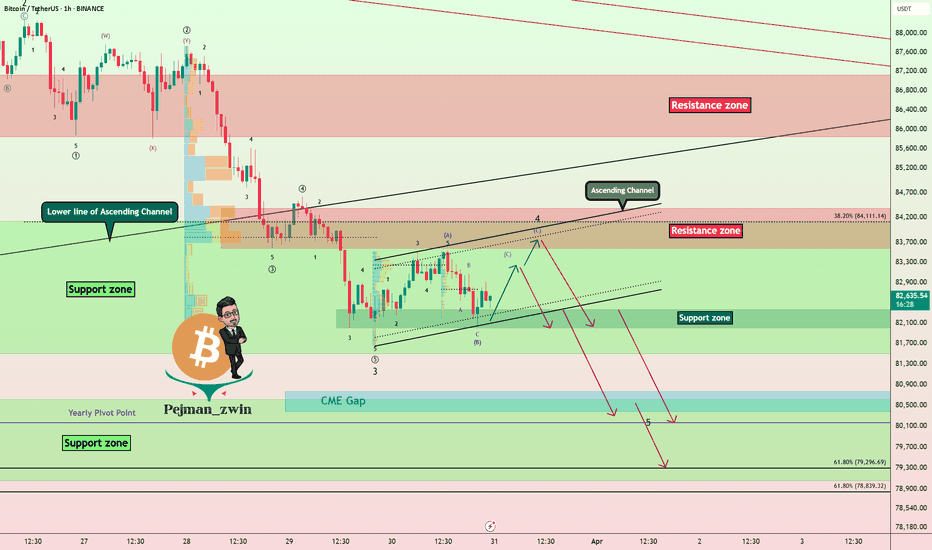
CME Gap Target: Is Bitcoin Headed for $80K!?Bitcoin ( BINANCE:BTCUSDT ) is moving in the important Support zone($84,120_$81,500) , and on the 1-hour time frame , Bitcoin is moving near the Support zone($82,360_$82,000) and the lower line of the ascending channel (small) .
Overall, Bitcoin has started another downtrend after breaking the lower line of the ascending channel (big) .
Since trading volume is generally low on Saturdays and Sundays , it is unlikely that the important Support zone($84,120_$81,500) will be broken before the financial markets open .
In terms of Elliott Wave theory , Bitcoin appears to have completed the main wave 3 at $81,644 and is currently completing microwave C of the main wave 4 . The main wave 4 will most likely have a Zigzag Correction(ABC/5-3-5) .
In general, the financial markets and US indices such as TVC:DJI , SP:SPX CME_MINI:NQ1! were not in a good state last week , and this trend will most likely continue next week . The tariffs that Donald Trump is imposing on countries around the world, as well as the turbulent situation in the Middle East , will all lead to the possibility of a fall in Bitcoin and other financial markets in the coming days.
I expect Bitcoin to make at least a temporary increase to $83,200 and then next target the Resistance zone($84,380_$83,580) and the upper line of the ascending channel before starting to fall and attack the important Support zone($84,120_$81,500) and also fill the CME Gap($80,760_$80,380) .
Note: If Bitcoin breaks above the Resistance zone($84,380_$83,580), we can expect more pumping.
Please respect each other's ideas and express them politely if you agree or disagree.
Bitcoin Analyze (BTCUSDT), 1-hour time frame.
Be sure to follow the updated ideas.
Do not forget to put a Stop loss for your positions (For every position you want to open).
Please follow your strategy and updates; this is just my Idea, and I will gladly see your ideas in this post.
Please do not forget the ✅' like '✅ button 🙏😊 & Share it with your friends; thanks, and Trade safe.
BITCOIN | 4H | KEY POINTS Hey traders, what's up
I've marked the key levels for Bitcoin on the chart. Right now, it's holding within the 4-hour supply and demand zone. But if this level breaks, I expect Bitcoin to drop all the way down to around $78K.
For spot buyers, there’s no real risk at the moment. But if you're trading on margin and currently in the red, be extra cautious.
The market will liquidate you first, then move on its way.
Big thanks to everyone supporting my analysis with likes
I will provide continuous updates under this analysis.
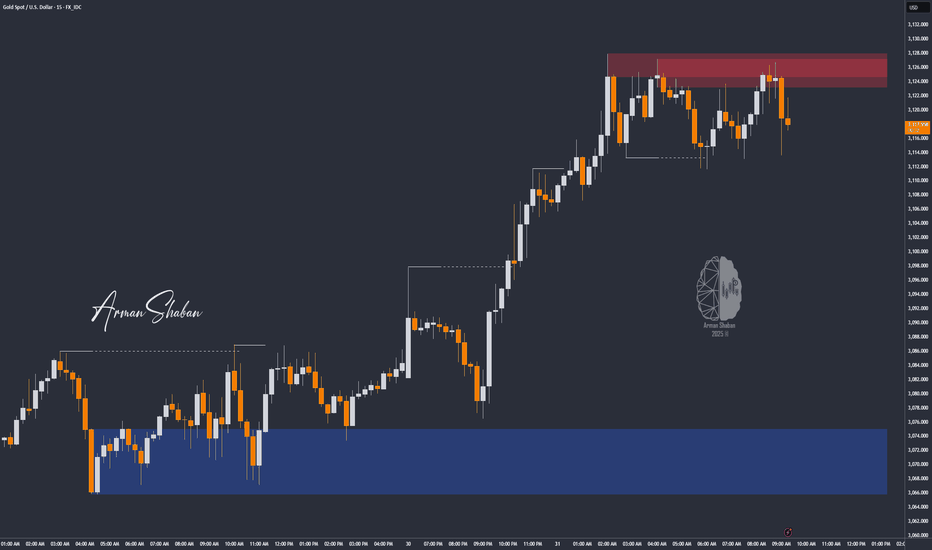
XAU/USD: Bull or Bear? (READ THE CAPTION)By analyzing the gold chart on the 15-minute timeframe, we can see that after the market opened today, a price gap appeared. Once gold filled this gap, it resumed its bullish move and recorded a new all-time high at $3,128. Currently, gold is trading around $3,119, and if the price stabilizes below $3,120, we may see a slight correction.
However, note that there’s been no new structural break on the higher timeframes, so for a more accurate outlook, we need to wait for the price to react to key levels.
This analysis will be updated with your continued support, as always!
Please support me with your likes and comments to motivate me to share more analysis with you and share your opinion about the possible trend of this chart with me !
Best Regards , Arman Shaban
TradeCityPro | Bitcoin Daily Analysis #50👋 Welcome to TradeCity Pro
Let's move on to the 50th analysis of Bitcoin and key crypto indices in this analysis as usual I want to review the New York futures session triggers for you
🫶 Before starting the analysis I want to thank you for all the support you have given us along the way so that we could reach the 50th analysis I hope that the number of these analyses increases much more and that we are always with you and that you also benefit from the analyses❤️
⏳ 1-hour timeframe
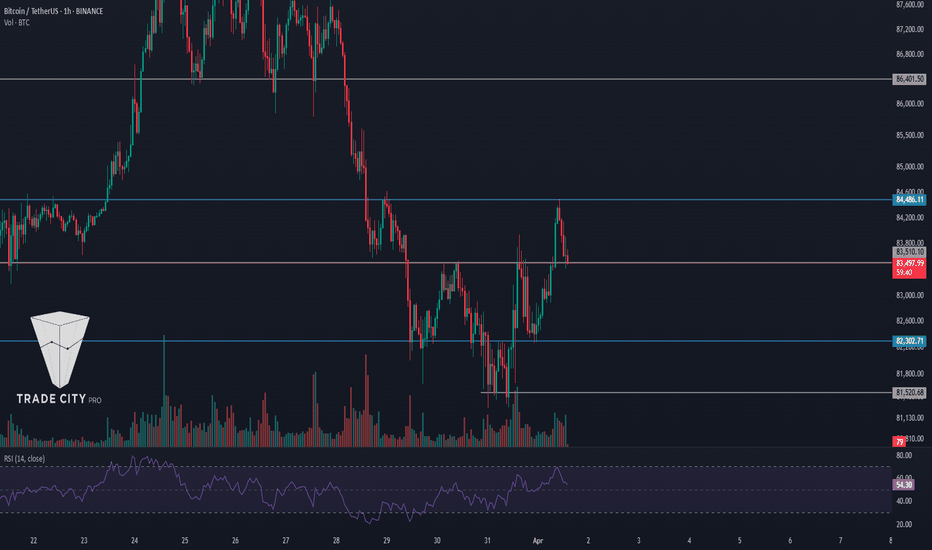
Yesterday Bitcoin rose from the 82302 zone and moved upward finally forming a base after the sharp and deep decline it had and even managed to go above the 83808 zone
⚡️ I slightly adjusted this zone and moved it to 83510 because the price reacted better to this zone
💫 Currently, we are witnessing a rejection from the 84486 zone which has pushed the price back towards 83510 if selling volume increases the price may drop further
✔️ If the price goes below the 83510 zone again in lower timeframes and with the activation of the fake breakout trigger we can open a short-term short position the main trigger is in the 82302 zone
🔼 For a long position breaking 84486 is suitable and with this breakout, the price can start the next bullish leg the entry of RSI into Overbuy will also be a momentum confirmation and can cause us to see large bullish candles
👑 BTC.D Analysis
Moving on to Bitcoin dominance today dominance faced a rejection from 62.35 which could cause dominance to decline
💥 The trigger for confirming this rejection and the downtrend is in the 62.06 zone and breaking this zone could move the price towards the 61.81 and 61.63 zones
📈 Stabilization of dominance above 62.35 will also confirm the uptrend again
📅 Total2 Analysis
Moving on to the Total2 analysis yesterday the 1.01 trigger was activated and the price has also pulled back to it but today we have a trigger for both long and short positions
🔽 For a short position breaking 990 and for a long position breaking 1.02 can confirm opening positions on altcoins
📅 USDT.D Analysis
Moving on to USDT dominance a Head and Shoulders pattern has formed where the neckline in the 5.41 zone has also been broken and the price is pulling back to it
📉 If the price is rejected from the 5.41 zone we will confirm the activation of this pattern and with the break of 5.33 we can confirm the downtrend of dominance
⭐ For an uptrend in dominance breaking 5.41 and invalidating the pattern can be a suitable trigger
❌ Disclaimer ❌
Trading futures is highly risky and dangerous. If you're not an expert, these triggers may not be suitable for you. You should first learn risk and capital management. You can also use the educational content from this channel.
Finally, these triggers reflect my personal opinions on price action, and the market may move completely against this analysis. So, do your own research before opening any position.
Cleaned the Market, Now Aiming for $2B – SHIRO Looks StrongWe’ve got our eyes on SHIRO, and let me tell you, the upside potential here is huge! 💥
After a healthy correction that cleared out all the weak hands, the path is open. Any fresh inflow of capital could send it flying. SHIRO could easily hit a $ 2B market cap in no time.
If staking comes in, Binance integration happens, and Shiba-related profiles start showing support again… it’s game on!
Remember, SHIRO NEKO is backed by the same creators and managers behind Shiba Inu. Just look where SHIBA is today — and SHIRO hasn’t even started its real rally yet.
That first $ 1B was just the beginning of a long journey. 🚀
#SHIRO #Altcoins #CryptoQueen #ShibaFamily #DeFi
Bitcoin short term.I follow 5 wave movements in most of my analysis because it gives a good idea about the direction of the movement.
* What i share here is not an investment advice. Please do your own research before investing in any digital asset.
* Never take my personal opinions as investment advice, you may lose all your money.
89542.51 or higher, the key is whether the price can be maintain
Hello, traders.
If you "Follow", you can always get new information quickly.
Please also click "Boost".
Have a good day today.
-------------------------------------
The April TradingView competition is sponsored by PEPPERSTONE.
Accordingly, we will look at the coins (tokens) and items that can be traded in the competition.
Today, we will talk about the BTCUSD chart for the first time.
-
(BTCUSD 1D chart)
If the price is maintained above the M-Signal indicator on the 1M chart, it can be interpreted that it is in an upward trend in the medium to long term.
Currently, it is showing a short-term uptrend as it rises above the M-Signal indicator on the 1D chart, but it is highly likely that it will continue to rise only if it rises above the M-Signal indicator on the 1W chart.
Therefore, the key is whether it can maintain the price by rising to around 89542.51.
-
We need to see if the OBV is maintained above the middle line and can break through the upper line.
Since the StochRSI indicator is currently in the overbought zone, if there is no increase in trading volume, it is likely to eventually show a downtrend.
If it shows a downtrend, it is expected that it will eventually meet the M-Signal indicator on the 1M chart and determine the trend again.
At this time, we need to check whether there is support near 73589.43.
-
The competition starts on April 1.
As I mentioned in the Binance BTCUSDT chart description, the next volatility period is expected to be around April 5 (April 4-6).
Therefore, we need to check whether the price is maintained above the M-Signal indicator on the 1D chart or above the M-Signal indicator on the 1W chart and decide the position.
In other words, I think it is good to decide the position depending on whether there is support near the original section marked on the 30m chart.
-
It is expected that the key point of this competition will be whether the trading volume can increase and whether the price can be maintained by rising above 89542.51.
-
Thank you for reading to the end.
I hope you have a successful trade.
--------------------------------------------------
- This is an explanation of the big picture.
I used TradingView's INDEX chart to check the entire section of BTC.
I rewrote the previous chart to update it by touching the Fibonacci ratio range of 1.902 (101875.70) ~ 2 (106275.10).
(Previous BTCUSD 12M chart)
Looking at the big picture, it seems to have been maintaining an upward trend following a pattern since 2015.
In other words, it is a pattern that maintains a 3-year upward trend and faces a 1-year downward trend.
Accordingly, the upward trend is expected to continue until 2025.
-
(Current BTCUSD 12M chart)
Based on the currently written Fibonacci ratio, it is displayed up to 3.618 (178910.15).
Fibonacci ratio 0.618 (44234.54) is not expected to fall again.
(BTCUSDT 12M chart)
Looking at the BTCUSDT chart, I think it is around 42283.58.
-
I will explain it again with the BTCUSD chart.
The Fibonacci ratio ranges marked in the light green boxes, 1.902 (101875.70) ~ 2 (106275.10) and 3 (151166.97) ~ 3.14 (157451.83), are expected to be important support and resistance ranges.
In other words, it seems likely to act as a volume profile range.
Therefore, in order to break through this section upward, I think the point to watch is whether it can rise with support near the Fibonacci ratios of 1.618 (89126.41) and 2.618 (134018.28).
Therefore, the maximum rising section in 2025 is expected to be the 3 (151166.97) ~ 3.14 (157451.83) section.
To do that, we need to look at whether it can rise with support near 2.618 (134018.28).
If it falls after the bull market in 2025, we don't know how far it will fall, but considering the previous decline, we expect it to fall by about -60% to -70%.
So, if the decline starts near the Fibonacci ratio 3.14 (157451.83), it seems likely that it will fall to around Fibonacci 0.618 (44234.54).
I will explain more details when the downtrend starts.
------------------------------------------------------
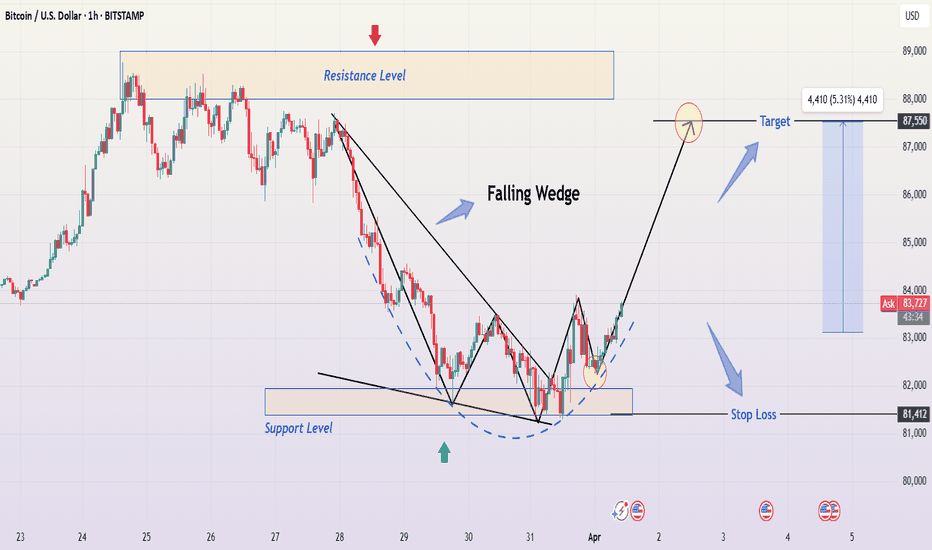
Bitcoin (BTC/USD) 1-Hour Chart Analysis – Professional BreakdownThis BTC/USD 1-hour chart showcases a falling wedge breakout, indicating a potential bullish reversal after a downtrend. The analysis suggests that Bitcoin could move toward its next resistance target of $87,550, offering a profitable long setup for traders. Let's analyze the chart in detail.
1️⃣ Market Context: Understanding the Trend
📉 Previous Downtrend
Before the wedge formation, Bitcoin was in a strong downtrend after reaching a resistance level near $87,000–$88,000.
Sellers took control, creating lower highs and lower lows, forming a descending wedge pattern.
The price declined sharply, reflecting profit-taking, increased supply, and weak demand.
📊 Current Market Setup
Bitcoin found strong support around $81,412, a level where buyers have stepped in multiple times.
The price action compressed into a falling wedge, a classic bullish reversal pattern, indicating that bearish momentum was weakening.
The breakout from the wedge suggests that bulls are regaining control, signaling a potential uptrend.
2️⃣ Key Technical Levels & Market Structure
🔹 Resistance Level ($87,000–$88,000)
This zone has acted as a strong supply area where Bitcoin previously struggled to break through.
If Bitcoin approaches this level again, a break and retest scenario would be ideal for further continuation.
🔹 Support Level ($81,412)
This area has provided multiple bounces, confirming it as a demand zone where buyers are actively defending.
A break below this support would invalidate the bullish setup and could lead to a downward move.
📍 Breakout Confirmation
The falling wedge breakout is confirmed by bullish price action and strong buying pressure.
Bitcoin is now forming higher lows, indicating a potential trend reversal.
3️⃣ Technical Chart Pattern: The Falling Wedge
📌 What is a Falling Wedge?
A falling wedge is a bullish pattern that forms when price consolidates between two converging downward-sloping trendlines before breaking out upward.
✅ Characteristics of a Falling Wedge in This Chart
Series of lower highs and lower lows, forming a contracting price range.
Decreasing bearish momentum, seen by smaller candles near the support zone.
Bullish breakout with strong momentum, signaling a reversal.
💡 Implication:
A breakout from a falling wedge often leads to a strong upward move, especially if volume supports the breakout.
4️⃣ Trading Setup & Strategy
📍 Entry Strategy
A confirmed breakout above the wedge with a strong bullish candle.
A pullback and retest of the breakout level can provide a high-probability entry point.
🎯 Target Levels
Primary Target: $87,550 (Projected based on wedge height).
Extended Target: Above $88,000 if momentum continues.
🛑 Stop-Loss Placement
Below the support zone at $81,412 to minimize risk.
If Bitcoin falls below this level, it invalidates the bullish setup.
5️⃣ Risk & Considerations
⚠️ Potential Risks to Watch
Fake Breakouts: If BTC fails to hold above the breakout level, it could result in a bull trap, causing a price reversal.
Market Volatility: Crypto markets are highly volatile, and external factors (such as macroeconomic news or regulatory updates) could impact price movements.
Resistance Pressure: The $87,000–$88,000 zone could act as a strong resistance, leading to possible consolidation before a decisive move.
✅ Risk Management Tips:
Keep a tight stop-loss below key support.
Adjust position size based on volatility.
Wait for confirmation before entering trades to avoid false breakouts.
6️⃣ Conclusion: Bullish Bias but Caution Advised
📈 Bitcoin is showing signs of a potential uptrend after breaking out from the falling wedge pattern. However, traders should watch for a confirmation of strength before entering long positions.
Key Points to Watch:
BTC needs to hold above $83,500 to sustain bullish momentum.
A strong candle close above $85,000 will further confirm bullish control.
The $87,550–$88,000 resistance zone will be a crucial test for the next move.
🚀 Bullish outlook remains valid unless BTC drops below $81,412.
Hashtags for TradingView Idea
#Bitcoin #BTCUSD #CryptoTrading #TechnicalAnalysis #FallingWedge #CryptoSignals #TradeSetup #TradingStrategy
Bearish Trend Meets Bullish Momentum: Is BTC Ready for a Rebound📉 Bitcoin is currently in a strong bearish trend on higher timeframes, but 📈 the 1-hour timeframe shows a break of structure and bullish momentum. This suggests a potential short-term pullback into the previous range, aligning with the 50% Fibonacci retracement level. 🔄 Additionally, there’s a bearish imbalance above that could be rebalanced. While this presents a possible buy opportunity, ⚠️ it’s a high-risk setup due to the overall bearish trend. Always trade with caution! 🚨
Disclaimer
⚠️ This is not financial advice. Trading involves significant risk, and you should only trade with funds you can afford to lose. Always do your own research and consult a professional if needed. 💡
Bitcoin will reach $180,000 this yearBitcoin’s trajectory is unstoppable—analysts are calling for a climb to $180,000, fueled by institutional adoption, limited supply, and global economic uncertainty. With halving cycles tightening the squeeze and mainstream acceptance soaring, BTC isn’t just a store of value—it’s the financial revolution we’ve been waiting for. Buckle up, the bull run’s coming.
DOGEUSDT | 1H | NOW IN SUPPORT ZONEHey traders
📉 Right now, Dogecoin is at a key support level. The 0.17514 zone is a critical support area, and we need to 👀 watch how it reacts from here.
📊 I believe this sharp drop happened due to the breakdown of the Head and Shoulders pattern.
⚠️ No need to panic—just wait for my analysis update!
⭐ Don’t forget to like 👍 so you don’t miss the next Dogecoin update! 🔔
Next Volatility Period: Around April 5 (April 4-6)
Hello, traders.
If you "Follow", you can always get new information quickly.
Please click "Boost" as well.
Have a nice day today.
-------------------------------------
(BTCUSDT 1M chart)
A new candle has been created as a new month begins.
The StochRSI indicator has fallen below the midpoint, and OBV has been hunting since around October 1, 2024.
As I mentioned before, the StochRSI indicator must fall to the oversold zone and then rise to create a peak in order to draw a trend line between the lows.
Therefore, the point to watch next month is whether the StochRSI indicator can enter the oversold zone.
The key is whether the price can be maintained above 73499.86.
-
(1D chart)
If the current StochRSI indicator creates a peak in the oversold zone, that is, if it closes up, the uptrend line (2) will be completed.
If that happens, we should see whether it can maintain the price by rising above the Fibonacci ratio 2.24 (83646.12) around April 5th.
If not, it is highly likely that it will eventually fall again.
In the explanation of the 1M chart, I said that the StochRSI indicator should enter the oversold zone.
You may think that the price should fall because of this, but you should not necessarily think that the price will fall because the StochRSI indicator may show a downward trend even if the price rises.
In such an ambiguous situation, rather than predicting whether it will rise or fall, you should check whether the current price position is supported or falling and think about whether to respond.
As I said earlier, you should respond depending on whether there is support near the M-Signal indicator on the 1D chart where the arrow is pointing.
This time, you should check in which direction it deviates from the Fibonacci ratio range of 2 (80999.68) ~ 2.24 (83646.12) and think about a response plan.
This movement is expected to appear after the next volatility period, April 4-6.
-
Thank you for reading to the end.
I wish you successful trading.
--------------------------------------------------
- This is an explanation of the big picture.
To check the entire range of BTC, I used TradingView's INDEX chart.
I rewrote the previous chart to update it by touching the Fibonacci ratio range of 1.902 (101875.70) ~ 2 (106275.10).
(Previous BTCUSD 12M chart)
Looking at the big picture, it seems to have been maintaining an upward trend following a pattern since 2015.
In other words, it is a pattern that maintains a 3-year upward trend and faces a 1-year downward trend.
Accordingly, the upward trend is expected to continue until 2025.
-
(Current BTCUSD 12M chart)
Based on the currently written Fibonacci ratio, it is displayed up to 3.618 (178910.15).
It is expected that it will not fall again below the Fibonacci ratio of 0.618 (44234.54).
(BTCUSDT 12M chart)
Based on the BTCUSDT chart, I think it is around 42283.58.
-
I will explain it again with the BTCUSD chart.
The Fibonacci ratio ranges marked in the green boxes, 1.902 (101875.70) ~ 2 (106275.10) and 3 (151166.97) ~ 3.14 (157451.83), are expected to be important support and resistance ranges.
In other words, it seems likely that they will act as volume profile ranges.
Therefore, in order to break through these ranges upward, I think the point of interest is whether they can be supported and rise near the Fibonacci ratios of 1.618 (89126.41) and 2.618 (134018.28).
Therefore, the maximum rising range in 2025 is expected to be the 3 (151166.97) ~ 3.14 (157451.83) range.
In order to do that, we need to see if it is supported and rises near 2.618 (134018.28).
If it falls after the bull market in 2025, we don't know how far it will fall, but based on the previous decline, we expect it to fall by about -60% to -70%.
Therefore, if it starts to fall near the Fibonacci ratio of 3.14 (157451.83), it seems likely that it will fall to around Fibonacci 0.618 (44234.54).
I will explain more details when the bear market starts.
------------------------------------------------------
BTC - 1H Clean Liquidity Hunt & Bearish Continuation BINANCE:BTCUSDT - 1H Update
Bitcoin remains in a bearish trend on the 4H and daily timeframes. After hunting the liquidity above the resistance zone, price began to drop exactly from our shared short entry at 83,700—and it's now on the move toward deeper targets.
🔹 Key Insights:
BTC grabbed liquidity just above resistance before reversing.
Price is now likely heading toward the liquidation zone below the support, aligning with the broader downtrend.
This setup offered a perfect short opportunity from $83,700, with clearly defined targets and risk.
🎯 Last Target: 80,200
💡 Congrats to all who followed our signal! The move is unfolding as expected.
📊 Stay locked in for the next big setups—follow for precise, real-time trade ideas! 🔔
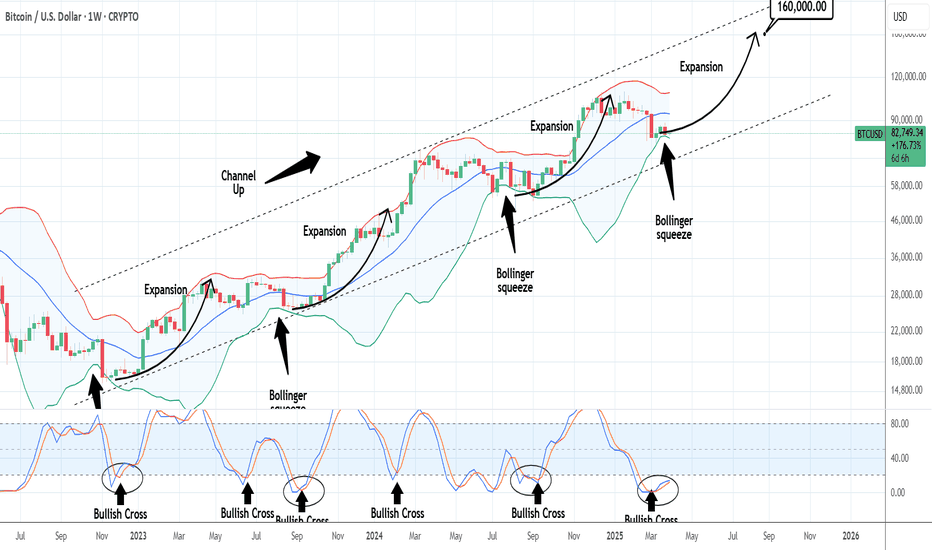
BTCUSD: Bollinger squeeze paving the way for $160k.Bitcoin remains marginally neutral on its 1W technical outlook (RSI = 46.017, MACD = 2013.300, ADX = 45.410) and started last week a Bollinger Bands squeeze process. This squeeze has been present inside the 2.5 year Channel Up every time after it bottomed. Only July-August 2024 made a slightly lower low because the squeeze process turned out to be longer. Even in the event, what follows all Bollinger squeezes is an expansion rally, especially after a 1W STOCH RSI Bullish Cross and the pattern shows that by this September, we can reach $160,000.
## If you like our free content follow our profile to get more daily ideas. ##
## Comments and likes are greatly appreciated. ##
Bitcoin Eyes $84,720 After Key Support ReboundFenzoFx—Bitcoin rebounded from the $81,160 support level and surged past $83,520, forming higher highs. If the price stays above this key support, the bullish momentum could continue.
The next upside targets are $84,720 and $86,340. However, if Bitcoin drops below $81,160, the trend may reverse, potentially falling to $77,850.
BTC Breakout or Breakdown: 83K to 87K or Bust to 73K?BTC’s standing at a fork in the road, and it’s itching to make a move! If it pushes past 83,121, we’re looking at a smooth jump to 84,600—like a quick win you can almost taste. Keep the good vibes going, and 87,000 might just be the big payoff. But hold up—if it stumbles below 81,300, things could get messy. The bears might crash the party, pulling us down to 80K, then 79,900. And if the slide keeps going? We’re talking 74,700, maybe even a rough landing between 73,600 and 73,000.
Kris/Mindbloome Exchange
Trade Smarter Live Better
BITCOIN - Long Trade Idea - We have Wave 3 Confirmation...We have had confirmation of Wave 3 In Progress.
I will be initially looking to target the .786 retracement back to the highs.
Check out the related videos down below for the full coverage of this trade.
Stay tuned for more updates.
Target $102,886
Stop: $81,274
BITCOIN - Long Trade Idea Update - We Could See One More Low...In this video, I discuss why Bitcoin may still make another low before the Wave 2 correction is fully complete.
Upon closer examination of Wave iv in the previous Wave 5 correction, it appears the level where Wave iv ended was slightly miscalculated.
Technically, Bitcoin should have dipped below the perceived low, but either its strength has prevented this, or the ongoing correction is nearing completion.
The key level to watch is $82,445—if Bitcoin breaks above this, we should continue higher.
However, it’s more likely that we first dip below $81,274 before experiencing a strong upward move.
Pay close attention when Bitcoin makes another low, as the reversal could be sharp, potentially piercing through $82,445, which would confirm the trend shift.
If we make a new low then I would suggest price would turn back up after tagging $81,071.


