SHORT BTC!?According to me market might retest its resistance level 92,000-93,000 then market will complete it's double top pattern, which will endup on retesting its Support level 68,000 after that market may show a NEW HIGH.
Bitcoin (Cryptocurrency)

What BTC is showing?! Full Scenario As of now market is really slow... Why?
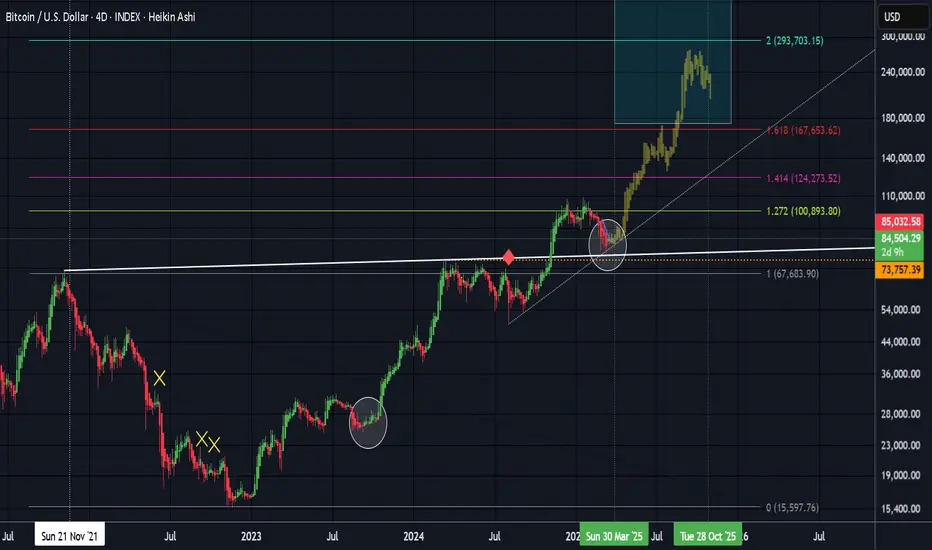
As the History of BTC shows that market never formed a new high with out retesting its Support or previous Resistance level, as in 2020 market break its Resistance level which was 19,000 and market formed a new high in 2021 which was 68,000 after that market didn't formed a new high until it retested its last support level 19,000. After retesting 19,000 market shows us a new high of 109,000 and since Market has formed a new high it didn't retested its Support level which is 68,000, so According to me history will be repeated here, till market don't retest its previous level which is 68,000 market will be slow and bearish. After that market will perform a new high.
According to RSI there is also a bearish divergences which support my vision.

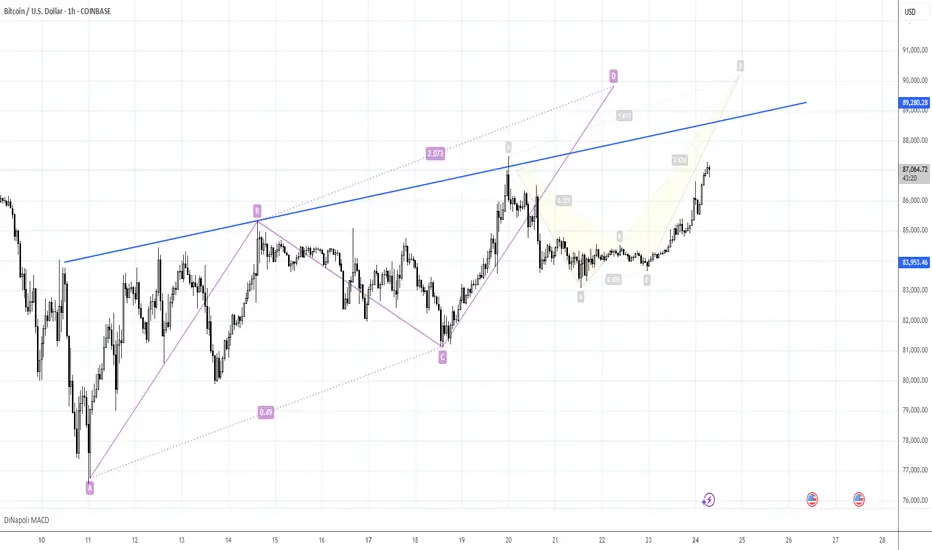
Watching for the same 90K area Part IIMorning folks,
Here is just minor update to our last idea. BTC mostly was flat in recent two sessions, so action is started only today.
So, the plan that we've prepared remains valid. Since an area around 90K is a strong resistance, we think that short entry attempt there is relatively safe, and at least should give us the chance to turn it to breakeven trade.
Now, on 1H chart we have two patterns that point on the same area.
Bitcoin (BTC/USD) Analysis – Daily Timeframe
Trend Overview
Bitcoin (BTC/USD) remains in an uptrend, with price holding above the ascending trendline support. The long-term bullish structure remains intact, characterized by a series of higher highs and higher lows since 2023.
Key Support and Resistance Levels
Primary Support:
$80,000 - $85,000 (Trendline support zone)
$75,000 (Psychological and historical support)
Primary Resistance:
$90,000 - $95,000 (Recent local highs)
$100,000 (Major psychological level)
Technical Indicators
Stochastic RSI is in the overbought zone, suggesting potential short-term consolidation or a pullback before resuming the trend.
MACD shows a bullish crossover, indicating positive momentum remains strong.
Volume analysis suggests buying pressure is still present but needs to increase to sustain further upside.
Market Outlook
Bitcoin continues to respect its long-term uptrend. As long as price remains above the trendline, the bullish outlook remains valid. However, a confirmed break below $80,000 could signal a deeper correction. If Bitcoin breaks above $90,000, the next major resistance is around $100,000.

Bitcoin resistancethe very important resistance area is about 92k at the moment, which needs to break for bull run confirmation.

Bitcoin at a Critical Juncture – Breakout or Breakdown? 📉 BTC is at a key decision point! After pulling back from recent highs, it's now consolidating within a range, sitting right in the middle of the previous price swing. I'm keeping a close eye on this zone—if price breaks out, a high-probability trade opportunity could emerge.
🎯 In this video, we dive deep into price action and market structure, breaking down a potential trade setup—if the market aligns with our strategy.
🚨 Trade smart, manage risk—this isn’t financial advice! 🚀🔥

BITCOIN gap below @ $84,435We have a gap on CME futures at about $84,435 and this is something to take note of. Depending on if/ and when retest this price level, it could be a place to go long. Not financial advice, DYOR.

Bitcoin: Bear Flag Break Can Retest 78K.Bitcoin is in the process of developing a bear flag formation and may push higher on smaller time frames but the short term bearish structure is still intact. This means there is a higher probability that price retests the 78 to 80K once more. IF such a scenario presents itself, it may provide an opportunity for a new swing trade long (upon confirmation). IF the 87,500 area minor resistance breaks instead, this would increase the chance that price retests the 90K area resistance.
How you play this is going to depend on the time frames you typically operate within. If you day trade, even though a bear flag is in progress, the structure itself is made up of higher lows which means the momentum is bullish. Longs can be justified if you are working on time frames such as 5 min or 1 min because the proportional risk is small. If you are working on larger time frames like 30 min or above, the bear flag play makes more sense since price is near the previous swing high (87,500 area). At the moment there is no confirmation on the larger time frame for the swing trade short but a candle or a break of the lower trend line can occur this week.
The other play is simply waiting for the retest of the 80 to 78K area. This is not only a swing trade long location, but is a dollar cost average area for investing as well. If the 76K is cleared, price can revisit the 73K to 70K area (all time high before the election).
Whether any of these scenarios play out depends on what kind of catalysts we get in the coming weeks (surprises or scheduled economic events). The chart helps to identify price points of interest where we can measure potential and assess risk from, they do not offer any meaningful way to forecast the future.
Thank you for considering my analysis and perspective.

Bitcoin at $85K: Breakout or Breakdown?Bitcoin is currently trading at $85,000, holding steady despite a 4.4% drop in the broader cryptocurrency market over the past 24 hours. This dip reflects a cautious mood across risk assets, driven by uncertainty over upcoming US inflation data and potential Federal Reserve interest rate decisions. While altcoins are taking a bigger hit, Bitcoin’s price action has been choppy but resilient. For now, it’s in a consolidation phase, with traders watching for the next big move.
Broader Market Context
The recent decline in the crypto market mirrors a broader “risk-off” sentiment among investors, who are bracing for economic shifts that could impact global markets. Factors like US inflation reports and Fed policy updates are creating short-term uncertainty. As the leading cryptocurrency, Bitcoin often serves as a market indicator, its ability to hold key levels could signal stability, while a breakdown might deepen the downturn. Despite this, Bitcoin’s long-term outlook remains strong, supported by growing institutional adoption and a more favorable regulatory landscape.
Short-Term (1-Hour Chart):
Support: $84,000 (make-or-break), $82,000
Resistance: $86,500, $90,000
Indicators: RSI at 45 (neutral), MACD showing bearish momentum. A descending triangle is in play, breaking $86,500 with strong volume could push to $90,000, but a fall below $84,000 might test $82,000.
Long-Term (Weekly Chart):
Support: $80,000, $75,000
Resistance: $90,000, $100,000
The 200-day moving average is trending up, reinforcing a bullish long-term view, but $80,000 must hold for that to stay intact.
Potential Scenarios
Bullish Case: If Bitcoin holds $84,000 and breaks $86,500 with solid volume, expect a run to $90,000 short-term, with $100,000 in sight long-term.
Bearish Case: A break below $84,000 could see it slide to $82,000 or even $80,000.
Volume is the key, watch for a spike to confirm either direction.
Broader Context and Tips
Long-term, Bitcoin’s fundamentals look solid with growing institutional interest and a crypto-friendly climate. But short-term, watch out for volatility triggers like US inflation data or Fed moves. For traders, focus on $84,000 support and $86,500 resistance, these levels will dictate the next trend. Set tight stops (e.g., just below $84,000 for longs) and keep an eye on news. Long-term holders should view $80,000 as the critical floor for the bullish trend to continue.

Bitcoin’s Next Move – Another Attack on Resistance zone?Bitcoin ( BINANCE:BTCUSDT ) fell to $83,400 as I expected in the previous analysis , the question is whether Bitcoin will continue to decline or not.
Please stay with me.
Bitcoin is moving in the Support zone($84,120_$81,500) and near the Support lines . The way Bitcoin has moved and decreased since yesterday until now has been such that it seems that Bitcoin can attack the Resistance zone($87,100_$85,800) at least once more.
In terms of Elliott Wave theory , given Bitcoin’s movements over the past few hours, it appears that Bitcoin is completing a microwave B of the main wave Y .
I expect Bitcoin to be able to attack the Resistance zone($87,100_$85,800) once again and if it breaks, I have marked the next targets on the chart .
Do you think Bitcoin can touch $90,000 again?
Note: If Bitcoin goes below $81,800, we can expect more dumps.
Please respect each other's ideas and express them politely if you agree or disagree.
Bitcoin Analyze (BTCUSDT), 2-hour time frame.
Be sure to follow the updated ideas.
Do not forget to put a Stop loss for your positions (For every position you want to open).
Please follow your strategy and updates; this is just my Idea, and I will gladly see your ideas in this post.
Please do not forget the ✅' like '✅ button 🙏😊 & Share it with your friends; thanks, and Trade safe.

BTC at a Critical Crossroad – Buckle U🤯 BTC at a Critical Crossroad – Buckle Up! 🚀
Ladies and gentlemen, welcome to "Bitcoin Wrestling Mania!" 🎤💥 BTC is currently stuck in a high-stakes battle with the legendary 200 EMA resistance 🥊🔥. We've conquered the 20 EMA, but let’s not pop the champagne just yet – the daily candle hasn’t closed! 🕰️ Expect surprises! 🎭
📊 Resistance Levels Ahead:
🔹 First Boss: 50 EMA Resistance 🏰
🔹 Final Boss: The 89,773.0 Fortress 🚧
Now, we're seeing some short-term bullish vibes 🟢, but wait – the market makers might have other plans 🕵️♂️💰. The smart money hasn't entered the ring yet, which means... well, expect plot twists! 😵
🔻 Possible Correction Zones:
💥 Support 1: 80,548.0
💥 Support 2: 76,123.0
So, will BTC power through the resistance like a champion 🏆, or are we about to witness a dramatic correction 🤕? Drop your thoughts below – let’s piece together the puzzle! 🧩👇
#BTC #Crypto #Trading #Bitcoin 🚀

SCRUSDT BullishSCRUSDT buy signal on daily Timeframe. 0.3 is the lowest price on this crypto, now bulls are ready to move higher. Potential TP is 28%

Projected path for Bitcoin based on fibsBitcoins projected path based on Fib expansion levels and previous price action (come back to this one)
BTC | 90K or 40KBTC is seemingly in the early days of a brand new bearish cycle.
This is somewhat surprising, since ETH did not make a new ATH - which has happened every single time in the past rallies.
The bounce zones I will be watching for the coming bearish cycle:

BTCUSD - Consolidation Likely to Resolve with Bullish BreakoutThe Bitcoin/USD 4-hour chart displays a consolidation pattern after recovering from the March lows near $77,000, with current price action hovering around $83,928. Following a recent test of resistance at $86,500, a minor pullback appears to be underway, but the higher probability move remains to the upside as indicated by the directional arrows on the chart. The price has been forming a series of higher lows since the March 11 bottom, suggesting accumulation and underlying bullish momentum. Key to this outlook is the strong support established by the blue reaction zone near $76,000-$78,000, which has successfully contained selling pressure. Traders should monitor for a potential shallow retracement before the anticipated push toward the orange resistance level at $87,650, which represents the next significant hurdle. A decisive break above this resistance would likely trigger an acceleration in buying momentum and confirm the bullish scenario, potentially opening the path toward retesting the $90,000-$92,000 region in the coming sessions.
Disclosure: I am part of Trade Nation's Influencer program and receive a monthly fee for using their TradingView charts in my analysis.

A Good Example of How Market Makers Manipulate BTC Price- As liquidation areas are visited, price drops back down, retraces back up just to fill the price imbalance before continuing to for a new low.
- The latest price action is similar to the previous, and there is a very good likelihood that the Bitcoin price will create another major new low
- Also take note of the fake out in the ascending channel to trap traders into placing long positions. The fake out was also able to trigger stop losses from short positions.
Let me know what you guys think and comment below.

TradeCityPro | Bitcoin Daily Analysis #42👋 Welcome to TradeCity Pro!
Let's delve into the analysis of Bitcoin and other key crypto indices. As usual, I will review the futures triggers for the New York session for you.
⏳ 1-Hour Timeframe
In the 1-hour timeframe, as you can see, the price still maintains a range box between 83808 and 84734, and the market volume has decreased even more from yesterday.
📊 The less the volume, the closer we are to a price movement, so again, keep an eye on the market to ensure you don't miss any active triggers.
⚡️ For a short position, you can enter with a break of 83808, and for a long position, with a break of 84734.
👑 BTC.D Analysis
Let's move to the analysis of Bitcoin dominance. Yesterday, the support at 61.43 was broken, and it's moving towards 61.08.
✔️ Currently, I don’t have any specific triggers for confirmation in dominance, but as long as the dominance stays below 61.43, I see it continuing its downward trend.
📅 Total2 Analysis
On to the analysis of Total2, the trigger at 1.05 is about to be activated, and the price could move towards 1.07 with a break of this area.
🔽 The short trigger remains at 1.04 for now.
📅 USDT.D Analysis
Finally, looking at the Tether dominance, this index is still ranging between 5.25 and 5.34.
💫 A break of either of these areas could determine the next leg of the price movement.
❌ Disclaimer ❌
Trading futures is highly risky and dangerous. If you're not an expert, these triggers may not be suitable for you. You should first learn risk and capital management. You can also use the educational content from this channel.
Finally, these triggers reflect my personal opinions on price action, and the market may move completely against this analysis. So, do your own research before opening any position.

BTCUSDT RISING WEDGE PATTERN IN 2-H AT Hello Guys Here Is Chart Of BTCUSDT in 2-H AT
Entry Level: SELL Around 86500
Resistance: The upper trendline of the wedge 87300
Target Will Be : 83100
Would you like me to check potential invalidation levels where the pattern might fail?

Eth to $2,500?Hello friends! Well, I'm sharing my opinion. Eth is feeling boring. There isn't much volatility, however, the rebound is clear. It's clear that it will be testing the $2,250 area. However, there are two scenarios:
A) A brief approach with a very sharp rejection.
B) A strong upward breakout to use the $2,250 area as support and reach the famed $2,500, which is a highly liquid area.
In conclusion, the price will seek the $2,250 area early in the week, and buying pressure will determine the final direction.
Disclaimer: This is only an opinion; it should not be used as investment advice or recommendation.

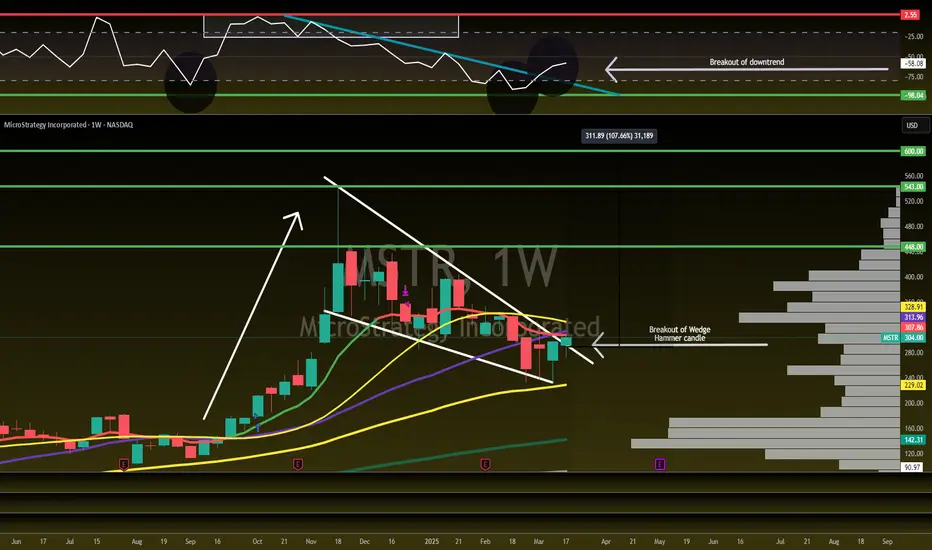
$MSTR - WE HAVE IGNITION! 107% UpsideNASDAQ:MSTR - WE HAVE IGNITION 🚀
🎯$448🎯$543🎯$600
✅Falling Wedge Breaking Out
✅Wr% Breaking Out of DownTrend
✅Weekly Hammer Candle
Not Financial Advice
SHIBUSDT ShortSHIB consolidation on H4 chart. Now price at the resistance level and starts downtrend to retest support level.

US30 - Catch The Next Wave!US30 is currently in an uptrend, with price action respecting a well-defined ascending channel. We anticipate another bounce from channel support.
In Wave 2, price was rejected at the 38.2% Fibonacci retracement level, and we expect a similar reaction for Wave 4.
Our strategy is to wait for price to enter the buy zone, between the 38.2% and 50% Fibonacci retracement levels, and look for bullish reversal signals before entering a position.
Potential Bullish Reversal Signals:
Trendline break
Break of structure (BOS)
Other confirmation patterns
Trade Plan:
- Monitor price movement into the buy zone, aligning with channel support.
- Enter long positions upon confirmation of bullish price action, placing stop-loss below the established low formed after bullish confirmation.
Target levels: 45,000 and 48,500, with the remainder held for a potential extended swing trade.
Goodluck and as always, trade safe!

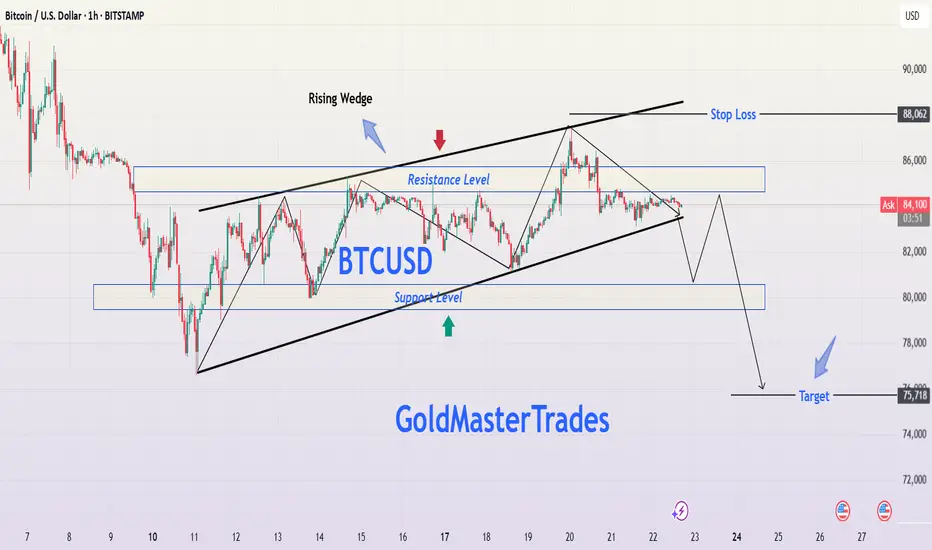
BTCUSD Bitcoin Rising Wedge Breakdown – Professional AnalysisBitcoin's price action is forming a Rising Wedge pattern on the 1-hour chart, a well-known bearish reversal formation. This pattern suggests that although the price has been making higher highs and higher lows, the upward momentum is weakening. Historically, when a rising wedge breaks to the downside, it often leads to strong downward movement, making it an ideal shorting opportunity.
This analysis will cover the pattern formation, key support and resistance levels, price action expectations, trading strategy, and risk management to ensure a well-informed trade setup.
1. Chart Pattern Breakdown: Understanding the Rising Wedge
Formation of the Rising Wedge
The price has been moving within two converging trendlines (black lines), forming a wedge shape.
The slope of both the upper and lower trendlines is positive, indicating an uptrend, but the lower trendline is steeper, suggesting weakening bullish pressure.
As Bitcoin moves higher, buying volume is declining, indicating that buyers are losing control.
The price has tested the upper resistance trendline multiple times, failing to break above it, further confirming bearish exhaustion.
The lower trendline has acted as strong support, but multiple touches suggest a possible breakdown soon.
Why This Pattern is Bearish
The rising wedge is inherently bearish because it signals that although the price is rising, the upward movement is slowing down. Eventually, the price is likely to break below the lower support trendline, triggering a sharp sell-off.
A breakdown from this wedge structure would confirm the start of a downtrend, making it an excellent opportunity for short traders.
2. Key Technical Levels to Watch
Resistance Level (~$86,000 - $86,500) - Strong Sell Zone
Bitcoin has repeatedly failed to break above this zone, indicating heavy selling pressure.
If the price unexpectedly moves above this level, the bearish setup would be invalidated.
Support Level (~$80,000 - $80,500) - Breakdown Zone
This support level has held strong multiple times.
If BTC loses this zone, it will likely trigger a massive drop due to stop-loss orders being hit and panic selling.
Stop Loss ($88,062) - Risk Management
A stop loss above $88,062 ensures protection against unexpected bullish breakouts.
This level is placed just above recent highs to minimize the risk of premature stop-outs.
Target Level ($75,718) - Profit Objective
The projected price target is based on measuring the height of the wedge and applying it to the breakout point.
This level also aligns with a major historical support zone, where buyers might step in.
3. Trading Setup & Strategy
Bearish Trading Plan - Short Setup
📌 Entry:
Enter short after Bitcoin breaks below the wedge’s lower support and confirms the breakdown by retesting support as new resistance.
Ideal entry price is around $81,500 - $82,000 after confirmation.
📌 Stop Loss:
Place above $88,062, which is beyond the wedge’s upper resistance.
This protects against unexpected bullish breakouts.
📌 Take Profit:
First target: $78,000 (psychological support).
Final target: $75,718 (technical breakdown target).
Confirmation Signals for a Strong Short Trade
✔ Candle Close Below Support – A 1-hour candle closing below the wedge confirms a breakdown.
✔ Increase in Selling Volume – Rising bearish volume supports downward momentum.
✔ Retest of Broken Support as Resistance – If the price retests the wedge’s lower trendline and fails to reclaim it, it confirms further downside.
4. Risk Management & Considerations
Risk-to-Reward Ratio: The trade offers a 3:1 risk-reward ratio, making it highly favorable.
Market Conditions: External news events, institutional activity, or macroeconomic trends (like inflation reports) could impact price action.
Bear Trap Possibility: If Bitcoin breaks below but quickly reclaims support, it could be a fakeout, so wait for confirmation before entering.
5. Alternative Scenario – When to Invalidate the Bearish Outlook?
Although the primary expectation is a bearish breakdown, we must consider alternate scenarios:
🚨 Bullish Invalidation: What if Bitcoin Rallies?
If Bitcoin breaks above the resistance zone at $86,500 - $88,000, the rising wedge breakdown would be invalidated. In that case:
✅ A breakout above $88,062 could trigger a short squeeze, pushing BTC toward $90,000+.
✅ Bulls will regain control, shifting the trend to bullish continuation instead of reversal.
🔹 In such a case, traders should exit short positions and re-evaluate market conditions before re-entering trades.
6. Conclusion – Trading Plan Summary
📊 Current Bias: Bearish 📉
🔹 Pattern: Rising Wedge (Breakdown Expected)
🔹 Entry: Short after wedge breakdown & confirmation
🔹 Stop Loss: Above $88,062
🔹 Target: $75,718
Bitcoin is forming a classic Rising Wedge, which historically leads to strong downward movement once it breaks support. If BTC follows the expected scenario, a high-probability short trade is in play, targeting a decline toward $75,718. However, traders must wait for confirmation and manage risk effectively to avoid fakeouts.
📢 Stay updated, follow price action closely, and trade responsibly! 🚀