Bitcoin Testing 95k as Resistance TRENDLINE #Bitcoin at a CRITICAL juncture! Testing the downward trendline (double yellow) at 95K as resistance, originating from 107K in Dec.
This trendline has repeatedly rejected BTC, with multiple tests at 95K this week. Historically, rejections have led to drops to 82K support (tested 4x) or even the uptrend line at 77K (Mar/early Apr).
If BTC fails to break & hold above 95K by week's close, we may retest 82K on the 2023 uptrend (red line). BUT, if we break 95K and hold, we could target 109K, with a potential range of 125K-140K for new highs!
#Crypto #BTC #TechnicalAnalysis
Bitcoin (Cryptocurrency)

Bitcoin Testing 95k as resistance TRENDLINE #Bitcoin at a CRITICAL juncture! Testing the downward trendline (double yellow) at 95K as resistance, originating from 107K in Dec.
This trendline has repeatedly rejected BTC, with multiple tests at 95K this week. Historically, rejections have led to drops to 82K support (tested 4x) or even the uptrend line at 77K (Mar/early Apr).
If BTC fails to break & hold above 95K by week's close, we may retest 82K on the 2023 uptrend (red line). BUT, if we break 95K and hold, we could target 109K, with a potential range of 125K-140K for new highs!
#Crypto #BTC #TechnicalAnalysis

ZEC ANALYSIS🔮 #ZEC Analysis
🌟🚀 As we said earlier #ZEC moved around 20%. Right now #ZEC is trading in an Ascending Triangle Pattern and here we can see that #ZEC moving again towards its neckline. We see see more bullish move in upcoming days
🔖 Current Price: $36
⏳ Target Price: $46
⁉️ What to do?
- We have marked crucial levels in the chart . We can trade according to the chart and make some profits. 🚀
#ZEC #Cryptocurrency #Breakout #DYOR

TradeCityPro | Bitcoin Daily Analysis #77👋 Welcome to TradeCity Pro!
Let’s dive into the analysis of Bitcoin and key crypto indexes. As usual, I’ll walk you through the triggers for the New York futures session.
⏳ 1-Hour Timeframe
As you can see in the 1-hour timeframe, Bitcoin is still ranging, and volume has decreased compared to yesterday. In times like these when market volume is low, you need to pay closer attention.
✔️ Today, I’ve drawn an ascending trendline on the chart. When price performs very shallow corrections after an uptrend and each low is higher than the previous one, it indicates a very strong bullish trend. So if this trend continues, it can lead to some very attractive trade setups.
💥 As mentioned, volume is quite low today, and volatility is also lower than before. This means that most market participants are waiting to see what will happen before reacting. We should take the same approach and wait for our triggers to be activated.
📈 For a long position, it’s pretty clear that Bitcoin has a very important resistance at the 95370 level, which is currently the only long trigger. If you don’t have a position from lower levels, this is a very logical and attractive entry, and I suggest having a position ready if this level breaks.
📊 For a bearish scenario, we haven’t yet received confirmation, and we need to wait until at least the trendline is broken. After that, with the activation of a trendline trigger like the 93626 level, we can enter a short position.
👀 As I’ve said in previous analyses, I personally won’t open a short position unless Bitcoin reaches the 91945 level, as that’s my first confirmation for a trend reversal.
👑 BTC.D Analysis
Let’s check Bitcoin Dominance. The dominance range box continues, and yesterday it again moved upward from the 64.22 support and reached the range top at 64.60.
☘️ If you had opened a position on altcoins like ETH after their triggers activated yesterday, you probably hit stop-loss because of this dominance move. As dominance moved up after those triggers, capital flowed out of altcoins, causing many of them to fake out and fall back below their resistance.
📅 Total2 Analysis
Now for Total2. Just like Bitcoin, Total2 is forming a range box, but it has significantly less bullish momentum. While Bitcoin has some upward slope during its range, Total2 is completely flat and oscillating between 1.03 and 1.05.
⚡️ Triggers for Total2 remain unchanged: breakout of 1.05 for bullish confirmation and 1.03 for bearish. But just like I mentioned that I won’t act on Bitcoin’s 93626 break and will wait for 91945, here I also won’t act on a 1.03 break—I’ll wait for confirmation below 1.00.
📅 USDT.D Analysis
Let’s move to Tether Dominance. A new lower high has formed just below 5.14, and for now, I’ve adjusted the resistance level to 5.10, because as you can see, the price is reacting well to this area and we can use it as a trigger.
🧩 For a bearish USDT.D scenario (which would mean bullish for the market), breaking below 4.99 remains the key trigger. For a bullish USDT.D scenario, breaking above 5.10 would be the first confirmation of a shift in dominance upward.
❌ Disclaimer ❌
Trading futures is highly risky and dangerous. If you're not an expert, these triggers may not be suitable for you. You should first learn risk and capital management. You can also use the educational content from this channel.
Finally, these triggers reflect my personal opinions on price action, and the market may move completely against this analysis. So, do your own research before opening any position.

BITCOIN Analysis: Potential Pullback and ContinuationCOINBASE:BTCUSD is currently trading within an ascending channel, reflecting a clear bullish structure. The price may pull back toward the lower boundary of the channel before potentially continuing higher. This dynamic support offers a confluence area for a possible bullish reaction. A successful retest here could open the path for a move toward the $102,000 level, which aligns with the upper boundary of the channel and represents a logical bullish target.
However, a failure to hold this dynamic support could indicate weakening bullish momentum and may shift the short-term bias to neutral or bearish.
Traders should watch for confirmation signals such as bullish engulfing patterns, strong rejection wicks at the lower trendline, or increasing volume on the bounce before considering long positions.
Let me know your thoughts or if you see it differently! 🚀

BITCOIN This is where the real BULL started in 2017.We've mentioned on numerous occasions how Bitcoin's (BTCUSD) current Cycle resembles that of 2014 - 2017 and this evidence is self-explanatory on the chart. What we want to bring forward today, and the timing couldn't be better, is that symmetrically speaking, it was the exact same time of the year (April 2017) when the past Cycle started printing predominantly green candles that lasted until the very end of 2017 (December) and the Cycle Top.
The 3W RSI sequences are identical among the two fractals with a Pivot trend-line dominating both Cycles, first as a Resistance (red arrows) and then turned into Support (green arrows). Before the end-of-year Parabolic Rally, the Bull Cycle was classified into 3 pull-back/ consolidation Phases (blue Rectangles) and, no surprise, the mini rallies started around the same times.
Can this indicate that we are about to see a strong rally of predominantly green candles towards the end of the year to form the new Cycle High? What do you think?
Feel free to let us know in the comments section below!
-------------------------------------------------------------------------------
** Please LIKE 👍, FOLLOW ✅, SHARE 🙌 and COMMENT ✍ if you enjoy this idea! Also share your ideas and charts in the comments section below! This is best way to keep it relevant, support us, keep the content here free and allow the idea to reach as many people as possible. **
-------------------------------------------------------------------------------
💸💸💸💸💸💸
👇 👇 👇 👇 👇 👇

btc . month . outlookLONG worked out nicely, BUT there was no SFP liguidity grab at cw/cmHigh
- finished LONG trade with 10pm (+2h tz)
- price dropped below entry . out of LONG . looking for lower new entry
As we're just before a new monthly open, possibility for retrace during Month May enhances
- This would give a nice new SWING LONG entry
- As well as a nice SHORT entry to ride the rotation downwards
Tuesday gave up a couple of SUPPORT levels . got me to shift SHORT for wednesday
- scaling SHORT at fib + cw0.75
Invalidation:
Running stops at 92.750 and recovering above cw0.5

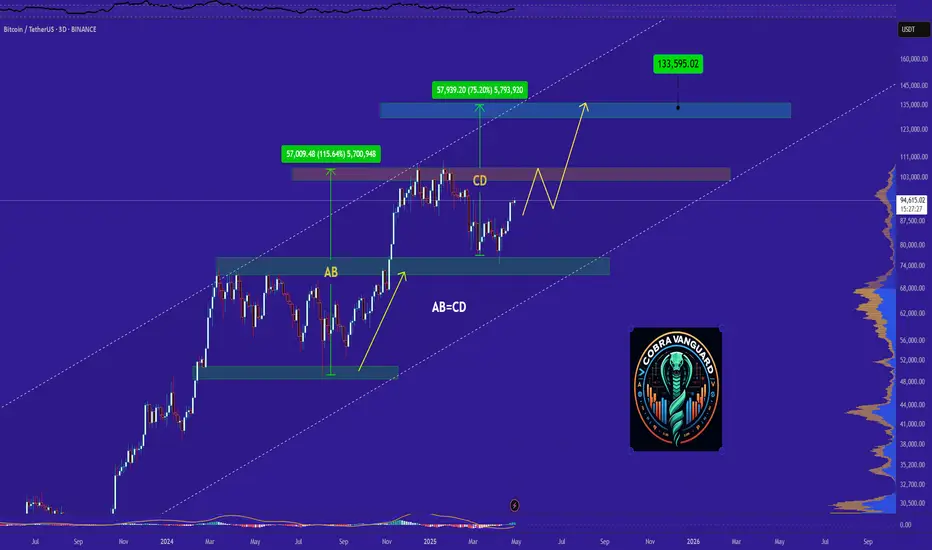
bitcoin road map !!!Chart is speaking itself...
Give me some energy !!
✨We spend hours finding potential opportunities and writing useful ideas, we would be happy if you support us.
Best regards CobraVanguard.💚
_ _ _ _ __ _ _ _ _ _ _ _ _ _ _ _ _ _ _ _ _ _ _ _ _ _ _ _ _ _ _ _
✅Thank you, and for more ideas, hit ❤️Like❤️ and 🌟Follow🌟!
⚠️Things can change...
The markets are always changing and even with all these signals, the market changes tend to be strong and fast!!

EURGBP DETAILED ANALYSIS TECHNICAL AND FUNDAMENTALSEURGBP is currently trading around 0.85, having completed a successful breakout and retest of the previous resistance-turned-support level. The price action aligns with a classic bullish continuation pattern, suggesting that the pair is poised for another upward move. My target for this bullish wave is 0.88, which corresponds to the next significant resistance zone.
Technical indicators support this outlook. The formation of a falling wedge pattern on the 4-hour chart has been confirmed, with the breakout leading to a sustained upward trajectory. The retest of the breakout level has held firm, indicating strong buyer interest and the potential for continued bullish momentum.
From a fundamental perspective, the euro is gaining strength due to improved economic indicators in the Eurozone, while the British pound faces headwinds amid ongoing fiscal policy uncertainties in the UK. This divergence in economic outlooks is contributing to the euro's relative strength against the pound, further supporting the bullish case for EURGBP.
In summary, the combination of technical patterns and fundamental factors suggests that EURGBP is well-positioned for a move toward 0.88. Traders should monitor key support levels to manage risk and look for confirmation of continued bullish momentum as the pair approaches the target zone.

Do you think I'm joking ???I might be wrong and this might never happen, but it might come true From a technical perspective!!!
Give me some energy !!
✨We spend hours finding potential opportunities and writing useful ideas, we would be happy if you support us.
Best regards CobraVanguard.💚
_ _ _ _ __ _ _ _ _ _ _ _ _ _ _ _ _ _ _ _ _ _ _ _ _ _ _ _ _ _ _ _
✅Thank you, and for more ideas, hit ❤️Like❤️ and 🌟Follow🌟!
⚠️Things can change...
The markets are always changing and even with all these signals, the market changes tend to be strong and fast!!
Bitcoin H4 | Falling toward a swing-low supportBitcoin (BTC/USD) is falling towards a swing-low support and could potentially bounce off this level to climb higher.
Buy entry is at 91,933.60 which is a swing-low support.
Stop loss is at 87,400.00 which is a level that lies underneath a pullback support and the 38.2% Fibonacci retracement.
Take profit is at 99,342.60 which is a swing-high resistance.
High Risk Investment Warning
Trading Forex/CFDs on margin carries a high level of risk and may not be suitable for all investors. Leverage can work against you.
Stratos Markets Limited (tradu.com):
CFDs are complex instruments and come with a high risk of losing money rapidly due to leverage. 63% of retail investor accounts lose money when trading CFDs with this provider. You should consider whether you understand how CFDs work and whether you can afford to take the high risk of losing your money.
Stratos Europe Ltd (tradu.com):
CFDs are complex instruments and come with a high risk of losing money rapidly due to leverage. 63% of retail investor accounts lose money when trading CFDs with this provider. You should consider whether you understand how CFDs work and whether you can afford to take the high risk of losing your money.
Stratos Global LLC (tradu.com):
Losses can exceed deposits.
Please be advised that the information presented on TradingView is provided to Tradu (‘Company’, ‘we’) by a third-party provider (‘TFA Global Pte Ltd’). Please be reminded that you are solely responsible for the trading decisions on your account. There is a very high degree of risk involved in trading. Any information and/or content is intended entirely for research, educational and informational purposes only and does not constitute investment or consultation advice or investment strategy. The information is not tailored to the investment needs of any specific person and therefore does not involve a consideration of any of the investment objectives, financial situation or needs of any viewer that may receive it. Kindly also note that past performance is not a reliable indicator of future results. Actual results may differ materially from those anticipated in forward-looking or past performance statements. We assume no liability as to the accuracy or completeness of any of the information and/or content provided herein and the Company cannot be held responsible for any omission, mistake nor for any loss or damage including without limitation to any loss of profit which may arise from reliance on any information supplied by TFA Global Pte Ltd.
The speaker(s) is neither an employee, agent nor representative of Tradu and is therefore acting independently. The opinions given are their own, constitute general market commentary, and do not constitute the opinion or advice of Tradu or any form of personal or investment advice. Tradu neither endorses nor guarantees offerings of third-party speakers, nor is Tradu responsible for the content, veracity or opinions of third-party speakers, presenters or participants.

It is yours to take...Back in 2024 after the early August low Bitcoin produced three weeks green. There was first a small bounce, a higher low followed by three weeks candles closing green. Today is the same. After these three weeks one last red week and then the start of major advance. Bitcoin grew from a low of $52,500 to a high of $110,000.
The rise started with the three white soldiers signal again today is the same, what will you do?
It was a rise of more than 100% and yet still not the bull market year based on the halving and past history.
Bitcoin launched 2009 four years later the first major bull market and All-Time High, we all know the story in 2013. MtGox and the rest. It continues and exactly four years later we get a new All-Time High, major growth and Bitcoin goes mainstream, everybody knows about Bitcoin now and it is 2017. It doesn't stop, it continues.
Then the market crashes the end is near and people start to quit, none of those are like me who continue to post, to publish, to fight, to persist and to win. In 2021 the story is not new already old, Bitcoin hits a new All-Time High, exactly four years later and four years after 2021 is 2025... We are already in late April and no bullish action this year, are we late?
If the August low marks the start of the current advance a new All-Time High can happen in August 2025 but no, too soon, right now there are too many Altcoins.
In November 2024 Bitcoin broke above $80,000 for the first time in its history and this is the biggest development in years from a bullish perspective. So we can take November as the starting date. If we calculate one year then the next All-Time High can happen in November 2025 are we late?
Any buy below $100,000 is still a bargain we are not late at all. The next All-Time High can happen in August, in November, in December 2025 or even in Mach 2026 that doesn't matter at all, really. What truly matters right now is to buy and hold and go LONG do you agree?
That's it. This is the opportunity that your life will change.
It is right in front of you right now, it is yours to take.
Buy Bitcoin and hold.
You will be happy with the results.
Namaste.

Is Bitcoin Overextended? Here's My Trade Plan If BTC Retraces!Bitcoin Daily Chart Analysis 📝
🚀 Current Market Structure:
The daily BTC/USDT chart clearly shows a strong bullish trend, with price action recently making a significant upward move. The current candles are consolidating near the highs, suggesting a potential overextension after a parabolic rally. This often precedes a corrective phase, as buyers may take profits and new participants wait for a more favorable entry.
🔍 Wyckoff Perspective:
Your approach aligns with the Wyckoff Method, specifically looking for a retracement to the 50% level of the current swing. This would place the ideal entry zone around the $93,071 area, as marked on your chart. According to Wyckoff, after such a retrace, we should watch for an accumulation range—a period of sideways movement where smart money absorbs supply. The key signal to watch for is a "spring" (a false breakdown below the range), followed by a strong bullish breakout, confirming demand dominance.
🌐 Fundamental Backdrop:
Fundamentally, Bitcoin remains supported by several macro factors:
Institutional adoption continues, with ETFs and large funds increasing exposure.
The recent halving event has reduced new supply, historically a bullish catalyst.
Regulatory clarity in major markets (e.g., US, EU) is improving, reducing uncertainty. However, risks remain from potential regulatory crackdowns, macroeconomic headwinds (such as interest rate hikes), and geopolitical tensions.
💬 Sentiment & Analyst Consensus:
Market sentiment is currently optimistic, with the Crypto Fear & Greed Index hovering in the "Greed" zone. Many analysts are calling for a healthy correction before the next leg up, echoing your expectation of a retrace. Some prominent voices suggest that a pullback to the $92,000–$94,000 range would be constructive, allowing for reaccumulation and a more sustainable rally.
📈 Technical Triggers to Watch:
Retrace to 50% Level: Monitor for price action around $93,071–$94,593.
Accumulation Range: Look for a period of low volatility and tight range after the retrace.
Spring & Breakout: A false breakdown below the range, quickly reclaimed, followed by a strong bullish candle, would be the classic Wyckoff entry trigger.
⚠️ Disclaimer
This analysis is for informational purposes only and does not constitute financial advice. Cryptocurrency markets are highly volatile and risky. Always conduct your own research and consult with a professional before making investment decisions.

Daily Price Action: BITCOIN BTCUSD Tuesday 4/29/2025In this video, we will be looking into the potential price action BTCUSD.

Ripple Potential UpsidesHey Traders, in today's trading session we are monitoring XRPUSDT for a buying opportunity around 2.16 zone, Ripple is trading in an uptrend and currently is in a correction phase in which it is approaching the trend at 2.16 support and resistance area.
Trade safe, Joe.

Bitcoin's 215-Day Pattern: Another Breakout Loading?The Bitcoin chart shows a repeating pattern of consolidation lasting 215 days before each major upward breakout. This cycle has occurred multiple times over the past two years, with each accumulation zone followed by a strong bullish rally.
Currently, Bitcoin is once again emerging from a similar 215-day consolidation phase, suggesting the potential for another significant move to the upside if the pattern holds. If history repeats, we could see a target around $150K.
BINANCE:BTCUSDT CRYPTOCAP:BTC

BTC Correction Likely Before ATHBTCUSDT technical analysis update
BTC price could drop to the GETTEX:89K –$91K range before moving higher. There's a CME futures gap at $90.7K, which may act like a magnet. BTC has strong support around $90K and may see a small pullback before reaching a new all-time high.

BTC/USDT 1H Chart Analysis: Breakout Incoming?Hey traders! Let’s dive into this juicy BTCUSDT 1-hour chart. Bitcoin is teasing us with some serious action!
We’ve got a textbook symmetrical triangle pattern forming, with price consolidating tightly between converging trendlines. This is a classic setup for a big move — Bitcoin is coiling up like a spring, ready to explode!
The chart shows multiple phases of consolidation , with the latest triangle pushing BTC toward a critical decision point near the weekly high of $95,773.15 and the monthly high of $95,119.06.
The price is currently hovering around $95,000, testing resistance. A breakout above the upper trendline could send BTC soaring past $96,600, potentially targeting $97,200 or higher!
On the flip side, a rejection here might see it dip toward the daily low of $92,839.27 or even the lower trendline for support.
Key Levels to Watch:
Resistance: $95,773.15 (weekly high)
Support: $92,839.27 (daily low)
Breakout Target: $97,200+
Breakdown Target: $92,800
✉ What do you think — bullish breakout or bearish?
Drop your thoughts below!

BTC/USDT Analysis. The scenario remains unchanged
Over the past day, not much has changed for Bitcoin. We reached a local high, followed by a pullback.
Today, we're still trading within a relatively narrow range. The cumulative delta continues to decline (indicating a large amount of market selling), but it's not leading to any significant results. Volatility is also decreasing — all of this resembles preparation for an impulse, most likely to the upside.
At the moment, an abnormal cluster of market sells has appeared around ~$94,300, which was immediately absorbed by buyers. If the price returns to this level and we see a reaction from buyers, it could be a good opportunity to open a long position with a minimal stop. The target for this move would be the next sell zone.
Sell zones:
$95,000–$96,700 (accumulated volume)
$97,500–$98,400 (aggressive pushing volume)
$107,000–$109,000 (volume anomalies)
Buy zones:
~$94,300 (abnormal cluster)
$91,500–$90,000 (strong buy-side imbalance)
$88,100–$87,000 (market sell absorption)
$85,500–$84,000 (accumulated volume)
$82,700–$81,400 (volume zone)
Level at $74,800
$69,000–$60,600 (accumulated volume)

Say hello to the $110k Bitcoin !The BTC will increase $15K and reach to the top of the wedge in the coming weeks .
Give me some energy !!
✨We spend hours finding potential opportunities and writing useful ideas, we would be happy if you support us.
Best regards CobraVanguard.💚
_ _ _ _ __ _ _ _ _ _ _ _ _ _ _ _ _ _ _ _ _ _ _ _ _ _ _ _ _ _ _ _
✅Thank you, and for more ideas, hit ❤️Like❤️ and 🌟Follow🌟!
⚠️Things can change...
The markets are always changing and even with all these signals, the market changes tend to be strong and fast!!

BTCUSD INTRADAY uptrend continuation supported at 91940The BTC/USD pair maintains a bullish overall sentiment, underpinned by a sustained upward trend. However, recent intraday price action suggests a phase of sideways consolidation, indicating a potential buildup before the next directional move.
Key Levels:
Support: 91,940 (primary), followed by 90,200 and 88,110
Resistance: 99,300, with extended targets at 101,000 and 103,150
A corrective dip toward the key support zone at 91,940 could offer a bullish rebound opportunity. A successful bounce from this level would reinforce the uptrend and pave the way for a test of the 99,300 resistance. A breakout above this level may open the door to further gains toward 101,000 and 103,150 over the longer term.
Conversely, a decisive break and daily close below 91,940 would invalidate the bullish setup, potentially triggering a deeper pullback toward the 90,200 and 88,110 support levels.
Conclusion:
While the broader trend remains bullish, BTC/USD is currently consolidating. Traders should watch the 91,940 support closely—its defence may confirm trend continuation, while a breakdown could signal a short-term bearish reversal.
This communication is for informational purposes only and should not be viewed as any form of recommendation as to a particular course of action or as investment advice. It is not intended as an offer or solicitation for the purchase or sale of any financial instrument or as an official confirmation of any transaction. Opinions, estimates and assumptions expressed herein are made as of the date of this communication and are subject to change without notice. This communication has been prepared based upon information, including market prices, data and other information, believed to be reliable; however, Trade Nation does not warrant its completeness or accuracy. All market prices and market data contained in or attached to this communication are indicative and subject to change without notice.

Bitcoin 6X Lev. Full PREMIUM Trade-Numbers —2nd Entry (PP: 540%)I will explain my thinking as usual so you can make an informed decision.
I believe Bitcoin will make a new advance. When there is a move that leads to the challenge of resistance or support, there is always a stop, a retrace or pullback before additional action. Bitcoin here stopped at 95,000, which is the first resistance from our previous trade-signal and did produce a retrace but it was extremely small. This is a bullish signal.
The fact that the action remains at resistance and this resistance continues to be challenged, is also a bullish signal. The more this resistance gets challenged the weaker it becomes.
Now, a 2nd entry is riskier than the first one of course because the action is more advanced but not everybody can enter perfectly at bottom prices nor at the same time.
We manage risk through capital allocation and relatively low leverage, which is actually pretty high.
See the full numbers and you will see that risk is low.
The stop goes below the low 13-Jan. 2025. The lowest after the final advance happened at $91,688 on 24-April. This is a relatively safe chart setup.
_____
LONG BTCUSDT
Leverage: 6X
1) $96,000
2) $93,000
3) $90,000
Targets:
1) $104,250
2) $120,000
3) $131,400
4) $143,300
5) $165,000
6) $181,000
Stop-loss:
Close weekly below $86,000
Potential profits: 540%
Capital allocation: 5%
_____
I think timing is good on this one. The next move can happen within days because consolidation has been happening already for an entire week without much change in price, clearly a continuation pattern. Volume being low at this point is also a signal of consolidation.
The fact that there is no volume indicates that the true bullish action is yet to start.
Bears not being present indicates that growth will happen long-term as the bearish cycle (the previous correction) is over.
I wishing you great luck and profits.
The market always offers a second chance, always.
Namaste.

TradeCityPro | Bitcoin Daily Analysis #76👋 Welcome to TradeCity Pro!
Let’s dive into the Bitcoin analysis and key crypto indices. As usual, in this analysis I’ll review the futures triggers for the New York session.
⚡️ Not much has changed since yesterday, so without reviewing the previous analysis, let’s get into today’s setup to see what positions we can open.
⏳ 1-Hour Timeframe
As you can see on the 1-hour timeframe, the price is still within its range box. Even though yesterday it tested the lower range once and we expected a breakout to the upside, that didn’t happen, and the price was rejected from the 95370 resistance and continued to range.
✔️ After the rejection from this level, volume began to decline, which is a good sign. The lower the volume gets, the sharper the breakout move from the box is likely to be.
💥 If 95370 is broken, I definitely recommend having an open position, as the risk of hitting the stop loss is worth the potential gain. The target in case of a breakout will be the 98828 resistance.
⭐ The SMA99 is also providing good support and is currently sitting below the candles, which adds to the positive bias for this scenario.
🎲 If the price gets rejected from the resistance again, we’ll likely see more range-bound action today. But due to the strong bullish momentum, I don’t think the price will lose its support levels, and it’s likely to test 95370 again.
💫 That said, if I observe structural changes and see support levels like 91945 breaking, I’ll also be ready to take short positions.
🔽 However, for shorting, I think we should wait for more structure to form. Once the price shows more reaction to the 93626–95370 range box, and if 93626 breaks, we can enter a short. But right now, I’d personally wait for a break of 91945 before going short.
👑 BTC.D Analysis
Moving on to Bitcoin dominance, the range box is still intact, and price is above the 64.22 level. If Bitcoin breaks the 95370 resistance and BTC.D continues to rise without breaking below 64.22, then Bitcoin will outperform altcoins. If 64.41 is broken, we can expect a sharp bullish move in Bitcoin.
📊 To enter positions on altcoins, the best confirmation remains the break of the 64.22 level on BTC.D.
📅 Total2 Analysis
As for Total2, the 1.05 resistance still hasn’t been broken. To confirm the beginning of a bullish move in altcoins, we need a breakout of this level. The first target of this move would be the 1.07 resistance.
📉 To turn bearish, the first trigger is at 1.03. We’ll need to wait for the price to test it, so we can determine the precise level and react accordingly in future retests and breakouts.
📅 USDT.D Analysis
USDT.D behaves slightly differently from Bitcoin and Total2. While Bitcoin and Total2 are both near resistance and poised for a breakout, USDT.D is still some distance from the 4.99 support.
☘️ The probability of this support break coinciding exactly with Bitcoin and altcoin triggers is low. However, I believe this is a more significant trigger than Total2’s.
❌ Disclaimer ❌
Trading futures is highly risky and dangerous. If you're not an expert, these triggers may not be suitable for you. You should first learn risk and capital management. You can also use the educational content from this channel.
Finally, these triggers reflect my personal opinions on price action, and the market may move completely against this analysis. So, do your own research before opening any position.
