Ripple Potential UpsidesHey Traders, in today's trading session we are monitoring XRPUSDT for a buying opportunity around 2.16 zone, Ripple is trading in an uptrend and currently is in a correction phase in which it is approaching the trend at 2.16 support and resistance area.
Trade safe, Joe.
Bitcoin (Cryptocurrency)

Bitcoin's 215-Day Pattern: Another Breakout Loading?The Bitcoin chart shows a repeating pattern of consolidation lasting 215 days before each major upward breakout. This cycle has occurred multiple times over the past two years, with each accumulation zone followed by a strong bullish rally.
Currently, Bitcoin is once again emerging from a similar 215-day consolidation phase, suggesting the potential for another significant move to the upside if the pattern holds. If history repeats, we could see a target around $150K.
BINANCE:BTCUSDT CRYPTOCAP:BTC

BTC Correction Likely Before ATHBTCUSDT technical analysis update
BTC price could drop to the GETTEX:89K –$91K range before moving higher. There's a CME futures gap at $90.7K, which may act like a magnet. BTC has strong support around $90K and may see a small pullback before reaching a new all-time high.

BTC/USDT 1H Chart Analysis: Breakout Incoming?Hey traders! Let’s dive into this juicy BTCUSDT 1-hour chart. Bitcoin is teasing us with some serious action!
We’ve got a textbook symmetrical triangle pattern forming, with price consolidating tightly between converging trendlines. This is a classic setup for a big move — Bitcoin is coiling up like a spring, ready to explode!
The chart shows multiple phases of consolidation , with the latest triangle pushing BTC toward a critical decision point near the weekly high of $95,773.15 and the monthly high of $95,119.06.
The price is currently hovering around $95,000, testing resistance. A breakout above the upper trendline could send BTC soaring past $96,600, potentially targeting $97,200 or higher!
On the flip side, a rejection here might see it dip toward the daily low of $92,839.27 or even the lower trendline for support.
Key Levels to Watch:
Resistance: $95,773.15 (weekly high)
Support: $92,839.27 (daily low)
Breakout Target: $97,200+
Breakdown Target: $92,800
✉ What do you think — bullish breakout or bearish?
Drop your thoughts below!

BTC/USDT Analysis. The scenario remains unchanged
Over the past day, not much has changed for Bitcoin. We reached a local high, followed by a pullback.
Today, we're still trading within a relatively narrow range. The cumulative delta continues to decline (indicating a large amount of market selling), but it's not leading to any significant results. Volatility is also decreasing — all of this resembles preparation for an impulse, most likely to the upside.
At the moment, an abnormal cluster of market sells has appeared around ~$94,300, which was immediately absorbed by buyers. If the price returns to this level and we see a reaction from buyers, it could be a good opportunity to open a long position with a minimal stop. The target for this move would be the next sell zone.
Sell zones:
$95,000–$96,700 (accumulated volume)
$97,500–$98,400 (aggressive pushing volume)
$107,000–$109,000 (volume anomalies)
Buy zones:
~$94,300 (abnormal cluster)
$91,500–$90,000 (strong buy-side imbalance)
$88,100–$87,000 (market sell absorption)
$85,500–$84,000 (accumulated volume)
$82,700–$81,400 (volume zone)
Level at $74,800
$69,000–$60,600 (accumulated volume)

Say hello to the $110k Bitcoin !The BTC will increase $15K and reach to the top of the wedge in the coming weeks .
Give me some energy !!
✨We spend hours finding potential opportunities and writing useful ideas, we would be happy if you support us.
Best regards CobraVanguard.💚
_ _ _ _ __ _ _ _ _ _ _ _ _ _ _ _ _ _ _ _ _ _ _ _ _ _ _ _ _ _ _ _
✅Thank you, and for more ideas, hit ❤️Like❤️ and 🌟Follow🌟!
⚠️Things can change...
The markets are always changing and even with all these signals, the market changes tend to be strong and fast!!

BTCUSD INTRADAY uptrend continuation supported at 91940The BTC/USD pair maintains a bullish overall sentiment, underpinned by a sustained upward trend. However, recent intraday price action suggests a phase of sideways consolidation, indicating a potential buildup before the next directional move.
Key Levels:
Support: 91,940 (primary), followed by 90,200 and 88,110
Resistance: 99,300, with extended targets at 101,000 and 103,150
A corrective dip toward the key support zone at 91,940 could offer a bullish rebound opportunity. A successful bounce from this level would reinforce the uptrend and pave the way for a test of the 99,300 resistance. A breakout above this level may open the door to further gains toward 101,000 and 103,150 over the longer term.
Conversely, a decisive break and daily close below 91,940 would invalidate the bullish setup, potentially triggering a deeper pullback toward the 90,200 and 88,110 support levels.
Conclusion:
While the broader trend remains bullish, BTC/USD is currently consolidating. Traders should watch the 91,940 support closely—its defence may confirm trend continuation, while a breakdown could signal a short-term bearish reversal.
This communication is for informational purposes only and should not be viewed as any form of recommendation as to a particular course of action or as investment advice. It is not intended as an offer or solicitation for the purchase or sale of any financial instrument or as an official confirmation of any transaction. Opinions, estimates and assumptions expressed herein are made as of the date of this communication and are subject to change without notice. This communication has been prepared based upon information, including market prices, data and other information, believed to be reliable; however, Trade Nation does not warrant its completeness or accuracy. All market prices and market data contained in or attached to this communication are indicative and subject to change without notice.

Bitcoin 6X Lev. Full PREMIUM Trade-Numbers —2nd Entry (PP: 540%)I will explain my thinking as usual so you can make an informed decision.
I believe Bitcoin will make a new advance. When there is a move that leads to the challenge of resistance or support, there is always a stop, a retrace or pullback before additional action. Bitcoin here stopped at 95,000, which is the first resistance from our previous trade-signal and did produce a retrace but it was extremely small. This is a bullish signal.
The fact that the action remains at resistance and this resistance continues to be challenged, is also a bullish signal. The more this resistance gets challenged the weaker it becomes.
Now, a 2nd entry is riskier than the first one of course because the action is more advanced but not everybody can enter perfectly at bottom prices nor at the same time.
We manage risk through capital allocation and relatively low leverage, which is actually pretty high.
See the full numbers and you will see that risk is low.
The stop goes below the low 13-Jan. 2025. The lowest after the final advance happened at $91,688 on 24-April. This is a relatively safe chart setup.
_____
LONG BTCUSDT
Leverage: 6X
1) $96,000
2) $93,000
3) $90,000
Targets:
1) $104,250
2) $120,000
3) $131,400
4) $143,300
5) $165,000
6) $181,000
Stop-loss:
Close weekly below $86,000
Potential profits: 540%
Capital allocation: 5%
_____
I think timing is good on this one. The next move can happen within days because consolidation has been happening already for an entire week without much change in price, clearly a continuation pattern. Volume being low at this point is also a signal of consolidation.
The fact that there is no volume indicates that the true bullish action is yet to start.
Bears not being present indicates that growth will happen long-term as the bearish cycle (the previous correction) is over.
I wishing you great luck and profits.
The market always offers a second chance, always.
Namaste.

TradeCityPro | Bitcoin Daily Analysis #76👋 Welcome to TradeCity Pro!
Let’s dive into the Bitcoin analysis and key crypto indices. As usual, in this analysis I’ll review the futures triggers for the New York session.
⚡️ Not much has changed since yesterday, so without reviewing the previous analysis, let’s get into today’s setup to see what positions we can open.
⏳ 1-Hour Timeframe
As you can see on the 1-hour timeframe, the price is still within its range box. Even though yesterday it tested the lower range once and we expected a breakout to the upside, that didn’t happen, and the price was rejected from the 95370 resistance and continued to range.
✔️ After the rejection from this level, volume began to decline, which is a good sign. The lower the volume gets, the sharper the breakout move from the box is likely to be.
💥 If 95370 is broken, I definitely recommend having an open position, as the risk of hitting the stop loss is worth the potential gain. The target in case of a breakout will be the 98828 resistance.
⭐ The SMA99 is also providing good support and is currently sitting below the candles, which adds to the positive bias for this scenario.
🎲 If the price gets rejected from the resistance again, we’ll likely see more range-bound action today. But due to the strong bullish momentum, I don’t think the price will lose its support levels, and it’s likely to test 95370 again.
💫 That said, if I observe structural changes and see support levels like 91945 breaking, I’ll also be ready to take short positions.
🔽 However, for shorting, I think we should wait for more structure to form. Once the price shows more reaction to the 93626–95370 range box, and if 93626 breaks, we can enter a short. But right now, I’d personally wait for a break of 91945 before going short.
👑 BTC.D Analysis
Moving on to Bitcoin dominance, the range box is still intact, and price is above the 64.22 level. If Bitcoin breaks the 95370 resistance and BTC.D continues to rise without breaking below 64.22, then Bitcoin will outperform altcoins. If 64.41 is broken, we can expect a sharp bullish move in Bitcoin.
📊 To enter positions on altcoins, the best confirmation remains the break of the 64.22 level on BTC.D.
📅 Total2 Analysis
As for Total2, the 1.05 resistance still hasn’t been broken. To confirm the beginning of a bullish move in altcoins, we need a breakout of this level. The first target of this move would be the 1.07 resistance.
📉 To turn bearish, the first trigger is at 1.03. We’ll need to wait for the price to test it, so we can determine the precise level and react accordingly in future retests and breakouts.
📅 USDT.D Analysis
USDT.D behaves slightly differently from Bitcoin and Total2. While Bitcoin and Total2 are both near resistance and poised for a breakout, USDT.D is still some distance from the 4.99 support.
☘️ The probability of this support break coinciding exactly with Bitcoin and altcoin triggers is low. However, I believe this is a more significant trigger than Total2’s.
❌ Disclaimer ❌
Trading futures is highly risky and dangerous. If you're not an expert, these triggers may not be suitable for you. You should first learn risk and capital management. You can also use the educational content from this channel.
Finally, these triggers reflect my personal opinions on price action, and the market may move completely against this analysis. So, do your own research before opening any position.

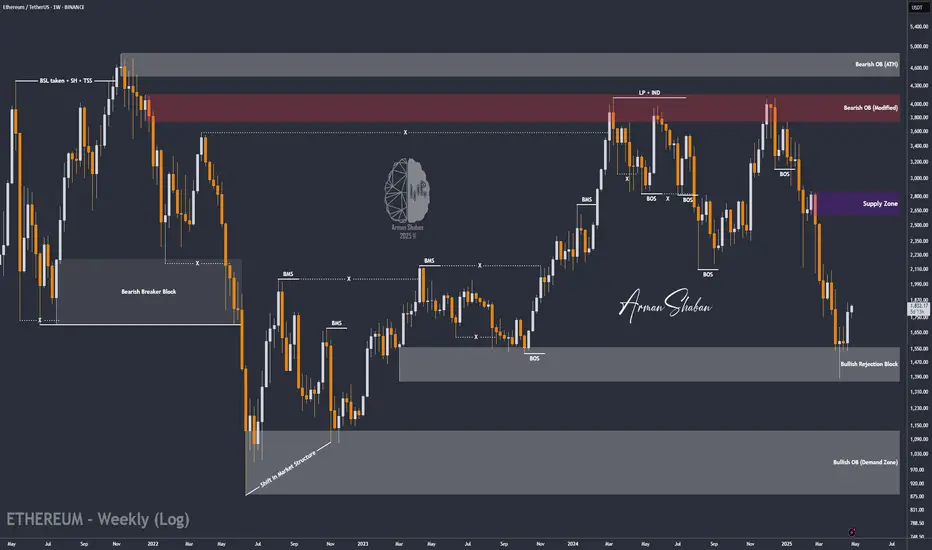
ETH/USDT : Bulls are coming back? (READ THE CAPTION)By analyzing the #Ethereum chart on the weekly (logarithmic) timeframe, we can see that after reaching the demand zone between $1400 and $1550, buying pressure increased significantly. Currently, Ethereum is trading around $1800, and I expect to see the next bullish wave soon. The potential upside targets are $1990, $2500, and $2600. This analysis will be updated accordingly!
Please support me with your likes and comments to motivate me to share more analysis with you and share your opinion about the possible trend of this chart with me !
Best Regards , Arman Shaban
BTC/USD: Get Ready for another Bullrun ! (READ THE CAPTION)By analyzing the #Bitcoin chart on the weekly timeframe, we can see that the price is currently trading around $95,000. Soon, we should expect Bitcoin to enter the key supply zone between $99,500 and $109,500, where we’ll closely watch for the market's reaction.
Bitcoin continues to show strong demand, and we may witness another bullish spike in the short term. All previous assumptions from the last analysis remain valid.
Please support me with your likes and comments to motivate me to share more analysis with you and share your opinion about the possible trend of this chart with me !
Best Regards , Arman Shaban

Last Dump On BTC Be SURE TO BUY ITHi im here again we will see a last dump on btc to 89-90k be sure to buy it and don't miss the chance

Bitcoin - follow the trend until it breaks Bitcoin - follow the trend until it breaks
best Long is after Sl hunt of a range

BITCOIN Why is this rally surprising you?Bitcoin (BTCUSD) has completed 3 straight green weeks, with an impressive last 1W candle closing and started the new one right where it left. This rise shouldn't be surprising to most as it has fulfilled all the conditions that initiated all major rallies since the November 2022 Bear market bottom.
The first week of April rebounded strongly on the 1W MA50 (blue trend-line), which as mentioned numerous times on our channel, has been this Bull Cycle's main Support and kickstarted the Q4 2023 and Q4 2024 rallies.
At the same time, the 1W RSI broke last week above its MA, which has been the final confirmation of those Bullish Legs. With the 1W Bollinger Bands (BB) still ranged, the top trend-line is expected to rise aggressively as BTC's uptrend accelerates, something that resembles October 2023 and October 2024.
Throughout this Bull Cycle, those rallies have lasted around the same time, the longest being 14 weeks. As a result, the latest the current Bullish Leg tops should be on the week of July 14 2025 and a +92% rise as February - March 2024 should deliver a test of the Higher Highs trend-line around $140000.
Do you think that's the most probable scenario? Feel free to let us know in the comments section below!
-------------------------------------------------------------------------------
** Please LIKE 👍, FOLLOW ✅, SHARE 🙌 and COMMENT ✍ if you enjoy this idea! Also share your ideas and charts in the comments section below! This is best way to keep it relevant, support us, keep the content here free and allow the idea to reach as many people as possible. **
-------------------------------------------------------------------------------
💸💸💸💸💸💸
👇 👇 👇 👇 👇 👇

GBPJPY DETAILED TECHNICAL AND FUNDAMENTALSGBPJPY is currently trading around the 191.00 zone, and price action is forming a classic bullish flag pattern on the 4H chart. This follows a strong impulse leg, suggesting a potential continuation to the upside. The consolidation is tight and healthy, showing market participants are preparing for a breakout. My upside target stands at 193.000, which aligns with the descending trendline resistance.
From a fundamental perspective, the British Pound remains supported by recent hawkish signals from the Bank of England, which is facing persistent inflation pressures. Meanwhile, the Japanese Yen continues to weaken across the board due to the Bank of Japan’s ultra-loose monetary stance and its defense of yield curve control, which makes it less attractive in a high-interest environment.
Technically, this setup aligns with key momentum indicators and market structure. If price breaks above the flag pattern with volume confirmation, we can expect buyers to take control, pushing price toward the 193.000 resistance zone. This level also coincides with a key liquidity area where prior sellers may be trapped.
Overall, GBPJPY continues to offer a solid bullish bias in the short term. The pair is fundamentally and technically aligned for a push higher. Breakout traders should monitor closely as the price approaches the upper trendline of the flag. This is one of the most watched JPY pairs right now—momentum is building.


btc . tue . recap plan to LONG came to fruition
LONG note:
as i found wOpen heavily BULLISH - i was eager to get in early and equaly positioned:
cw0.5 . 94.200
to
cw0 . 92781
entry: 93.975
this left me with not the nicest entry . not all orders were filled . should have favoured increasing order size . one never really knows until it happens . but happy
DAY TRADE note:
a day trade of nysOpen SFP . 95.400 (to ride down for our LONG IDEA)
LONG SUPPORT will show during the day . NICE! . but not taken . it supported our search for LONG though
recap
wOpen . ASIA . LONG
nysOpen . SFP to 5.30pm . LONG
tueOpen . ASIA take profit . rotation to cw0.5 . (LONG in favour)
nysOpen . idealy tp1 : SFP . possibly rotation . (look out for SHORT and LONG)

BTCUSDTHello Traders! 👋
What are your thoughts on BITCOIN?
Bitcoin has reclaimed the $90K– GETTEX:92K zone after a sharp 32% correction from its all-time high, closing the week strongly above this critical area.
As long as price holds above $90,000, the primary bias remains bullish. The $90K– GETTEX:92K area now acts as a key support zone, ideal for pullback buying opportunities.
A breakout above $101,000 could trigger a strong acceleration toward the next major targets at $115K–$125K.
A weekly close below the green support zone would invalidate the bullish scenario and suggest caution.
What’s your outlook? Will Bitcoin maintain momentum and break $101K? Share your thoughts below!
Don’t forget to like and share your thoughts in the comments! ❤️

Bitcoin Dominance TA, Bearish SignalsRecently I spotted a very strong, long-term bearish signal on this index. A triple-bearish signal as it is present with three indicators. I am talking about a bearish divergence.
Volume has been dropping significantly as the index moves higher.
The weekly RSI peaked October 2023 and has been producing lower highs. The MACD peaked July 2023.
These are long-term, but let's have a closer look and consider the daily chart.
Here we have some interesting signals as well, let's start with the candles:
—Here we have a rising wedge ending in a rounded top and long-term double-top. The uptrend is also in risk of failing. A breakdown of this uptrend, which can happen anytime, would result in a strong crash of this index.
Next is the daily RSI:
—The peak happened November 2024. There is also a short-term lower high as the peak this month happened on the 7th of April, the index peaked on the 22nd.
—The daily RSI is already trending lower.
Clearly the most interesting and revealing of all three indicators is the daily MACD. Let me show you the chart first and then I'll describe the signals:
—Here the lower high is so strong that reveals what is coming to this index. The MACD peaked in February and produced a lower high this month, April. Notice the bearish cross, it happened yesterday.
The daily MACD and RSI trending down with short-term, mid-term, long-term and long long-term bearish divergence all point towards a lower reading on these oscillators.
The last major drop for this index happened in November 2024 with the bottom hitting a month later, December 2024. At this time Bitcoin produced a very strong advance as well as the entire Altcoins market, it was awesome.
It is surely interesting to notice that the index recovers and moves higher while Bitcoin continued to grow. But at that time the Altcoins were starting their correction. Most of the Altcoins peaked late November 2024 and some in early December 2024. So this index is more related to how the Altcoins behave rather than Bitcoin.
When it drops, it does not mean that Bitcoin will drop but that the Altcoins will grow. When it grows, it does not necessarily means that Bitcoin is moving up but that the Altcoins are moving down.
We know the Altcoins are set to produce their strongest growth period since 2021. This Bitcoin Dominance index works as confirmation. It leaves no room for doubt.
» Doubt can remain open as to whether the start of this rise will happen tomorrow or within a few weeks. Short-term, anything goes; the market can become erratic and produce some strong shakeouts, specially preceding a major wave of growth. But after 2-3 weeks, it is 1,000% certain that the entire Cryptocurrency market will be bullish and up. Regardless of what this index does or anything else for that matter. When the time is ripe, the market grows.
The time is ripe right now... You will be happy with the results.
Namaste.

Millions Of Trades Liquidated —Bitcoin Flash Jump Beyond $100KMillions of people are about to get liquidated. The thing is that they set up their orders so that liquidation only happens above 100K and they think they will be able to close their position before Bitcoin reaches that level if it doesn't break down.
First, Bitcoin is not breaking down. Just notice that every time there is any type of bearish action it is quickly bought.
Second. No, no second that's all.
Bitcoin is set to grow and will do so in a flash. Rather than a flash crash, a flash advance.
Bitcoin always surprises so prepare because this is what will happen. Rather than going down as the majority actually expect, Bitcoin will break-up and do so strong, so strong that there will be no time to react. People will be caught in the shock and while they wait to look around and see what happens, Bitcoin will be moving up.
Instead of $100,000, it will go to $102,000 or $104,000 or higher just to make sure that all the over-leveraged are kicked out before additional growth.
This is just a friendly reminder.
Pray for the dead bears and people without a clue, they are about to lose everything, for them, it will be tough.
On our side though... Enjoy the profits as they come.
Namaste.

ETHBTC x ETH.DETHBTC x ETH.D
Ethereum bitcoin pair and ethereum dominance will gain upward momentum with the reaction it receives from the major support line in 2019
The better Ethereum is, the better Altcoins will be.

Bitcoin still defying gravity. Can it hold and continueBTC is flagging out at the previously defined point of interest. Although there are signs of bullish divergence market structure has yet to provide enough evidence that a retracement is in effect. However, the chart shows a volume gap below that presents an opportunity.
Full TA: Link in the BIO

BTCDOM at the threshold of a strong impulseA very interesting situation is now observed on such a ticker as BINANCE:BTCDOMUSDT.P - bitcoin dominance index released by Binance. It differs from CRYPTOCAP:BTC.D in that it shows bitcoin dominance to the top 20 altcoins.
On the weekly chart of BINANCE:BTCDOMUSDT.P there is a very old AMEXP model from June 5, 2023, which essentially describes the entire current uptrend on this index. So within this model there was a target value of 100% level (2625.1), which has been a resistance for 112 days and during this time there were 4 attempts to test it.
In case we see a breakout, there may well be a very strong impulse, which will be accompanied by great volatility in the market.
What two scenarios could work at this point?
1️⃣ Index growth will be due to the fact that the top 20 altcoins will stand still/fall on the background of INDEX:BTCUSD growth.
2️⃣ Index growth will be due to the fact that the top-20 altcoins will fall faster than INDEX:BTCUSD will fall.
