BITCOIN New Update (4H)Before anything else, we shouldn't forget that through multiple analyses shared from the bottom on higher timeframes, we knew Bitcoin was highly bullish.
The red zone from the previous analysis has been engulfed and cleared | a lot of sell orders have been absorbed, leading to a pumpy move. It’s better to wait for a pullback now.
The price has now reached a resistance zone, where a large number of sell orders have been absorbed, leading to a pumpy move.
Also, the diametric pattern is still visible, and after the completion of wave F | which has just occurred | a reversal is expected for wave G.
For risk management, please don't forget stop loss and capital management
Comment if you have any questions
Thank You
Bitcoinanalysis

Bitcoin has broken above the $86,000 zone, just as we anticipateBitcoin has broken above the $86,000 zone, just as we anticipated.
🔹 On-Chain Insights:
• Long-Term Holders: Mild distribution — profit-taking phase
• Network Activity: Steady — strong and healthy
• Sentiment: Bullish — weak USD and rising institutional inflows
🔹 Macro Overview:
• U.S.–China tensions and Fed uncertainty boost Bitcoin’s safe-haven appeal
• Institutions are steadily increasing exposure — a strong positive signal
Stay tuned with megvipofficial for more accurate updates and premium crypto signals!

Bitcoin Tests Critical Resistance Level: What's Next?FenzoFx—Bitcoin is testing the $88,650 resistance, a level it has rejected more than three times. The Stochastic and RSI 14 indicators remain in overbought territory, indicating short-term overvaluation. Entering the market at this price is not recommended.
If BTC/USD stays below $88,650, a consolidation phase may follow, with potential dips to $88,140 and $82,810.
Bullish Scenario
The bearish outlook is invalidated if BTC closes above $88,650, potentially resuming the uptrend toward $90,000.

BTC Breaks Key Resistance –Pullback Your Last Chance to Enter!?To start today's analysis, it's best to look at the Bitcoin ( BINANCE:BTCUSDT ) analysis I shared with you on April 10 , which can give us good insight and has performed well so far .👇
Bitcoin seems to have finally managed to break through Important Resistance lines as well as the Resistance zone ($86,500-$85,150) . The break volume is also high and could be a good sign for the continuation of the upward trend .
According to Elliott Wave theory , with the breaking of important resistance lines , we should wait for the next 5 impulsive waves , which I will try to analyze step by step in this idea and future ideas.
I expect Bitcoin to attack the Heavy Resistance zone ($95,000-$88,500) for the first time after the pullback to the broken Resistance zone ($86,500-$85,150) (it is better to enter a long position on the pullback ). Basically, assets can NOT break such heavy zones for the first time . ( With very good news, it may break for the first time ).
Cumulative Long Liquidation Leverage: $86,022-$85,539
Cumulative Short Liquidation Leverage: $89,340-$88,000 = Important
Do you think the main uptrend has resumed or will Bitcoin correct again?
Note: The pullback is likely to start from the third point of contact with the Resistance lines.
Note: If Bitcoin falls below $85,100, it seems we should expect further declines.
Please respect each other's ideas and express them politely if you agree or disagree.
Bitcoin Analyze (BTCUSDT), 1-hour time frame.
Be sure to follow the updated ideas.
Do not forget to put a Stop loss for your positions (For every position you want to open).
Please follow your strategy and updates; this is just my Idea, and I will gladly see your ideas in this post.
Please do not forget the ✅' like '✅ button 🙏😊 & Share it with your friends; thanks, and Trade safe.

Failed Breakout + Rising Wedge = Bearish Signal for Bitcoin!?Bitcoin ( BINANCE:BTCUSDT ) attacked the Resistance zone ($87,520-$85,840) and the important Resistance line as I expected in yesterday's idea , but it seems that it failed to break .
Bitcoin is moving between two Support and Resistance zones .
From a Classic Technical Analysis , Bitcoin appears to have formed a Rising Wedge Pattern .
From an Elliott Wave theory , Bitcoin appears to have completed a main wave 5 on the 1-hour time frame .
Also, we can see the Regular Divergence(RD-) between Consecutive Peaks .
If we look at the Bitcoin chart in the 4-hour timeframe , a Shooting Star Candlestick Pattern with high volume is clearly visible near the Resistance zone ($87,520-$85,840 ), which could signal a reversal and decline in Bitcoin .
I expect Bitcoin to start declining again after an upward correction and break the lower line of the rising wedge pattern , and reach the targets I have indicated on the chart.
Cumulative Short Liquidation Leverage: $87,708-$86,487
Cumulative Long Liquidation Leverage: $84,520-$83,687
Do you think Bitcoin can finally break the important resistance line? I would like to hear your thoughts.
Note: If Bitcoin breaks above the Resistance zone ($87,520-$85,840), we can expect a pump.
Note: If Bitcoin falls below $81,000, we can expect further declines.
Please respect each other's ideas and express them politely if you agree or disagree.
Bitcoin Analyze (BTCUSDT), 1-hour time frame.
Be sure to follow the updated ideas.
Do not forget to put a Stop loss for your positions (For every position you want to open).
Please follow your strategy and updates; this is just my Idea, and I will gladly see your ideas in this post.
Please do not forget the ✅' like '✅ button 🙏😊 & Share it with your friends; thanks, and Trade safe.

BTC/USD Rallies Above $82,140FenzoFx—Bitcoin has surged past $82,140 resistance and is now trading near $86,800, correcting 1.0% of its recent gains.
The bullish trend persists above the 50-period simple moving average, with immediate support at $86,140 offering a potential entry point for buyers. If this level holds, the uptrend could target $89,000.
Conversely, a dip below $86,140 might push prices toward $84,000 or $82,811.
>>> No Deposit Bonus
>>> %100 Deposit Bonus
>>> Forex Analysis Contest
All at FenzoFx Decentralized Forex Broker

BTC New Update (12H)This analysis is an update of the analysis you see in the "Related publications" section
We are now within the red circle from the previous analysis, but it seems that wave e of the pattern has extended a bit further.
There’s a clear order block on the chart, and below this order block, there is a liquidity pool. We expect a reaction to the red zone
For risk management, please don't forget stop loss and capital management
Comment if you have any questions
Thank You

BTCUSD - $100k soon? [UPDATE]MARKET UPDATE.
Price broke out of the Descending Trendling and has pulled back to retest the Trendline and a Key Demand zone.
Stacked Confluences:
1. Trendline Break & Retest.
2. Liquidity sweep below support.
3. BOS after price reacted from the Demand.
I’m watching for continuation towards $85.8k and beyond.
If bullish step in here this could be the next bullish leg up.
Let’s see how it plays out.
What are your thoughts on BTC this week let me know what you think in the comments.

If the market reaches the $88,490 level, we'll look for selling.BTCUSDT Weekly Analysis: Navigating the Range-Bound Market
Bitcoin (BTC) is currently trading in a range-bound market, showcasing a delicate balance between buying and selling pressures. As traders, it's essential to identify key levels and potential trading opportunities.
Key Selling Area: $88,490
We've identified a crucial selling area at $88,490, where sellers are actively participating. This level has the potential to cap upward movements, and we're waiting for the market to reach this zone.
Trading Strategy:
1. Sell Setup: If the market reaches the $88,490 level, we'll look for selling opportunities, targeting lower levels and taking advantage of potential downward momentum.
2. Alternative Scenario: If the market doesn't reach the $88,490 zone, we'll wait for a clear breakdown from the current range, with a candle closing below the range. This would signal a potential shift in market sentiment.
Market Outlook:
The range-bound market presents both challenges and opportunities. By monitoring key levels and waiting for confirmation, we can make informed trading decisions and navigate the markets effectively.
What to Watch:
1. $88,490 Level: A key selling area that could determine the next move.
2. Range Boundaries: Monitoring the current range and waiting for a breakdown or breakout.
3. Market Sentiment: Keeping an eye on market sentiment and adjusting our strategy accordingly.
By staying vigilant and adapting to market conditions, we can capitalize on potential trading opportunities and navigate the complexities of the cryptocurrency market.

BITCOIN Bull Run Activated – Here’s Why $105K Is NEXT!COINBASE:BTCUSD is displaying strong bullish potential after forming a clear double bottom around the significant support zone near $74,000. The decisive rejection of this critical area and the inability to form a lower low highlights the exhaustion of sellers at this key level. The formation of this double bottom, coupled with a solid bullish reaction, suggests institutions are actively accumulating Bitcoin, driving prices upward.
The current market structure implies a bullish continuation toward the significant resistance zone around $105,000. With the ascending channel clearly intact and buyers stepping aggressively at support, a sustained bullish impulse toward the channel's upper boundary is very likely.
From a fundamental perspective, Bitcoin is gaining strength due to several key macroeconomic factors unfolding globally. The recent decision by the Trump administration to significantly escalate trade tariffs has heightened economic uncertainty, disrupting traditional markets and spurring investors toward alternative assets. Historically, Bitcoin has thrived during periods of economic instability and policy uncertainty, as investors seek to hedge against volatility in equities, bonds, and fiat currencies.
Furthermore, the tightening monetary policies across major global economies are exacerbating recessionary fears. Central banks face increasingly difficult decisions between managing inflation and sustaining economic growth. This dilemma continues to reinforce Bitcoin's narrative as "digital gold," a decentralized hedge immune to direct manipulation by central authorities. As institutions and investors recalibrate their portfolios amid these conditions, capital allocation toward Bitcoin is expected to rise significantly.
Institutional adoption continues its upward momentum, evidenced by increased activity on spot markets and significant inflows into crypto-based investment vehicles. Regulatory clarity in major jurisdictions and infrastructure improvements have reduced previous barriers, enabling broader and deeper institutional participation in the crypto ecosystem. This growing institutional endorsement solidifies Bitcoin's bullish case, providing strong foundational support for a sustained move towards the targeted $105,000 resistance zone.
The convergence of technical patterns and powerful fundamental catalysts strongly supports Bitcoin's imminent upside potential.
Traders should closely watch for confirmation signals, such as increasing bullish volume, strong candle closures above intermediate resistance levels, and higher low formations, to validate this bullish scenario.
Feel free to share your thoughts or add further insights into this analysis!

Bitcoin Bullish Bat Harmonic Forming – Breakout Imminent!?Bitcoin ( BINANCE:BTCUSDT ) then reached $85,500 , as I expected in my previous post .
Today, I want to share with you a short-term analysis of Bitcoin , and Bitcoin can break the Important Resistance line !
Bitcoin is trading near the Support zone($83,880-$82,380) and Support lines .
Bitcoin is likely to start rising again with the help of the Bullish Bat Harmonic Pattern .
I expect Bitcoin to start rising again either with the help of the Bullish Bat Harmonic Pattern or near the Support lines and Cumulative Long Liquidation Leverage($82,426-$81,439) . The first target could be the important resistance line , and if it breaks, it looks like Bitcoin could break the resistance zone ($87,520-$85,840 ) as well.
Cumulative Short Liquidation Leverage: $86,624-$85,486
Note: To break the Important Resistance line , we need a candle with high volume at least on the 4-hour time frame , like the Bullish Marubozu candle ; otherwise, it is probably we will see fake break . Since this line is of great importance, it is better to look for a confirming candle on the 4-hour time frame as well ( even a Doji candle with a small green body ).
Note: If Bitcoin falls below $81,000, we can expect further declines.
Do you think Bitcoin can break the Important Resistance line!?
Please respect each other's ideas and express them politely if you agree or disagree.
Bitcoin Analyze (BTCUSDT), 15-minute time frame.
Be sure to follow the updated ideas.
Do not forget to put a Stop loss for your positions (For every position you want to open).
Please follow your strategy and updates; this is just my Idea, and I will gladly see your ideas in this post.
Please do not forget the ✅' like '✅ button 🙏😊 & Share it with your friends; thanks, and Trade safe.

Bitcoin Bulls Pave Path to $100,000FenzoFx—Bitcoin is trading bullishly, staying above the 50-period SMA and the 81,160 support. Currently, it hovers around $85,650, testing resistance.
As long as prices hold above 81,160, the next target could be $88,650. However, if bears push below $82,811, consolidation may occur, with support at 81,160.
Trade BTC/USD swap-free, effortlessly. >>> FenzoFx Decentralized Forex Broker

Bitcoin Dips, Then Rips – What’s Next? (12H)The Bitcoin correction started right from where we placed the red arrow on the chart, and it appears the pattern is either a diametric or a symmetrical formation.
From the red circle, we expect another correction and drop toward the green zone. Once the price reaches the green zone, we anticipate a bullish move. perhaps even stronger this time!
A daily candle closing below the invalidation level will invalidate this outlook.
For risk management, please don't forget stop loss and capital management
When we reach the first target, save some profit and then change the stop to entry
Comment if you have any questions
Thank You

Bitcoin’s 80-Day Correction Ending!?(Signs)Today, I want to share with you a mid-term analysis of Bitcoin( BINANCE:BTCUSDT ), I hope it will be useful for you.
Please stay with me.
Bitcoin started to fall last week due to the tariffs that Donald Trump imposed on countries around the world. In general, since last week, Bitcoin has become more correlated with US stock market indices (such as FOREXCOM:SPX500 ) than before.
But yesterday, Donald Trump postponed the implementation of tariffs for 90 days , except for China , which caused the US stock market indices to grow rapidly, and Bitcoin did not miss out on this growth. So, for the next 90 days , we should wait for news of bilateral tariffs between China and the US , which is likely to make an agreement between the two countries. What do you think!?
Also, just minutes ago, key U.S. inflation data was released — and it came in softer than expected.
The CPI m/m dropped to -0.1%, and Core CPI m/m slowed to 0.1% , both missing forecasts. This drop in inflation significantly reduces immediate pressure on the Fed to maintain a hawkish stance . With inflation cooling off, the market is now pricing in a more dovish Fed , which has historically been a bullish catalyst for Bitcoin .
Also, in the last 24 hours , another positive news came for Bitcoin: " China and Russia are using Bitcoin to settle energy trades ," which could be effective in increasing the price of Bitcoin .
--------------------------------------------
Now, based on the above explanation, let's focus on analyzing the Bitcoin chart on the 12-hour time frame .
Bitcoin started to rise quickly after touching the Heavy Support zone($73,780-$59,000) , Potential Reversal Zone(PRZ) , and 50_SMA(Weekly) . It seems that the Important Uptrend line breakout has NOT been successfully completed. One sign of a return could be the formation of a Morningstar Candlestick Pattern , which has also been accompanied by good volume .
Bitcoin has been moving in a descending channel for the past 80 days since its All-Time High(ATH=$109,588) , so a break of the upper line of this descending channel could be a significant sign of a rebound for Bitcoin .
Bitcoin is trying to break the Resistance zone($84,000-$81,130) . The price that is important for Bitcoin right now is $84,000 ; if Bitcoin can close a candle on the 4-hour time frame above the Resistance zone($84,000-$81,130) and $84,000 , we can hope for a breakout of the descending channel.
In terms of the Elliott Wave theory , Bitcoin appears to have been in a Double Three Correction(WXY) for the past 80 days. A break of the descending channel could reconfirm the end of this correction.
I expect Bitcoin to fill the CME Gap($85,940-$85,240) after breaking the Resistance zone($84,000-$81,130) in the first step and make the first attack on 50_SMA(Daily) . If the descending channel breaks, the second target could be around $88,000 , where there is an important Cumulative Short Liquidation Leverage($89,319-$88,375) .
Also, if Bitcoin moves in a range between $90,000 and $85,000 , we can expect an Altseason , given the conditions of BTC.D% ( CRYPTOCAP:BTC.D ). What do you think?
Note: If Bitcoin falls below $77,200, we should expect further declines.
Note: If Bitcoin can break the Heavy Resistance zone($95,000-$88,500), we should expect a new All-Time High(ATH).
Please respect each other's ideas and express them politely if you agree or disagree.
Bitcoin Analyze (BTCUSDT), 12-hour time frame.
Be sure to follow the updated ideas.
Do not forget to put a Stop loss for your positions (For every position you want to open).
Please follow your strategy and updates; this is just my Idea, and I will gladly see your ideas in this post.
Please do not forget the ✅' like '✅ button 🙏😊 & Share it with your friends; thanks, and Trade safe.

Bitcoin Short-Term Setup: Watch $79K Resistance!!!Bitcoin ( BINANCE:BTCUSDT ) started to fall again ,as I expected in the previous post .
This post is also a short-term analysis and is on the 15-minute time frame .
Bitcoin is moving near the Potential Reversal Zone(PRZ) .
In terms of Elliott Wave theory , Bitcoin appears to have completed a 5-wave downtrend on the 15-minute timeframe.
I expect Bitcoin to continue its upward trend in the coming hours , at least to the Resistance zone($79,350-$78,540) .
Note: If Bitcoin falls below $75,470, we can expect further declines.
Please respect each other's ideas and express them politely if you agree or disagree.
Bitcoin Analyze (BTCUSDT), 15-minute time frame.
Be sure to follow the updated ideas.
Do not forget to put a Stop loss for your positions (For every position you want to open).
Please follow your strategy and updates; this is just my Idea, and I will gladly see your ideas in this post.
Please do not forget the ✅' like '✅ button 🙏😊 & Share it with your friends; thanks, and Trade safe.

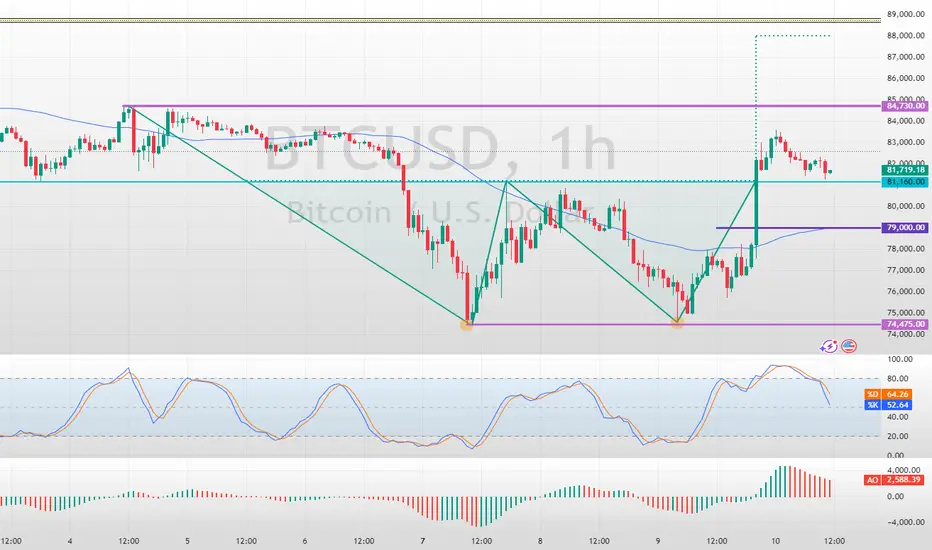
Bitcoin Double Bottom Pattern Came into PlayFenzoFx—Bitcoin jumped upward from $74,475 support as expected due to the formation of a double bottom pattern on the 1-hour chart, which is a bullish signal.
As of this writing, the price is stabilizing and testing the $81,160 mark as support. However, the 50-SMA on the 1-hour chart serves as the pivot point between the bull and bear market.
The next bullish target could be $84,730, followed by $88,000 if BTC holds above the discussed moving average.
Trade BTC/USD Swap Free at FenzoFx Decentralized Broker
Bitcoin Pullback Complete – Bears Gearing Up for Round Two!!!First of all, let me say that the market has been very excited these past few days, so be more careful with your capital management.
Also, these days, Bitcoin ( BINANCE:BTCUSDT ) has a high correlation with the US stock market indices , and one of the most important of them is the S&P 500 Index ( FOREXCOM:SPX500 ).
Today, I published the following analysis for the S&P 500 Index , which I used as a result of that analysis for Bitcoin .
Bitcoin is trading near the Resistance zone($81,610-$79,800) , the Yearly Pivot Point , the Daily Pivot Point , the important uptrend line (broken) , and the Cumulative Short Liquidation Leverage($81,500-$79,677).
Overall, it seems that this uptrend in Bitcoin over the past few hours was a pullback to the broken Important uptrend line and the liquidation of short position s. Do you agree with me?
In terms of Elliott Wave theory , it seems that the uptrend of the last few hours has been in the form of a Zigzag Correction(ABC/5-3-5) and we should expect another decline .
Based on the above explanation , I expect Bitcoin to resume its downtrend and approach the Potential Reversal Zone(PRZ) again ( after breaking the support lines ).
Cumulative Long Liquidation Leverage: $74,520-$73,244
If you want to see my overall view of Bitcoin on the weekly timeframe and further understand the significance of the Uptrend line(broken) , you can refer to the following idea:
Note: If Bitcoin can completely fill the CME Gap($84,475-$81,450), we should expect further increases.
Please respect each other's ideas and express them politely if you agree or disagree.
Bitcoin Analyze (BTCUSDT), 15-minute time frame.
Be sure to follow the updated ideas.
Do not forget to put a Stop loss for your positions (For every position you want to open).
Please follow your strategy and updates; this is just my Idea, and I will gladly see your ideas in this post.
Please do not forget the ✅' like '✅ button 🙏😊 & Share it with your friends; thanks, and Trade safe.

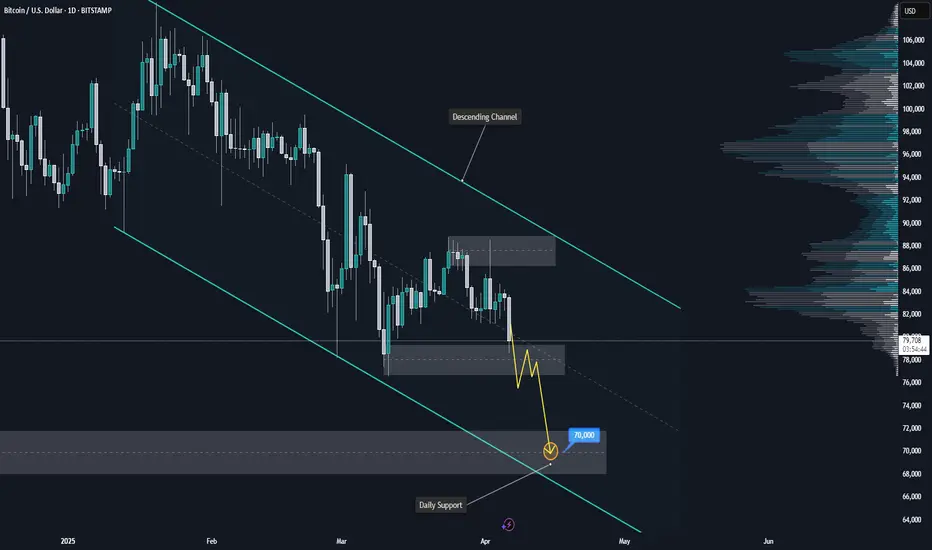
BITCOIN Downtrend Continues – Is $70K the Next Stop?COINBASE:BTCUSD continues to trade within a well-defined descending channel, maintaining a clear bearish market structure on the daily timeframe. After a strong rejection from the upper boundary of the channel, the price has retraced to a minor support zone around $78,000.
Given the prevailing momentum and strength of the broader downtrend, this support is likely to break under continued selling pressure. A clean breakdown below this level would reinforce the bearish bias and open the door for a move toward the daily support zone near $70,000, which aligns with the lower boundary of the channel.
This zone marks a potential area of interest where price may react or attempt a short-term bounce. However, unless there is a significant shift in momentum, the path of least resistance remains to the downside.
Traders should watch for confirmation of the bearish continuation, such as lower highs, weak bullish pullbacks, or increased volume on red candles, before considering short entries.
If you align with this outlook or have additional perspectives, feel free to share your thoughts below.
Bitcoin will be super bullish soon (1D)The market maker has created a scenario that makes everyone believe the bear market started a while ago. However, there are signs on the chart showing that Bitcoin may register a new ATH.
The best zone for rebuying Bitcoin is the green area.
From the green zone, we expect Bitcoin to move toward the specified targets.
The closure of a daily candle below the invalidation level will invalidate this analysis.
Do not enter the position without capital management and stop setting
Comment if you have any questions
thank you

Bearish Bitcoin Faces Key ResistanceFenzoFx—Bitcoin trades bearishly below the critical resistance level of $81,160. If the price remains below this level, the downtrend will likely resume, targeting $74,000.

BTCUSD TECHNICALS & FUNDAMENTALSKey Technical Details:
Support: Price is resting on the lower trendline of the channel and right above a potential breakout level.
Resistance: The upper channel line sits around $85,000, which aligns with the previous rejection zone.
Bullish Scenario: If BTC bounces off this level and breaks above the short-term resistance, expect a potential move toward $85K and beyond.
Bearish Scenario: A clean breakdown below the trendline could take BTC back to $77,000–$75,000.
Volume Note: There's a notable decrease in volume, indicating indecision—often a sign of a potential breakout soon.
💡 Bias:
Currently neutral to bullish as long as BTC stays within the channel.
📰 Fundamental Analysis (April 8, 2025)
🧨 What’s Moving the Markets Today:
Fallout from April 7’s Inflation Print:
The U.S. CPI data came in hotter than expected, rekindling fears of delayed Fed rate cuts.
This led to panic selling across equities, forex, and crypto on April 7. BTC dropped sharply in reaction.
🌍 Today’s Probabilities:
Macro Uncertainty Continues:
With the inflation shock still rippling, risk-on assets like Bitcoin are in a sensitive zone.
Traders await Fed speakers and FOMC minutes later this week for further cues.
🏦 Institutional Sentiment:
Cautiously Bullish: Institutions aren’t exiting yet, but are being very selective.
BTC’s long-term structure remains strong unless it breaks down from the channel.
✅ Summary:
BTC is consolidating after a post-CPI dump.
A bounce here could send it toward $85K, but a breakdown risks retesting $75K.
Fundamentally, macro pressure remains, so any bullish breakout must be backed by a shift in market sentiment.

Critical zone for Bitcoin – Pump or Dump!(Mid-term Analysis)Today, I want to analyze Bitcoin ( BINANCE:BTCUSDT ) on a weekly time frame so that you can take a mid-term view of BTC. On November 12, 2024 , I shared with you another weekly analysis in which we found the All-Time High(ATH) zone well.
Please stay with me.
Bitcoin has been on an upward trend for the past 27 months , increasing by about +600% . Have you been able to profit from this upward trend in Bitcoin?
During these 27 months , Bitcoin has had two significant corrections , the first correction -20% and the second correction -33% (interestingly, both corrections lasted about 5 months ).
Another thing we can understand from the two main corrections is that the second correction is bigger than the first correction , and since Bitcoin is currently in the third correction , we can expect the third correction to be either equal to the second correction or greater than the second correction . Of course, this is just an analysis that should be placed alongside the analyses below .
It seems that the start of Bitcoin's correction can be confirmed with the help of the Adam & Adam Double Top Pattern(AADT) . Bitcoin also created a fake breakout above the Resistance lines .
Educational tip : The Adam & Adam Double Top (AADT) is a bearish reversal pattern characterized by two sharp, ^-shaped peaks at nearly the same price level. It indicates strong resistance and a potential trend reversal once the price breaks below the neckline between the peaks.
Bitcoin appears to be completing a pullback to the broken neckline .
According to Elliott's Wave theory , Bitcoin seems to have completed its 5 impulse waves , and we should wait for corrective waves . It is a bit early to determine the structure of the corrective waves , but I think it will have a Zigzag Correction . The structure of the corrective waves depends on the news and events of the coming weeks and months.
I think the Potential Reversal Zone(PRZ) will be a very sensitive zone for Bitcoin.
I expect Bitcoin to start correcting again when it approaches $87,000 or $90,000 at most, and fills the CME Gap($86,400_$85,595) , and at least approaches the Heavy Support zone($73,800_$59,000) AFTER breaking the uptrend line .
In your opinion, has Bitcoin finished its correction or created an opportunity for us to escape again?
Note: If Bitcoin goes above $90,500, we should expect further increases and even make a new All-Time High(ATH).
Please respect each other's ideas and express them politely if you agree or disagree.
Bitcoin Analyze (BTCUSDT), Weekly time frame.
Be sure to follow the updated ideas.
Do not forget to put a Stop loss for your positions (For every position you want to open).
Please follow your strategy and updates; this is just my Idea, and I will gladly see your ideas in this post.
Please do not forget the ✅' like '✅ button 🙏😊 & Share it with your friends; thanks, and Trade safe.

Bitcoin's Symmetrical Triangle – a short trade possible here!Bitcoin is currently forming a symmetrical triangle on the 15-minute chart, with a falling resistance trendline and a rising support trendline. This setup is a classic indication of consolidation, and the price is likely to move for downside soon as it is reversing from upper band now. If Bitcoin manages to break above 83,737, we could see a breakout of this symmetrical triangle, On the flip side, if it breaks below the rising support, 82,313 could breakdown for downside and we can see further downside then, but now we are playing inside the symmetrical triangle only and we will try to book profit once price reaches lower band of the symmetrical triangle pattern.
Disclaimer: This analysis is for educational purposes only. Please consult a financial advisor before making investment decisions.
If you Found this helpful? Don’t forget to like, share, and drop your thoughts in the comments below.
