Daily BITCOIN Bull Bear candles showing return of the Bulls ?I have used this chart often and have posted it here on a number of occasions with out the Bull Power Bear Power Histogram by CEYHUN active.
This is how the chart Looks when it is active.
This indicator calculates trading action to determine if a Candle is Bullish or Bearish and is VERY ACCURATE
And, Currently, Today's candle is GREEN, for the first time in a LONG TIME.
We can see how the candles have remained RED for most of the Drop in channel.
But now, while we sit on support on a Fib Speed Resistance Fan, we are GREEN.
Long Term, we can see that the climb back to current ATH could be tough. The VRVP on the right is clearly showing rising levels of resistance we climb higher.
Currently, we need to watch closely, to see that candle remain Green and that we do not loose support here.
I feel Bullish
Bitcoinmarkets

Levels to watch for potential scalps! Key BTC Levels Breakdown:
88,752: Major resistance - previous rejection + monthly close below
86,033: High volume node + multiple rejections last week
84,903: Key pivot point - flips between support/resistance frequently
82,927: Current consolidation zone - high volume trading area
81,955: Strong support - multiple bounces + volume profile support
79,976: Critical support - monthly support + high volume node
Trading these:
Shorts: Look for rejections at 86k/88.7k with volume
Longs: Clean bounces off 81.9k/79.9k with volume
Chop zone: 82-84k = scalp territory
Keep in mind:
Wait for confirmation
Volume tells the story
Don't trade between levels
Clean breaks = better trades

Navigating BTC Volatility Storm: Buy, Hold, or Flee?Bitcoin's recent price action has been reminiscent of a rollercoaster, leaving investors grappling with a whirlwind of conflicting signals. From sharp drops mirroring stock market turmoil to the looming "death cross," the cryptocurrency's trajectory is shrouded in uncertainty. Is this a prime buying opportunity, a warning to retreat, or simply another bout of the volatility that defines Bitcoin?
The past few days have been a stark reminder of Bitcoin's inherent volatility. Reports of an 8% drop, coupled with the US stock market shedding $2 trillion in value, sent ripples through the crypto sphere. The catalyst? Concerns surrounding potential US tariffs and their impact on the global economic outlook. This sudden shift in market sentiment triggered a sell-off, reminiscent of the COVID-19 crash in 2020, during which Bitcoin’s pre-pandemic gains evaporated.
Adding to the unease is the looming "death cross," a technical indicator that occurs when the 50-day moving average crosses below the 200-day moving average. Historically, this pattern has signaled bearish momentum. The 2022 death cross, for example, precipitated a significant price drop of nearly 20%. Conversely, "golden crosses," where the 50-day moving average crosses above the 200-day moving average, have historically signaled bullish momentum, triggering rallies of over 500% in 2020 and 2021.
Currently, Bitcoin's 50-day moving average is edging closer to this critical crossover, prompting widespread speculation. Is this a repeat of 2022, or will the market defy historical patterns? The answer, as always, is complex and contingent on a confluence of factors.
One significant factor is the strength of the US dollar. While the dollar's strength can often negatively impact Bitcoin, the current increase in the money supply could potentially counteract this effect, creating a bullish flag pattern. The dollar's inflation may become a catalyst for Bitcoin as a store of value. The global market dynamics are currently shrouded in uncertainty, making it difficult to predict the long-term impact of these factors.
The recent price drops have pushed Bitcoin towards the $80,000 mark, with some analysts predicting a potential fall to $71,000. However, this level could also represent a "sizeable bounce," acting as a strong support zone for Bitcoin. The concept of an "oversold bounce" also comes into play. After a period of intense selling pressure, markets often experience a relief rally as traders capitalize on discounted prices. Whether this materializes remains to be seen.
Is it a Good Time to Buy Bitcoin?
The decision to buy, hold, or sell Bitcoin depends on an individual's risk tolerance, investment strategy, and understanding of the market. Here's a breakdown to consider:
• For the Long-Term Investor:
o Bitcoin's long-term potential remains a compelling narrative. Its decentralized nature, limited supply, and growing adoption continue to attract institutional and retail investors.
o Price volatility is an inherent part of the Bitcoin journey. Historically, periods of sharp declines have been followed by significant rallies.
o Dollar-cost averaging (DCA) can mitigate the impact of volatility by investing a fixed amount at regular intervals, regardless of the price.1
o The strength of the US dollar may become a catalyst for Bitcoin as a store of value.
• For the Short-Term Trader:
o The current volatility presents opportunities for skilled traders to profit from price swings.
o Technical analysis, including monitoring moving averages and support/resistance levels, is crucial for identifying potential entry and exit points.
o However, short-term trading is inherently risky and requires a deep understanding of market dynamics.
o The "death cross" should be monitored carefully.
• For the Cautious Investor:
o The current market uncertainty may warrant a more conservative approach.
o Diversifying investments across different asset classes can help mitigate risk.
o Staying informed about market developments and avoiding emotional trading decisions is essential.
The Death Cross: A Warning or a False Alarm?
The "death cross" is a significant technical indicator, but it's not a foolproof predictor of future price action. Historical data show that while it can signal bearish trends, it's not always accurate. Market conditions, investor sentiment, and macroeconomic factors can all influence Bitcoin's trajectory.
Ultimately, the Bitcoin market remains highly speculative. The current volatility, driven by a confluence of factors, underscores the importance of careful research, risk management, and a long-term perspective. While the "death cross" and market fluctuations may cause short-term panic, the long-term potential of bitcoin, and it's reaction to the weakening dollar, may still produce long-term gains.

BTC/USDT Analysis: Expected DumpYesterday, Bitcoin tested the key sell zone at $86,000–$87,200.
Later that evening, D. Trump made statements regarding mutual trade tariffs on imported goods. Initially, he announced a 10% base tariff for all countries, which was perceived positively, pushing Bitcoin up to $88,000. However, shortly after, tariffs of 34% for China and 20% for the EU were introduced, causing the market to plummet sharply.
As a result, the $86,000–$87,200 sell zone has been validated, but with a short squeeze.
At the moment, we have dropped to the local buyer zone of $83,800–$82,800, where significant volumes have already accumulated.
Currently, the primary scenario favors further downside movement. If this plays out, we will form a new volume-based sell zone at $82,500–$83,800, which should be considered for re-entry upon a retest.
Sell Zones:
$82,500–$83,800 (volume zone)
$85,600–$88,000 (absorption of buyer aggression)
$95,000–$96,700 (accumulated volumes)
$97,500–$98,400 (pushing volumes)
$107,000–$109,000 (volume anomalies)
Buy Zones:
$77,000–$73,000 (volume anomalies, pushing volumes)

BITCOIN Update: What We Can Expect Next???According to current price action we can expect 3 scenarios:
Scenario 1: BTC is currently at it mid range resistance. If it breaks above this resistance then we may probably see price approaching range high and even beyond.
Scenario 2: If it fails to break and rejects, then most probably we can expect reversal from range low demand zone, which aligns with cypher harmonic pattern's PRZ.
Scenario 3: In worst case, we may see BTC dumping upto 74-70K region, and from there we will most probably see trend reversal.
Most crucial level to watch in all scenarios is 95k region, if it breaks successfully above it, then we will see BTC slamming new ATH.

Bitcoin Daily HEADS UP - Nice start to Week But RESISTANCE NOW
The daily chart shows the line of resistance we now hit
This is the line that has rejected PA since january
It is Strong.
We May break through but we have to wait and see but it is certainly Wise to be prepared for rejection
Even more so when you look at the Apex we are coming to with in the next 7 days
PA ALWAYS REACTS BEFORE THE APEX
The Volume profile on the right suggests resistance overhead is strong but we do sit above the POC ( point of control )
All to play for this week and it coulf get emotional
And YES, that is a Fib circle we are hitting too
Double resistance could lead to a Drop in the near future and yet, it is also worth knowing that PA can pick an intersection of two lines of resistance to break through. Kind of 2 birds with one stone attitude.
We need to wait and see
What ever happens, I feel this week may be VERY interesting.
Enjoy

Bitcoin's Rocky Quarter: Tariffs, Whales, and Volatility Loom
Bitcoin's first quarter of 2025 has concluded with a whimper, marking its worst Q1 performance since the tumultuous bear market of 2018.1 While gold has surged to record highs, fueled by geopolitical tensions and US trade tariffs, Bitcoin has struggled to maintain momentum, leaving traders bracing for potential further volatility. This week’s preview reveals a confluence of factors that could significantly impact Bitcoin's price trajectory.
A Disappointing First Quarter
The initial months of 2025 were anticipated to be a period of growth for Bitcoin, particularly with the anticipation surrounding the halving event. However, the cryptocurrency failed to deliver on these expectations. Instead, it experienced a period of stagnation and even decline, contrasting sharply with the robust performance of traditional safe-haven assets like gold.
Several factors contributed to this underwhelming performance. The escalating trade tensions, particularly the US tariffs, have injected uncertainty into global markets, diverting capital towards established safe-haven assets.
Tariffs and Trade Tensions: A Persistent Headwind
The US imposition of trade tariffs has emerged as a significant headwind for Bitcoin. These tariffs, designed to protect domestic industries, have disrupted global trade flows and created a climate of economic uncertainty.2 Investors, wary of potential market disruptions, have sought refuge in traditional safe-haven assets like gold, which has historically outperformed during periods of economic instability.
The impact of these tariffs extends beyond immediate market reactions. They signal a potential shift towards protectionist policies, which could have long-term implications for global trade and investment flows. Bitcoin, often touted as a decentralized and borderless asset, is particularly vulnerable to disruptions in global trade and capital flows.
Whale Activity and Market Manipulation
Adding to the complexity of the market is the activity of large Bitcoin holders, often referred to as "whales."3 These entities, possessing significant amounts of Bitcoin, can exert considerable influence on market prices through large buy or sell orders. Recent observations suggest increased whale activity, potentially contributing to the volatility and price fluctuations.
Concerns about market manipulation have also resurfaced. The decentralized nature of Bitcoin, while a core strength, also presents challenges in terms of regulation and oversight. This lack of centralized control can create opportunities for manipulation, leading to price swings that are not necessarily reflective of fundamental market dynamics.
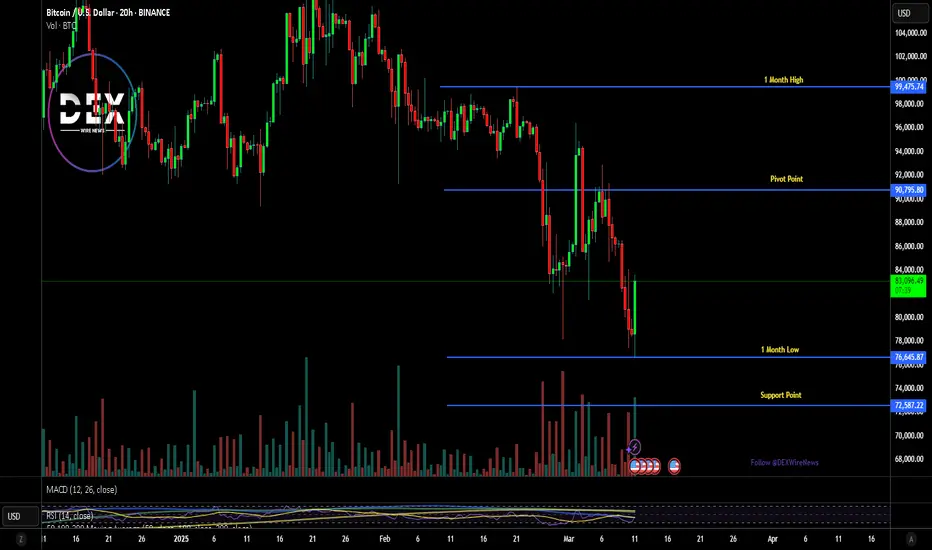
Bitcoin Bears Tighten Grip: Where’s the Next Support?
The recent price action indicates that Bitcoin bears are tightening their grip. The failure to sustain upward momentum has emboldened sellers, leading to a downward trend. Traders are now closely monitoring key support levels, anticipating potential further declines.
Identifying these support levels is crucial for understanding the potential trajectory of Bitcoin's price. Technical analysis, using tools like Fibonacci retracement levels and moving averages, can help traders identify potential areas of support where buying pressure may emerge. However, the volatile nature of Bitcoin makes it challenging to predict these levels with certainty.
Gold vs. Bitcoin: A Comparative Analysis
The stark contrast between gold's recent performance and Bitcoin's struggles has reignited the debate about their respective roles as safe-haven assets. Gold, with its long history and established reputation, has benefited from the current climate of uncertainty.
However, Bitcoin proponents argue that its decentralized nature and limited supply make it a superior store of value in the long term. The comparison between the two assets highlights the evolving nature of safe-haven assets and the growing acceptance of digital currencies. The quote "Gold has taken 26 years to 10X. Bitcoin has taken 4 years to 10X" shows the potential for rapid growth, but also its volatility.
Looking Ahead: Volatility and Uncertainty
The coming week promises to be a period of significant volatility for Bitcoin. Traders should brace for potential price swings, driven by a combination of factors, including:
• Continued Trade Tensions: The ongoing trade disputes and potential for further tariffs are likely to continue to impact market sentiment.
• Whale Activity: Large buy or sell orders from whales could trigger significant price fluctuations.
• Regulatory Developments: Any regulatory announcements or policy changes could have a substantial impact on Bitcoin's price.
• Macroeconomic Factors: Inflation data, interest rate decisions, and other macroeconomic indicators will continue to influence investor behavior.
•
In conclusion, Bitcoin's disappointing first quarter has set the stage for a period of heightened volatility. The confluence of trade tensions, whale activity, and market manipulation creates a challenging environment for traders. While the long-term potential of Bitcoin remains a subject of debate, the immediate future is marked by uncertainty and the need for caution.

Crypto liquidations drop 76% as Bitcoin $BTC stabilizes aboveCrypto liquidations plummeted by 76% in the second half of March as Bitcoin BTC CRYPTOCAP:BTC consolidated around $87,000 after earlier volatility. From March 12 to March 25, Bitcoin's price moved within a narrower range, starting at $82,857 and closing at $87,330.
Earlier in March, Bitcoin BTC CRYPTOCAP:BTC saw sharp price movements, dropping below $79,000 before rebounding, coinciding with a spike in long liquidations. The recent decline in liquidations signals more stable market participation and reduced leverage risk.
Between March 12 and March 25, long liquidations totaled $1.26 billion, while short liquidations reached $1.14 billion, down from 7$7.2 billion in long and $2.8 billion in short liquidations from February 24 to March 12.

BTC IMF Tracking, Liquidation Frenzy, and Market PredictionsBitcoin's recent price action has been a rollercoaster, marked by significant gains, dramatic liquidations, and a confluence of macroeconomic factors that are shaping its trajectory. From the International Monetary Fund (IMF) officially tracking Bitcoin in cross-border finance to speculative predictions of a potential $87,000 surge, the cryptocurrency remains a focal point of intense market scrutiny.
One of the most noteworthy developments is the IMF's increasing recognition of Bitcoin's role in global finance. While the IMF previously issued warnings to El Salvador regarding its Bitcoin adoption, its decision to now track Bitcoin in cross-border financial flows signals a tacit acknowledgment of the cryptocurrency's growing significance. This shift reflects a broader trend of institutions grappling with the reality of digital assets, forcing them to incorporate these assets into their analytical frameworks.
Simultaneously, the Bitcoin market has witnessed a surge towards the $87,000 mark, triggering a wave of short liquidations. This phenomenon occurs when traders who have bet against Bitcoin's price are forced to close their positions at a loss as the price rises. The sheer magnitude of these liquidations, exceeding $110 million in a short period, underscores the volatility and the inherent risks associated with leveraged trading in the cryptocurrency market. The total market liquidations surpassing $200,000 in 24 hours only highlights the dramatic price swings and the vulnerability of short positions.
Adding to the complexity of the market dynamics is the emergence of another CME gap in the $84,000–$85,000 range. Historically, these gaps, which represent discrepancies between trading prices on the Chicago Mercantile Exchange (CME) and other exchanges, tend to be filled, suggesting a potential pullback in Bitcoin's price. This pattern creates a sense of uncertainty, with traders weighing the potential for further gains against the possibility of a corrective downturn.
Furthermore, the surge in Bitcoin open future bets on Binance, with an increase of $600 million, indicates heightened price volatility. Open interest, which measures the total number of outstanding futures contracts, often correlates with price movements. A rise in open interest alongside a price increase typically confirms an uptrend, but it also signals the potential for sharp price swings as more capital enters the market.
Market analysts are divided on Bitcoin's future trajectory. Some predict a "brutal bleed lower," while others foresee a break towards new all-time highs in the second quarter. The critical level to watch is $93,000. If Bitcoin can reclaim this level as support, it would significantly reduce the risk of a fresh collapse. However, until this threshold is breached, the market remains vulnerable to downward pressure.
On a more positive note, the S&P 500's reclamation of its 200-day moving average provides a potential tailwind for Bitcoin. This technical breakout in equities, coupled with similar signals in the cryptocurrency market, could indicate renewed bullish momentum. The correlation between traditional financial markets and Bitcoin has become increasingly apparent, with positive developments in equities often translating to positive sentiment in the crypto space.
Adding another layer to the narrative is the potential softening of the stance on reciprocal tariffs by Donald Trump. Some analysts see this development as a potential catalyst for a Bitcoin bottom. Any relaxation of trade tensions could boost investor confidence and create a more favorable environment for risk assets, including cryptocurrencies.
Finally, the concept of tokenized US gold reserves, as proposed by NYDIG, presents an intriguing long-term prospect for Bitcoin. While gold and Bitcoin are fundamentally different assets, the tokenization of gold on a blockchain could enhance the overall legitimacy and infrastructure of digital assets. This increased institutional acceptance could indirectly benefit Bitcoin by further integrating blockchain technology into mainstream finance.
In conclusion, Bitcoin's current market landscape is characterized by a blend of institutional recognition, intense trading activity, and speculative predictions. The IMF's tracking of Bitcoin in cross-border finance underscores its growing relevance, while the liquidation frenzy and CME gap highlight the inherent volatility of the cryptocurrency market. The interplay of macroeconomic factors, technical indicators, and speculative sentiment will continue to shape Bitcoin's trajectory, making it a fascinating asset to watch in the coming months.

JUST IN: Bitcoin Reclaims $88K, Eyes $100K Breakout!The Price of Bitcoin shocked sceptics surging nearly 4% today, reclaiming the FWB:88K pivot- now setting its coast for $100k breakout amidst a bullish symmetrical triangle Pattern.
On the daily time frame, CRYPTOCAP:BTC has formed 2 bullish candlesticks, should a third identical candlestick evolve, it will lead to a breakout of the ceiling of the symmetrical triangle formed- placing CRYPTOCAP:BTC in the $90,000 - $96,000 range. A break above this pivots would cement the the move to $100k and beyond.
Similarly, should the asset faced selling pressure into making it dip below the $81k range, a selling spree could emerged.
Bitcoin Price Live Data
The live Bitcoin price today is $88,452.78 USD with a 24-hour trading volume of $29,835,452,540 USD. Bitcoin is up 3.95% in the last 24 hours, with a live market cap of $1,755,025,651,822 USD. It has a circulating supply of 19,841,384 BTC coins and a max. supply of 21,000,000 BTC coins.

BTC Whales Stir, Trump's Crypto Push, and the Path to $85,000
Bitcoin's recent price action has ignited a renewed sense of optimism within the crypto community. A confluence of factors, ranging from whale activity and political pronouncements to macroeconomic indicators and regulatory developments, is shaping the current market narrative.
Whale Activity: A Harbinger of Bullish Momentum?
The resurgence of Bitcoin whale activity is a significant indicator that has captured the attention of traders and analysts. Large-scale Bitcoin holders, often referred to as "whales," possess the capacity to significantly influence market dynamics.1 Their accumulation of Bitcoin can signal strong conviction and potentially trigger broader market rallies. The recent uptick in whale activity suggests a renewed interest in Bitcoin among these major players, potentially laying the foundation for a sustained upward trend. This can be viewed as the building of a strong base of long positions.
Political Winds: Trump's Crypto Pronouncements and Market Sentiment
Political discourse has increasingly intersected with the cryptocurrency market, with recent statements from a prominent political figure influencing market sentiment. Rhetoric emphasizing the United States as a "Bitcoin superpower" has undeniably contributed to bullish momentum. This political articulation of a crypto-friendly approach signals potential policy shifts and improved regulatory clarity, both crucial factors in attracting institutional investment. Market participants are interpreting this as a sign of acceptance, if not outright endorsement, of digital assets at the highest levels.
It is worth noting that consistent pronouncements regarding the US becoming the "crypto capital of the world," while driving short term volatility, need to be followed with legislative action for long term impact.
Macroeconomic Factors: Fed Policies and Inflationary Concerns
The Federal Reserve's monetary policy and the evolving narrative surrounding inflation play a pivotal role in shaping Bitcoin's trajectory. Recent indications from the Fed regarding continued rate cuts, despite persistent inflationary pressures, have boosted investor confidence. This stance, coupled with Powell's assessment of certain inflationary factors, such as tariffs, as "transitory," has provided much-needed relief to risk assets, including Bitcoin. This monetary policy creates a favorable environment for investment. The combination of Fed policy confirmation and rumors of "significant updates" to US crypto plans have driven Bitcoin to new two-week highs.
Technical Analysis: The $85,000 Threshold and Beyond
From a technical perspective, Bitcoin's ability to reclaim the $85,000 level is considered a crucial milestone. Surpassing this threshold would validate the current bullish momentum and potentially pave the way for further gains. Analysts are closely monitoring key support and resistance levels to gauge the strength of the ongoing rally. The return of significant volume combined with the price retaking old highs lends to an increasingly bullish sentiment.
BlackRock's prediction of a price shift ahead indicates a growing acceptance of Bitcoin as a mainstream asset, potentially aligning it with traditional Wall Street investments.2 These kinds of comments indicate an institutional bullish long-term perspective.
Regulatory Clarity: Ripple's Resolution and Its Impact on Bitcoin
The resolution of Ripple's legal battle with the SEC has sent ripples (pun intended) throughout the cryptocurrency market. This development has provided much-needed regulatory clarity, bolstering investor confidence and fostering a more favorable environment for digital assets. The jump in XRP's price after confirmation of the case coming to an end further exemplifies the markets sensitivity to regulatory action. This resolution will influence Bitcoin’s adoption rates, as investors now know the US regulatory stance may be moderating.
Options Market Sentiment: A Shift Towards Bullishness
The Bitcoin options market has exhibited a noticeable shift towards bullishness, particularly after Powell's "transitory inflation" remarks. This sentiment reflects increased optimism among traders and investors, potentially signaling a sustained uptrend. An increased amount of bullish options being written displays further faith in the rise of Bitcoin’s price.
Bitcoin's Volatility: Navigating the Uncertainty
Despite the positive developments, Bitcoin remains inherently volatile. Price swings, driven by a combination of market sentiment, news events, and technical factors, are to be expected. Investors should remain vigilant and exercise prudent risk management strategies. While large volume and long term political promises are strong positive indicators, there are still volatile short term swings to consider.
Looking Ahead: The Potential for a Sustained Rally
The convergence of positive catalysts, including whale activity, political support, macroeconomic factors, and regulatory clarity, paints a potentially bullish picture for Bitcoin. However, the cryptocurrency market is subject to rapid shifts, and unforeseen events can significantly impact price movements.
To conclude, the present environment is ripe for sustained Bitcoin price discovery. The political and macroeconomic climates are aligning, coupled with increased whale activity and regulatory clarity. While markets will remain volatile, the trend is looking increasingly bullish.

BTCUSDT - Forecast for Today!My general opinion is that we will go back and forth in the intermediate zones until interest rate decision is announced and I'm bearish for now due to CDV. I have indicated the possible manipulations in these intermediate zones in the drawings on the chart.
Starting from the 4-hour point of control zone(indicated in the chart), I will start looking for short trends downwards and as usual, I will enter with confirmations in the low time frame.
I have a long list of my proven technique below:
🤖 IQUSDT: Smart Plan
🟠 IDEXUSDT: Spot Buy Area | %26 Profit if You Trade with MSB
📌 USUALUSDT: Buyers Are Active + %70 Profit in Total
🌟 FORTHUSDT: Sniper Entry +%26 Reaction
🐳 QKCUSDT: Sniper Entry +%57 Reaction

Bitcoin Clears October 2024 FVG! What’s Next?BTC has successfully cleared the Fair Value Gap (FVG) from October 2024. The range has been tested, and we are now witnessing some sideways movement in lower time frames (LTF).
The $93.2K level remains the most critical resistance for now. Historically, Bitcoin has seen 29% to 32% corrections right before the final wave. It's also important to note that the 50EMA on the weekly chart has repeatedly acted as a strong support, preventing major breakdowns in the past.
I will be posting a detailed analysis on Bitcoin corrections this week. So far, we've already seen signs of this playing out. BTC must start reversing from here, or we could see one more push to the $70K range, forming a double or triple bottom before the final breakout.
This is not the time to be bearish, news cycles and geopolitical events can shift dramatically in the coming weeks or months. We've seen this pattern many times before, haven't we?
Stay prepared for what’s coming! I’ll also be sharing altcoin charts that could perform well in the upcoming months.
👉 If you found this analysis valuable, hit that Like button and make sure to follow me for more insights!
#PEACE

$84K BTC Battle, ETF Resilience, and Macroeconomic ShadowsBitcoin's journey remains a captivating saga of volatility, resilience, and the interplay of technical indicators and macroeconomic forces. Recently, the cryptocurrency surged past $84,000, reigniting bullish sentiment, but faces a critical test at a key resistance level.1 This surge, fueled by a broader rebound in risk assets, pushed BTC above its 200-day moving average, a pivotal benchmark for assessing long-term trends. However, this bullish momentum is juxtaposed with significant selling pressure, ETF outflows, and lingering concerns about regulatory and macroeconomic landscapes.
The 200-Day Moving Average: A Battleground for Bulls
The 200-day moving average is a widely recognized technical indicator that provides insight into the long-term trend of an asset. For Bitcoin, consistently closing above this level signifies a potential shift from bearish to bullish momentum. The recent breach is a positive sign for bulls, indicating renewed confidence and potentially attracting further investment. However, a sustained close above this level is crucial to solidify the bullish outlook.
The importance of this level is highlighted by the narrative that a weekly close above this average would confirm a market bottom. This emphasizes the significance of longer timeframes in validating trends in the highly volatile cryptocurrency market.
$86K or $65+K: A Price at a Crossroads
Bitcoin's price currently finds itself at a critical juncture. The immediate challenge is breaching the $86,000 resistance level. A successful breakout could pave the way for further gains, potentially pushing Bitcoin towards new all-time highs. Conversely, failure to overcome this resistance could lead to a pullback towards the $65,000 support level. This range represents a crucial battleground for bulls and bears, with the outcome likely to determine the short-term trajectory of Bitcoin's price.
MVRV Ratio: A Potential Reversal Indicator
The Market Value to Realized Value (MVRV) ratio is another key metric that investors closely monitor. It compares Bitcoin's market capitalization to its realized capitalization, providing insights into potential overbought or oversold conditions. A high MVRV ratio suggests that Bitcoin is overvalued and prone to a correction, while a low ratio indicates undervaluation and potential for a rebound. The MVRV ratio nearing a key level suggests that a major reversal could be imminent, adding another layer of complexity to Bitcoin's current price action.
ETF Resilience Amidst Volatility
Despite a 25% price drop, Bitcoin ETF investors have maintained a relatively strong stance. This resilience is reflected in the collective $115 billion in assets under management by US Bitcoin ETFs. This demonstrates the growing institutional adoption of Bitcoin and the increasing acceptance of cryptocurrencies as a legitimate asset class. However, since mid-February, Bitcoin ETFs have witnessed total outflows of nearly $5 billion. This outflow points to a potential shift in investor sentiment, possibly driven by concerns about market volatility or macroeconomic uncertainties.
The strength of the ETF market is a double edged sword. While significant holdings demonstrate institutional buy in, large outflows can increase sell pressure on the underlying asset.
Selling Pressure and Macroeconomic Shadows
Bitcoin's recent decline is attributed to intensified selling pressure, reflecting a broader trend of risk aversion in the market. This selling pressure is exacerbated by concerns about the potential impact of digital currencies on traditional banking systems. Banks are increasingly weighing the implications of Bitcoin and other cryptocurrencies, leading to regulatory scrutiny and potential policy changes.
Furthermore, macroeconomic factors continue to weigh on investor sentiment. Concerns about inflation, interest rate hikes, and geopolitical tensions are contributing to market volatility and impacting the demand for risk assets, including Bitcoin.
Presidential Policy and Market Sentiment
A presidential policy aimed at creating a strategic Bitcoin reserve initially sparked optimism among investors. However, this initial enthusiasm waned, highlighting the complex interplay between policy announcements and market reactions. While such policies can signal government acceptance of cryptocurrencies, they may not always translate into immediate price appreciation.
The market's reaction suggests that investors are more focused on broader macroeconomic trends and regulatory clarity. The lack of sustained positive impact from the policy announcement underscores the importance of addressing fundamental concerns about Bitcoin's long-term viability and regulatory framework.
Navigating the Volatility
Bitcoin's current situation highlights the inherent volatility and unpredictable nature of the cryptocurrency market. Investors must remain vigilant and adapt to rapidly changing market conditions. The interplay of technical indicators, ETF flows, and macroeconomic factors creates a complex landscape that requires careful analysis and strategic decision-making.
In conclusion, Bitcoin's battle at $84K, coupled with the resilience of ETF investors and the shadow of macroeconomic uncertainties, paints a picture of a market at a critical juncture. The coming weeks will be crucial in determining whether Bitcoin can sustain its bullish momentum or succumb to renewed selling pressure. Understanding the interplay of these factors is essential for navigating the volatile world of cryptocurrency investing.

Bitcoin doing a retest ! As advised earlier,
BTC is doing a retest of its breakout. Once it reaches between 105-110k CAD, it will go up again. Add between these levels.
It has also adjusted the highly inflated RSI.

$BTC Price Showing Head and Shoulder Pattern On Chart, CPI DATACRYPTOCAP:BTC Price Showing Head and Shoulder Pattern On Chart, CPI DATA, $95K Soon as Possible?
Bitcoin high-entry buyers are driving sell pressure, price may ‘floor’ at $70K
Bitcoin's “top buyers” are selling heavily, with onchain analytics firm Glassnode calling it a “moderate capitulation event.”
Bitcoin buyers who purchased around when it hit a $109,000 all-time peak in January are now panic-selling as the cryptocurrency declines, says onchain analytics firm Glassnode, which isn’t ruling out that Bitcoin could slide to $70,000.
Glassnode said in a March 11 markets report that a recent sell-off by top buyers has driven “intense loss realization and a moderate capitulation event.”
Short-term holders fled as Bitcoin dropped from peak
The surge in buyers paying higher prices for Bitcoin
BTC $82,482 in recent months is reflected in the short-term holder realized price — the average purchase price for those holding Bitcoin for less than 155 days.
In October, the short-term realized price was $62,000. At the time of publication, it’s $91,362 — up about 47% in five months, according to Bitbo data.
Meanwhile, Bitcoin is trading at $81,930 at the time of publication, according to CoinMarketCap. This leaves the average short-term holder with an unrealized loss of roughly 10.6%.
Related: Bitcoin slides another 3% — Is BTC price headed for $69K next?
On the same day, BitMEX co-founder Arthur Hayes said that Bitcoin may retest the $78,000 price level and, if that fails, may head to $75,000 next.
Glassnode explained that a similar sell-off Bitcoin pattern was seen in August when Bitcoin fell from $68,000 to around $49,000 amid fears of a recession, poor employment data in the United States, and sluggish growth among leading tech stocks.
#BTC☀ #BinanceAlphaAlert #BinanceSquareFamily #Write2Earn #SUBROOFFICIAL
Disclaimer: This article is for informational purposes only and does not constitute financial advice. Always conduct your own research before making any investment decisions.

Breaking: Bitcoin Made a Comeback Surging 8%The world's first digital asset Bitcoin ( CRYPTOCAP:BTC ) shocked traders and investors alike as it surge 6% striking a comeback amidst the recent crypto bloodbath placing CRYPTOCAP:BTC in the FWB:83K zone with eyes set on the reclamation of the $100k Resistance.
Earlier on, we see Bitcoin retraced testing the $70k support point with many altcoins following suit. Should CRYPTOCAP:BTC break pass the $90k pivot point which is in lieu with the 38.2% Fibonacci point, a bullish campaign might evolved for CRYPTOCAP:BTC with odds set on the $120k zone.
Data from DefiLama shows industries and crypto projects are migrating to the Bitcoin blockchain network for scalability with about $5.414 Billion locked in Total Value Locked (TVL).
Bitcoin Price Live Data
The live Bitcoin price today is $83,341.47 USD with a 24-hour trading volume of $58,734,237,674 USD. Bitcoin is up 7.17% in the last 24 hours, with a live market cap of $1,653,114,998,100 USD. It has a circulating supply of 19,835,443 BTC coins and a max. supply of 21,000,000 BTC coins.
Dollar Decline Fuels Bitcoin Bull Case, Macro Signal CautionThe intricate relationship between the U.S. dollar and Bitcoin continues to be a focal point of analysis within the cryptocurrency market. While a weakening dollar can indeed bolster Bitcoin's bull case, a confluence of other metrics necessitates a cautious outlook. The dynamic interplay between these factors creates a complex and volatile environment for Bitcoin.
The Dollar's Decline and Bitcoin's Ascent:
• A weakening U.S. dollar often strengthens the appeal of alternative assets, including Bitcoin. This is because Bitcoin, perceived by some as a hedge against inflation and the devaluation of fiat currencies, becomes relatively more attractive when the dollar's purchasing power diminishes.
• This inverse correlation stems from Bitcoin's nature as a decentralized, limited-supply asset, contrasting with the potentially inflationary nature of fiat currencies.1 When investors lose confidence in the dollar, they may turn to Bitcoin as a store of value.
"High-Stakes Game of Chicken" with Central Banks:
• The phrase "Bitcoin playing a high-stakes game of chicken" with central banks aptly captures the ongoing tension between decentralized cryptocurrencies and traditional financial institutions.
• Central banks wield significant influence over monetary policy, and their decisions can have a profound impact on the value of fiat currencies and, consequently, on the cryptocurrency market.2
• The potential for regulatory crackdowns or the introduction of central bank digital currencies (CBDCs) poses a considerable risk to Bitcoin's long-term prospects.
• Conversely, if central banks where to greatly devalue their currencies, it would greatly boost the Bitcoin bull case.
Concerning Metrics and Cautious Outlook:
• Despite the potential benefits of a weakening dollar, other metrics warrant a cautious outlook.
• Market volatility remains a significant concern. Bitcoin's price fluctuations can be extreme, making it a risky investment for those with low risk tolerance.
• Regulatory uncertainty continues to cast a shadow over the cryptocurrency market. Governments worldwide are grappling with the challenge of regulating cryptocurrencies, and any adverse regulatory developments could trigger a sharp sell-off.
• Also, the overall global economic climate, with the potential for recessions, and geopolitical instability, add layers of uncertainty to the market.
• Investor sentiment is also a huge factor. While there are times of great excitement, and "Fear of missing out"(FOMO), there are also times of great fear, that can cause large sell offs.
Key Considerations:
• Macroeconomic Factors: The broader economic environment, including inflation, interest rates, and economic growth, plays a crucial role in shaping Bitcoin's price trajectory.
• Regulatory Landscape: The evolving regulatory landscape remains a key factor that could greatly effect Bitcoin's price.
• Investor Sentiment: The psychological factors that drive investor behavior, such as fear and greed, can have a significant impact on Bitcoin's price.
• Technological Developments: Advancements in blockchain technology and the adoption of cryptocurrencies by mainstream institutions could provide a boost to Bitcoin's long-term prospects.
In essence, while the weakening U.S. dollar may provide a favorable tailwind for Bitcoin, investors must remain vigilant and consider the multitude of other factors that could influence its price. The "high-stakes game of chicken" with central banks underscores the inherent uncertainty of the cryptocurrency market, and a cautious outlook is warranted.

Bitcoin's November Low: Recession Fears, and Volatility
Bitcoin's recent slump, dipping below $80,000 to levels not seen since November, has sent ripples through the cryptocurrency market. This downturn, fueled by heightened recession fears and a complex interplay of macroeconomic factors, has triggered a wave of analysis and speculation. While some experts predict further corrections, others point to potential catalysts for a resurgence. Amidst this uncertainty, South Korea's ambitious push for a Bitcoin reserve and the burgeoning $BTCBULL presale add intriguing layers to the narrative.
The primary driver behind Bitcoin's decline is the growing apprehension of a global economic recession. Persistent inflation, rising interest rates, and geopolitical tensions have created a climate of uncertainty, prompting investors to seek refuge in traditional safe-haven assets. This risk-off sentiment has weighed heavily on Bitcoin, a notoriously volatile asset class.
Adding to the complexity of the situation is the ongoing tension between Bitcoin and central banks. As one expert noted, Bitcoin is "playing chicken with central banks" as the dollar experiences fluctuations. This dynamic underscores the fundamental debate surrounding Bitcoin's role as a potential hedge against traditional financial systems. The recent volatility surge following Donald Trump's comments on a Bitcoin reserve and the options expiry further exemplifies this tense relationship.
Despite the bearish sentiment, there are glimmers of optimism. South Korea's ambitious plan to establish a Bitcoin reserve has captured the attention of the crypto community. This move, if realized, could signal a significant shift in the adoption of Bitcoin by institutional players and governments. The implications are far-reaching, potentially bolstering Bitcoin's legitimacy as a store of value and a strategic asset.
The $BTCBULL presale, emerging amidst this volatile landscape, presents an interesting case study. In a market characterized by uncertainty, presales offer investors the opportunity to gain early access to potentially high-growth projects. However, they also carry inherent risks, and their success depends on a multitude of factors, including market conditions, project fundamentals, and community support. The $BTCBULL presale’s ability to attract investors during this period of market downturn will be a good indicator of overall market sentiment. Should it succeed, it may indicate that despite the general bearishness, there is still strong interest in projects that are perceived to be innovative, or to offer a unique value proposition.
The current trading range of $78,000 to $82,000 reflects the market's indecision. Bullish momentum has clearly faded, leaving traders grappling with the implications of shifting macroeconomic conditions. The volatility witnessed in recent days underscores the need for caution and strategic decision-making.
Furthermore, the impact of regulatory developments cannot be ignored. Governments worldwide are grappling with the challenge of regulating cryptocurrencies, and any significant regulatory changes could have a profound impact on Bitcoin's price and adoption. The ongoing debate surrounding stablecoins, DeFi, and central bank digital currencies (CBDCs) adds another layer of complexity to the market.
In conclusion, Bitcoin's recent fall to November lows is a reflection of the broader economic uncertainties and the inherent volatility of the cryptocurrency market. While recession fears and bearish predictions dominate the headlines, South Korea's ambitious Bitcoin reserve plan and the $BTCBULL presale offer glimpses of potential future growth. Investors must navigate this complex landscape with caution, carefully considering the interplay of macroeconomic factors, regulatory developments, and market sentiment. The current volatility serves as a reminder of the need for thorough research and a long-term perspective. Whether Bitcoin retests lower support levels or stages a comeback remains to be seen, but one thing is certain: the cryptocurrency market will continue to be a dynamic and unpredictable space.

BTCUSDT Analysis – From Simple to Complex!BTCUSDT Analysis – From Simple to Complex! 🚀
“Let’s break it down step by step. At first glance, the first red line looks like an obvious resistance point. But here’s the deal—it’s too obvious. And in trading, when something is too obvious, it often doesn’t work as expected.”
Basic Structure:
📌 Red Line = Clear Resistance – Everyone sees it, but that also means it could be a trap.
Now, Let’s Get Deeper...
🔍 Volume Analysis Changes the Game:
Weekend Moves with Low Volume = High Manipulation Risk – Crypto loves to fake out retail traders in these conditions.
Look at the Black Line Inside the Blue Area – This is where things get interesting. This level could be the true battleground between buyers and sellers.
CDV & Volume Profile Will Guide Us – We need confirmation from buying and selling volumes before making any major moves.
Final Thoughts:
“At first, the chart looks simple, but once you add volume analysis, things get more complex. Don’t trade based on what looks obvious—trade based on what’s actually happening in the order flow. I’ll explain the next step in my following post!”
📉 Stay smart, stay ahead! 🔥
My approach is built on years of experience and a solid track record. I don’t claim to know it all, but I’m confident in my ability to spot high-probability setups.
If you would like to learn how to use the heatmap, cumulative volume delta and volume footprint techniques that I use below to determine very accurate demand regions, you can send me a private message. I help anyone who wants it completely free of charge.
I have a long list of my proven technique below:
AVAXUSDT Perfect Short Entry!
🎯 ZENUSDT.P: Patience & Profitability | %230 Reaction from the Sniper Entry
🐶 DOGEUSDT.P: Next Move
🎨 RENDERUSDT.P: Opportunity of the Month
💎 ETHUSDT.P: Where to Retrace
🟢 BNBUSDT.P: Potential Surge
📊 BTC Dominance: Reaction Zone
🌊 WAVESUSDT.P: Demand Zone Potential
🟣 UNIUSDT.P: Long-Term Trade
🔵 XRPUSDT.P: Entry Zones
🔗 LINKUSDT.P: Follow The River
📈 BTCUSDT.P: Two Key Demand Zones
🟩 POLUSDT: Bullish Momentum
🌟 PENDLEUSDT.P: Where Opportunity Meets Precision
🔥 BTCUSDT.P: Liquidation of Highly Leveraged Longs
🌊 SOLUSDT.P: SOL's Dip - Your Opportunity
🐸 1000PEPEUSDT.P: Prime Bounce Zone Unlocked
🚀 ETHUSDT.P: Set to Explode - Don't Miss This Game Changer
🤖 IQUSDT: Smart Plan
⚡️ PONDUSDT: A Trade Not Taken Is Better Than a Losing One
💼 STMXUSDT: 2 Buying Areas
🐢 TURBOUSDT: Buy Zones and Buyer Presence
🌍 ICPUSDT.P: Massive Upside Potential | Check the Trade Update For Seeing Results
🟠 IDEXUSDT: Spot Buy Area | %26 Profit if You Trade with MSB
📌 USUALUSDT: Buyers Are Active + %70 Profit in Total

Bitcoin - Has This Market Cycle Peaked?In this video, I give my observations on this current Bitcoin market cycle. Nothing earth shattering, just my observations of some of Bitcoin's price action since the bear market bottom in November 2022.
The big question on most people's mind right now is: Has Bitcoin peaked for this market cycle?
This is what I am trying to determine, as I am sure many others are as well.
While looking for possible end of market cycle patterns and reviewing longer term time frames, I found a pattern on the Stochastic RSI (which I mispronounced in the video!) 😂
Looking at the Stochastic RSI indicator on the monthly time frame, you can see that about two months after each market cycle peak the indicator drops below the 20 level. In all of Bitcoin's price history, there isn't one instance when the Stochastic indicator on the monthly time frame drops below 20 that the price of Bitcoin recovered to push to a higher market cycle peak. In every instance it cemented the previous peak as the market cycle peak. Even though the drop below the 20 level lags well behind the peak, I believe that it can be useful in determining if the cycle peak has been hit or if there is more bull market yet to come.

Bitcoin: Navigating Market Volatility and Future PredictionsBitcoin, the pioneering cryptocurrency, continues to dominate headlines with its characteristic volatility and the ever-present speculation surrounding its future trajectory. Recent market activity and expert analyses paint a complex picture, one where potential for significant growth is tempered by inherent risks and external economic factors. Several key themes emerge from recent news and analysis, offering a glimpse into the current state of Bitcoin and the factors influencing its price.
The Potential for a US Crypto Reserve and its Impact
One of the most significant potential catalysts for Bitcoin's price is the possibility of the United States government establishing a strategic cryptocurrency reserve. This concept, championed by figures like MicroStrategy founder Michael Saylor and gaining traction within political circles, could have a profound impact on the market.
Saylor has publicly suggested that the US government should acquire one million Bitcoin for its strategic reserves. He argues that this would legitimize Bitcoin as "digital property" and instill greater confidence in the cryptocurrency. Saylor pointed out that MicroStrategy already holds approximately 500,000 Bitcoins, which accounts for about 2.4% of the worldwide supply. He also suggested that the government could finance such a large crypto reserve through a deliberate, multi-year timeline, referencing a "six-month process" set out by a recent executive order.
There is research that supports this view, estimating that a US crypto reserve could boost Bitcoin's market capitalization by roughly 25%, or approximately $460 billion. This potential surge is attributed to Bitcoin's limited liquid supply, meaning that large inflows from a government purchase could trigger upward price shocks. Furthermore, such a move could incentivize institutional investors and other countries' governments to allocate funds to Bitcoin, creating a positive feedback loop.
While the idea has gained traction, particularly with endorsements from figures like Donald Trump, the path to establishing a national crypto reserve is not without its hurdles. Confusing messaging, legal challenges, and uneven progress across different states contribute to market uncertainty. The market currently views the probability of a national Bitcoin stockpile as relatively low due to challenges like confusing messaging and legal hurdles.
Market Sentiment and Price Predictions
Despite the potential for significant growth, market sentiment surrounding Bitcoin remains cautious. The Crypto Fear & Greed Index, a measure of overall market sentiment, consistently hovers in "Extreme Fear," even amidst price spikes. This suggests that while investors are drawn to potential gains, underlying anxieties about volatility and external economic pressures persist.
Predicting Bitcoin's price with certainty remains an elusive task, but analysts offer varying perspectives. Master Ananda, for example, believes that Bitcoin's price bottom is in, following a recent dip below $80,000.
However, other analysts urge caution. The recent rebound of Bitcoin to over $90,000 was short-lived, with the price retreating due to concerns about a potential recession, geopolitical tensions in Ukraine, and uncertainty surrounding the US crypto reserve. This highlights the sensitivity of Bitcoin to broader economic factors and geopolitical events.
Technical Analysis and Market Dynamics
Technical analysis of Bitcoin's price charts provides further insights into its current state. The recent formation of back-to-back weekly "hammer candles," a pattern seen only a handful of times in Bitcoin's history, suggests potential bullish momentum. However, the failure of a recent price rebound to break through key resistance levels indicates that the path to higher prices may not be straightforward.
The relationship between Bitcoin and traditional financial markets, particularly the S&P 500, also plays a crucial role. Historically, Bitcoin has struggled during periods of high volatility in the S&P 500, as measured by the VIX. This correlation suggests that broader economic anxieties can negatively impact Bitcoin's price.
The Influence of Global Liquidity and External Factors
Beyond specific events and technical indicators, broader macroeconomic factors influence Bitcoin's trajectory. Analyses suggest that global liquidity trends favor crypto and risk assets. The global money supply is expected to reach new all-time highs, potentially boosting Bitcoin's price. A dropping US Dollar Index (DXY) also signals a shift in favor of crypto.
The upcoming US Crypto Summit, organized by the Trump administration, is anticipated to be a key event that could provide clarity and potentially influence Bitcoin's future trajectory. Market participants are eagerly awaiting the summit's outcomes, as they could provide crucial insights into the regulatory landscape and government's stance on cryptocurrencies.
Conclusion
Bitcoin's current landscape is a complex interplay of potential catalysts, market sentiment, technical indicators, and macroeconomic forces. The possibility of a US crypto reserve offers a significant upside potential, but market anxieties and external economic pressures create a degree of uncertainty. While some analysts predict a rapid surge in price, others emphasize the need for caution and highlight the importance of monitoring broader market dynamics. As Bitcoin continues to evolve, its price will likely remain sensitive to both internal developments within the cryptocurrency ecosystem and external factors shaping the global economy. The upcoming US Crypto Summit and future policy decisions will be critical in shaping Bitcoin's future direction.

RIP Bitcoin Sell to 45K ?Bitcoin broke the weekly channel last week. I expect a decline to 45K
Stop loss: 97600
