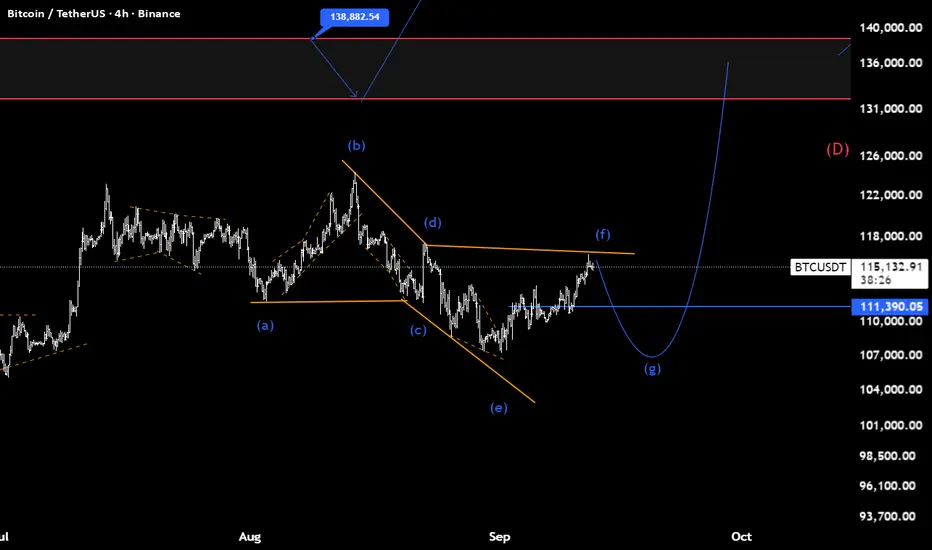
BTC(based on NEo wave)bitcoin is making a bow-tie diametric and finale wave is starting.
pay attention: do not buy bitcoin on this final correction,its a good time to buy altcoins like eth,doge,sol and others.
Bitcoinprice
BITCOIN PREDICTION: NEXT MASSIVE MOVE TO HERE - INCOMING!!!!!!!Yello Paradisers! In this video, we have been going through multi-time frame analysis as professional traders using Elliott Wave Theory and other advanced technical indicators and analysis techniques.
On the ultra-high time frame, we have been going through the Elliott Wave price section since 2023. We have taken a look at the Moving Average Trendline Touch, which worked perfectly, the Channel Retest that is incoming, and the Bearish Divergence with Bearish Cross.
On medium and high timeframe charts, I have been sharing with you the completed zigzag and first wave. We are currently in the secondary wave, waiting for it to finish, along with resistances and bullish and bearish divergences.Together with that, there are shooting star patterns, and on a low timeframe, I have been sharing with you the triple top reclaim and the next possible resistances, and what the next resistance and target are from a multiple timeframe perspective.
Paradisers! Keep in mind to trade only with a proper professional trading strategy. Wait for confirmations. Play with tactics. This is the only way you can be long-term profitable.
Remember, don’t trade without confirmations. Wait for them before creating a trade. Be disciplined, patient, and emotionally controlled. Only trade the highest probability setups with the greatest risk to reward ratio. This will ensure that you become a long-term profitable professional trader.
Don't be a gambler. Don't try to get rich quick. Make sure that your trading is professionally based on proper strategies and trade tactics.

What if Bitcoin drop to $100KWhat if Bitcoin drop to $100K?
Technically looking at this asset from when it broke the $100K resistance and pushed further up, a possible reversal pattern has been forming.
This reversal pattern is a generally accepted pattern called the ''Head and Shoulder'' pattern
If this plays out technically, we may see BTC at $100K not far from now.
If you found this helpful, like, follow me, subscribe, share and comment.
📌 This analysis is for educational purposes only and not financial advice. Please trade and invest responsibly.
BTC- WEEKLY OUTLOOK; ON POINT#BTC- Weekly Outlook
On point again with the levels! ✅
I'm closely watching the $115,700- $116,000 resistance zone for price reaction.
The next major move will likely be shaped here; bullish breakout or rejection.
Key levels to monitor:
$120,000 (Major resistance)
$116,000 (Current resistance zone)
$110,000
$107,000
$104,000
$100,000 - (Psychological key support)
$98,000
$94,000
Let’s see if bulls can push through or if a deeper correction is next! Stay sharp and always manage your risk.

BTC Breaks out ! Classic breakout .
Let's see if we this breakout holds up or not.
We will watch this one closely....

Bitcoin Price Eyes Breakout as ETF Inflows Mirror ATH TrendBitcoin’s price is trading at $114,192 at the time of writing, facing resistance at $115,000. Sustained buying interest at this level will be crucial to trigger the next stage of upward movement.
If ETF inflows remain strong, BTC could flip $115,000 into support and rally toward $117,261 before targeting $120,000. This level would represent a critical milestone in Bitcoin’s ongoing bull cycle.
However, if the breakout attempt fails, Bitcoin may consolidate between $112,500 and $110,000. Such a pullback would invalidate the immediate bullish thesis but still keep BTC within its broader uptrend channel.

Captured 55% on Q/USDT trade :)Shared the last post about Q being bullish and breaking out from the box.
The coin pumped up instantly after the post and made +55% from our entry range. Now it seems like market makers is trying to trap late longs or late buys .Makes sense to re buy somewhere below.
Will be trading this coin again really soon.......
Follow to see more LIVE trades like these :)

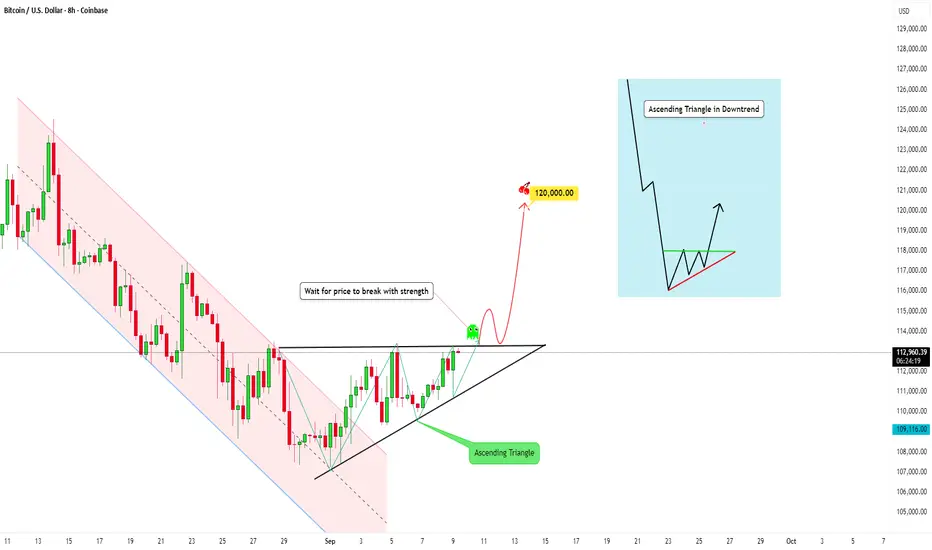
BTC has formed an Ascending Triangle in a DowntrendWhat is Happening Here?
If we take a look at Bitcoin, it's pretty interesting right now: we can observe an ascending triangle just formed. But this pattern took shape after a sharp drop in price.
An ascending triangle is a bullish continuation pattern:
- The resistance line stays horizontal (flat top).
- The support line is rising, creating higher lows.
So what does this mean?
This indicates that buyers are gradually pushing prices higher while sellers are consistently defending the resistance level.
And often with this pattern, the buying pressure overwhelms the sellers, causing a breakout to the upside.
🔹 Breakout expectation:
- Wait for breakout confirmation always! (strong candle close above resistance with volume), and/or on a retest of the broken resistance (now acting as support).
- With this pattern, if it breaks above strongly, the target can typically be measured by taking the height of the triangle and adding it to the breakout level.
🔹 Risk Factors:
- False breakouts can occur (price temporarily breaks resistance but falls back inside).
- If the pattern fails and price breaks below the rising trendline, it may signal bearish weakness.
✅ The reliability of the pattern increases on higher timeframes and with strong breakout volume.
In summary
An ascending triangle shows the following: Buyers are showing strength with rising lows, while resistance is being pressured repeatedly. A confirmed breakout above resistance could drive price toward a psychological target. Waiting for a strong breakout and possibly a retest helps reduce false signal risk.
Not financial advice, just sharing my thoughts on the charts.
Trade safely 😊
Bitcoin targets liquidity at 117K before CPI data impact📊 On the daily timeframe, BTC has broken above the key resistance zone around 113K–114.5K, showing strength. Currently, the market is eyeing the 117K liquidity zone as the next potential target.
🔍 On shorter timeframes, the structure suggests momentum is tilted upward, while the longer timeframe still hasn’t confirmed a higher high. This makes the upcoming move critical in deciding whether BTC can finally establish a new higher high or not.
💡 The outcome hinges on today’s CPI inflation data. A favorable CPI print could fuel a rally toward 122.5K, while a neutral or weak print might only push BTC to test liquidity near 117K.
⚡ All eyes are now on September 17th when the Federal Reserve interest rate decision will follow this CPI release. That verdict will set the broader direction for BTC and the entire market.
As of now, probability leans toward liquidity grab around 117K, with extended potential toward 122.5K if macro data aligns bullishly.

What Could Break Bitcoin's (BTC/USD) Consolidation Phase?Bitcoin (BTC/USD) is consolidating after a sharp pullback from its summer highs, with price currently trading near $113,472. The chart shows a well-defined range between support at $107,300 and resistance at $123,200, suggesting a potential breakout setup in the coming weeks.
Key technical points:
Support and Resistance: Price is holding above the 50-day SMA (114,742) but remains below the recent swing high, keeping BTC in a neutral-to-bullish zone. Stronger support rests at $100,000, where the 200-day SMA also aligns.
Momentum Indicators: The RSI is stabilizing near 51, showing neither overbought nor oversold conditions, while the MACD histogram is flattening, hinting at reduced bearish momentum.
Trend Outlook: Despite recent weakness, the longer-term uptrend remains intact as BTC trades above the rising 200-day SMA. A break above $123,200 would signal renewed bullish momentum and potentially open the way to fresh highs. Conversely, a close below $107,300 risks deeper retracement toward $100,000.
Overall, Bitcoin is in a consolidation phase with buyers defending support. A decisive breakout from this range will likely set the tone for the next major move. -MW

BITCOIN PREDICTION: IS USA MANIPULATING THE MARKET?! (big move) Yello Paradisers! We have been taking a look at what's going on with the new data release from USA. We have been taking a look at the CME futures gap. We have been taking a look at the multi-timeframe analysis on the ultra-high timeframe chart. We have been going through the moving average touch channel possible reclaim and the Elliott Wave Theory on multiple timeframes. I've shared with you where, with the highest probability, the next move will happen and what kind of confirmations we are waiting for.
Paradisers! Keep in mind to trade only with a proper professional trading strategy. Wait for confirmations. Play with tactics. This is the only way you can be long-term profitable.
Remember, don’t trade without confirmations. Wait for them before creating a trade. Be disciplined, patient, and emotionally controlled. Only trade the highest probability setups with the greatest risk to reward ratio. This will ensure that you become a long-term profitable professional trader.
Don't be a gambler. Don't try to get rich quick. Make sure that your trading is professionally based on proper strategies and trade tactics.

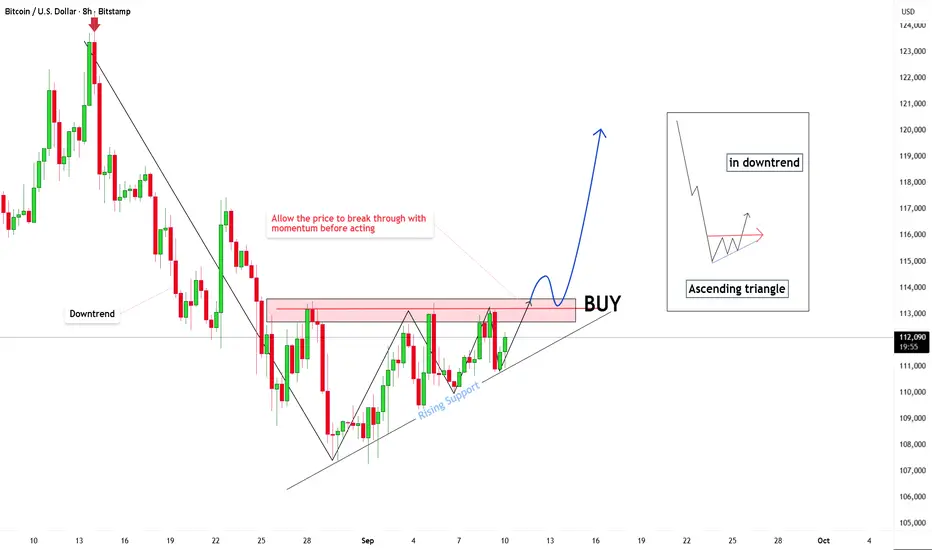
Unlocking the Power of Ascending Triangles in Bitcoin Trading!Hello everyone! 👋
In this analysis, we will explore a popular technical pattern in Bitcoin trading called the Ascending Triangle 🔺 . This is a useful tool that helps us identify potential trading opportunities, especially when the market is in a consolidation phase. Let's dive deeper! 🚀
1. Ascending Triangle Pattern 📊
An Ascending Triangle forms when the price consistently creates higher lows but faces resistance at a fixed price level. This indicates that buyers are in control, but the market needs a strong push to break through the resistance.
2. How to Identify and Read the Pattern 🔍
Higher Lows : In an ascending triangle, the price's successive lows create rising support levels. This shows increasing buying pressure and indicates that the price can’t drop below the established support. 📈
Horizontal Resistance: The resistance level is the area where the price fails to break through for an extended period, creating a horizontal line. For Bitcoin, the current resistance level is 113,000 USD. 🚧
3. Trading Strategy 💡
Wait for a breakout: This pattern typically leads to a breakout when the price exceeds the resistance level. However, it’s crucial not to enter the trade immediately when the price approaches resistance. You should wait for confirmation when the price breaks through the resistance and is followed by a strong candlestick. 🕯️
Enter after confirmation: When the price surpasses the resistance with high volume and a strong candlestick, that’s the ideal time to enter a buy position. This reduces risk when trading. ✔️
4. Support and Resistance Levels 🔄
Resistance: The current resistance at 113,000 USD is critical. If the price breaks this level, we can expect a strong bullish movement. 💥
Support: If the price fails to break through the resistance, keep an eye on support levels like 110,000 USD or lower. When the price returns to these levels, look for signs of a recovery to find a potential buying opportunity. 💪
5. Risk Management ⚖️
Use Stop-Loss: To protect your capital, place a Stop-Loss below the nearest support level. This helps minimize risk if the price doesn’t move as expected. 🔒
Reasonable Profit Target: Set your profit target at the next resistance levels, such as 113,000 USD, 115,000 USD, and even 120,000 USD, which is currently in focus. Always control the risk-to-reward ratio in every trade. 🎯
6. Conclusion 🎓
The Ascending Triangle pattern is a powerful tool for identifying trading opportunities. However, it’s important not to rush into a trade but to wait for confirmation from the market before making a decision. Always remember to manage risk appropriately and follow your trading strategies.
Now, it’s your turn to apply this knowledge in practice. Please like this post if you’ve understood everything and are looking forward to the upcoming lessons—it will be a huge motivation for me. 👍
Wishing you all the best on your journey to becoming an expert! 🌟 Trade safely! 🛡️
Bitcoin BTC is at a Critical Level: Equal Highs Trade Plan💰 Bitcoin (BTC) Update 💰
BTC is currently trending upward 🟢📈 on the 30M timeframe ⏰ and has reached a critical level ⚖️. We’re seeing a shift in structure 🔄, but there are equal highs forming 📍, leaving the question: will price break higher and continue bullish 🚀, or reject and move lower 🔽?
📊 My trade plan is simple:
✅ Wait for a break above the current range/equal highs 📈
✅ Look for a retrace + retest 🔄
✅ Enter long on confirmation 🎯
If this setup fails to play out, then the idea is invalidated ❌ and we stand aside.
⚠️ This analysis is for educational purposes only and not financial advice. 📚

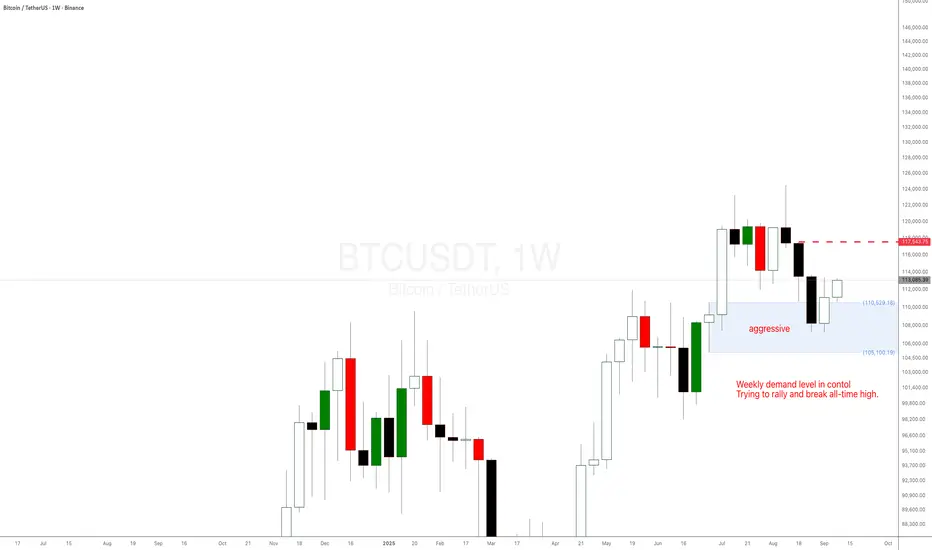
BitCoin BTC is trying to break all-time high with weekly demandBitCoin BTC is trying to break all-time high with the help of the aggressive weekly demand level at $110,500. Trying to rally and break all-time high again.
BTC Analysis (4H)Honestly, as you know, the market had been ranging for several days without much movement. On the chart, we had signs of a drop, but the drop didn’t happen, and instead the market dropped in a way that was shown.
The key level for Bitcoin is the 117K zone, where we may see a negative reaction. It is expected that Bitcoin will advance toward the red zone for now.
This market is a dangerous one, and it is necessary to avoid unnecessary trades.
For risk management, please don't forget stop loss and capital management
When we reach the first target, save some profit and then change the stop to entry
Comment if you have any questions
Thank You


Bitcoin EMA update - Big day today ?This chart uses the EMA, Simple Moving Average
Red = 50, Blue = 100, Green = 128, Yellow = 200
Today, PA is once again up against the 50 EMA that has become resistance.
This is just below the important level that would allow us to make a higher high if PA breaks through.
A Higher High is made if we rise above 113452
We can see that the 100 SMA is also now on a local line of support.
So it is decision time for PA today.
To remain in an ever decreasing area, a squeeze, or Break out above the 50 ( 112967 ) or fall below the 100 ( 110831 ) and the local support.
As you can see, this is a very tight range
This is continued with the 128 SMA at
109134
A Lower low is made if we drop below 107165
Daily MACD still rising Bullish
This is only just and not really showing to many sighs of a "Surge". The Histogram is green but is we look bak, we can see a similar rise in Mid August that failed to continue.
However, It has room to move higher when ready, by a substantial margin.
The 4 Hour PA charts shows ua how the Bulls have been at work
PA continues to besandwiched between the 200 EMA and the 50.
If this pattern continues, we can expect to see PA rejected today by the 200 EMA and return to the 111200 area.
The 4 hour MACD
The Histogram shows us the hesitancy of PA. This is nit such a bad thing PA seems to be waiting, maybe for the FED on 17th.
I am not sure that PA can continue this long and I feel a reaction will be made prior to this date.
This may be a Dip lower, A LONG destroyer just before we see a move higher,, should the FED lower rates.
But trying to predict BTC Moves is foolhardy...............
Today will certainly give us an idea of future direction........

Bitcoin Stalls at $111,000Over the last three trading sessions, BTC has shown a variation of just under 2% — a relatively modest move compared to the cryptocurrency’s usual volatility. This reflects that confidence in the crypto market remains in neutral territory in the short term. Investors are focused on upcoming U.S. inflation data, which could directly influence the Federal Reserve’s decisions regarding the broader economy. In this environment, Bitcoin appears to be in a wait-and-see phase, holding steady while awaiting a fundamental catalyst that could trigger consistent directional moves. For now, neutrality dominates as the market looks ahead to this week’s macroeconomic releases.
Renewed Sideways Action
The absence of significant price swings in recent sessions has started to shape a short-term sideways range, with resistance near $113,000 per BTC and support around $106,000. Recent fluctuations have not been strong enough to break this formation, making it the most important technical structure to watch in the near term. As long as this lateral range holds, Bitcoin is likely to remain neutral without showing clear breakout signals.
Technical Indicators
RSI: The RSI line is edging closer to the neutral 50 level, signaling an equilibrium between bullish and bearish impulses. This reinforces the prevailing neutral stance in the short term.
MACD: A similar scenario is visible in the MACD, with the histogram hovering near the 0 line. This suggests that the strength of short-term moving averages is balanced, further highlighting the lack of clear market direction.
Key Levels to Watch:
$122,000 – Historical Resistance: This marks the all-time high area. A sustained break above this level could reignite a broader bullish trend that currently remains on hold.
$113,000 – Nearby Barrier: Represents the upper band of the current sideways range. As long as the price continues to trade near this level, market neutrality will likely remain the dominant theme.
$106,000 – Key Support: Corresponds to Bitcoin’s recent lows. A breakdown below this area could signal a more relevant bearish bias and open the way for a potential short-term downtrend.
Written by Julian Pineda, CFA – Market Analyst

BITCOIN PREDICTION: MASSIVE MOVE INCOMING!!! (Guard UP NOW) Yello Paradisers! In this video, we are professionally analyzing Bitcoin. We are doing multi-time frame analysis as professional traders. First, we are starting on an ultra-high time frame chart where I'm sharing with you the magical moving average trend line, how it's perfectly working as a support, and the possible channel retest and the bearish cross.
On the high timeframe chart, we are looking at a zigzag that has finished with the highest probability. The first wave of an impulse has started—that is the question. We have a bullish divergence plus a shooting star, and we are waiting for the daily candle to close and reclaim that resistance to confirm some nice long positions.
On the medium timeframe, I'm sharing with you the bearish divergence we are waiting for across and the possibility of finishing the first wave.
On the low timeframe chart, we are going through the ending diagonal. Watch the fourth high; it cannot be reclaimed. Until it gets reclaimed, we are actively looking for short positions. We are anticipating a huge move, and we are going to be positioning ourselves aggressively very soon.
Paradisers! Keep in mind to trade only with a proper professional trading strategy. Wait for confirmations. Play with tactics. This is the only way you can be long-term profitable.
Remember, don’t trade without confirmations. Wait for them before creating a trade. Be disciplined, patient, and emotionally controlled. Only trade the highest probability setups with the greatest risk to reward ratio. This will ensure that you become a long-term profitable professional trader.
Don't be a gambler. Don't try to get rich quick. Make sure that your trading is professionally based on proper strategies and trade tactics.

Bitcoin Price History Says BTC Needs To Crash 8% To Form New ATHAt the time of writing, Bitcoin trades at $112,221, holding firm above the $110,000 support. This resilience reinforces the four-month uptrend line and signals potential short-term gains. The momentum is intact, with BTC eyeing higher levels.
If sustained, Bitcoin could climb past $112,500 and head toward $115,000. Yet to reach a new ATH, history suggests BTC might need to drop to $101,634 first, setting the stage for a stronger breakout.
On the flip side, if profit-taking escalates, BTC could slip toward the retracement level sooner. But should fear-driven selling dominate, the price risks falling below $100,000, which would invalidate the bullish outlook and extend the correction phase.

Bitcoin Daiy SMA UPDATEThis chart uses the SMA, Simple Moving Average
Red = 50, Blue = 100, Green = 128, Yellow = 200
The weekend was calm and very low trading.
PA is ranging along the 100 SMA and sitting, waiting.
PA has the potential to move in either direction right now but the Bulls are certainly present, Keeping PA static.
Daily MACD remains Bulish with room to move higher, Histogram is Green
On the shorter term 4 hour, we can see how the 50 SMA is supporting PA while the 100 is currently the line to cross at 111582
PA has support below and is avobe the VRVP POC ( red dots )
Shorter term certainly appears more Bullish
The 4 hour MACD also shows this
The MACD came down and tested neutral line as support and the Histogram here is alo Green.
But understand, this does NOT guarantee a rise further.
The lines of Resistance abive are growing.
Currently, beginning aroun 113K
The Blue line on the Daily chart is the ultimate Goal to be crossed.
This is a LONG Term line of resistance that has rejected EVERY ATH since 2011.
It is the only line that has done this and what is important to know, this is a Calculated Arc, part of a Fibonaccj Spiral ( as explained in a previous post)
This is the Bigger picture, PA from November 2009, the year after Bitcoin Was born
As you can see, PA is being Sqqueezed and HAS to react before January 2026 or face stiff rejection below that Long Term line of support ( dashed line)
What ever happens, this IS the beginning of a New Era, Cycle of Bitcoin.
And this is why we need to pay so much attention to Bitcoin right now.
We MUST rise above that blue Arc of resistance....
And Curently, we are HERE....shown in the chart below.
This is a daily chart from November 2024
PA has been trying to get above this blue Arc since then.
And we are right under it again now,
Target price to get to and hold Above this Blue Arc is around 117K
We may wait till the FED tells us its decision on interest rates this month.

Bitcoin Targets $116K or $104K Post-CPIMy main bias is to the upside, expecting more upward movement, contingent on holding $104,770. The upcoming CPI data is the key catalyst. On the 4-hour chart, a break above $111,721 targets $116,722, while a break below $109,464 targets the key support zone at $104,777.

BTC/USDT 4H AnalysisBitcoin currently consolidating around the $110k region, sitting just above a major demand zone. Market structure is showing two possible scenarios:
🔹 Bullish Case: Price holds above the grey demand zone (RL) and pushes toward the mid-level ($118k). A clean break here could open the path toward $124k–$126k (RH).
🔹 Bearish Case: If the $110k–$109k support fails, BTC may revisit the blue demand zone around $102k–$100k before any recovery.
Key Levels to Watch:
Resistance: $118k / $124k
Support: $110k / $100k
⚠️ This is not financial advice. Always use proper risk management.
💬 What’s your outlook on BTC this week – bullish continuation or deeper correction?
