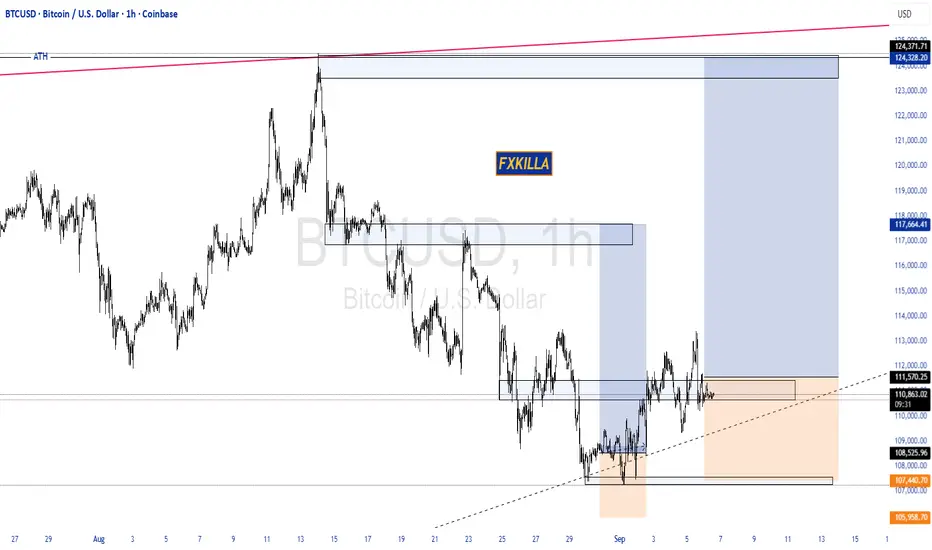
BITCOIN HIGH PROBABILITY SETUP SOON!!!🚨 BITCOIN HIGH PROBABILITY BUY SETUP 🚨
* Here We Can See The Next Potential Move For BTC Coming Hours/Days.
* Keep Your Eyes Close On Your Trading Positions.
* Happy PIP Hunting Traders.
FXKILLA.
Bitcoinprice
Lets Predict BTC on 13th Sept 2025On 13th Sept 2025
BTC should touch 106000
As the Trend is downwards and the mid of the down channel will meet 106000 on 13th sept 2025.

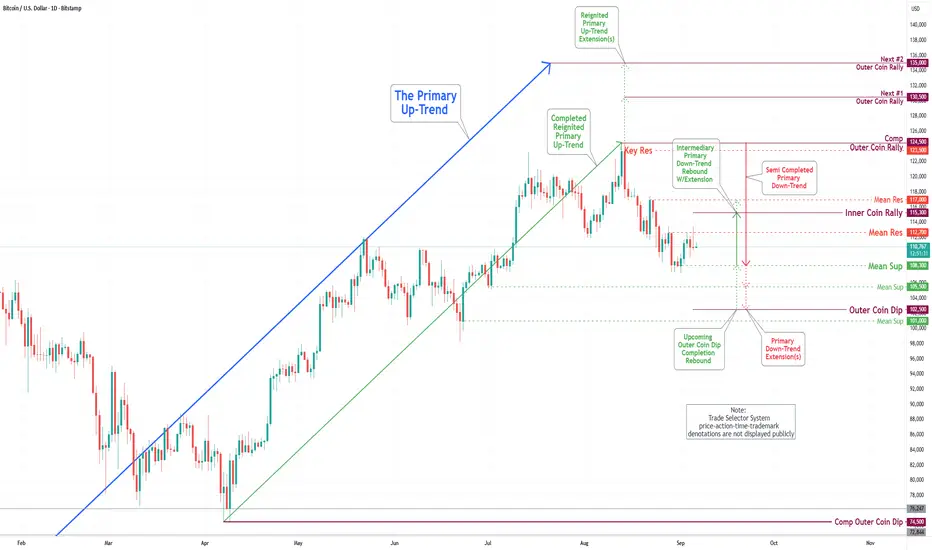
Bitcoin(BTC/USD) Daily Chart Analysis For Week of Sep 5, 2025Technical Analysis and Outlook:
During the trading session of the previous week, the Bitcoin market demonstrated a notable upswing, ultimately reaching our designated Mean Resistance level of 117000. Subsequently, the cryptocurrency experienced a retreat and is currently undergoing a consolidation phase.
The prevailing analysis indicates a firm probability of a continuation of the Intermediary Primary Rebound toward the Inner Coin Rally 115300, with the potential to extend its progression to the Mean Resistance level of 117000. However, it is essential to highlight that the Outer Coin Dip 102500 represents the primary ongoing trend and the overall direction of the market. Upon the completion of this phase, it is anticipated that Bitcoin will resume its bullish trajectory.
BITCOIN PREDICTION: SECRET PATTERN FORMING!!! (scary) Yello Paradisers! In this video, I have been analyzing Bitcoin for you on multiple time frames because we are doing professional trading analysis. On the ultra-high timeframe chart, I have been showing you the ABC corrective mode wave formation that we are doing right now and the next targets from an ultra-high timeframe perspective. Thanks to this, we can better understand the context of the overall market and make better trading ideas on lower timeframes.
On the high timeframe chart, I'm sharing with you that the zigzag of that ultra high timeframe degree B wave was, with the highest probability, finished. We are right now working on the first wave from a lower degree. I'm sharing with you also the bullish divergence.
On the medium timeframe chart, I'm putting your focus on the volume, which is dropping with the price rising. This is usually a sign of bulls being weak. Confluence this with being at resistance; it's usually a recipe for a reversal.We are also seeing two bearish divergences, which need to be confirmed, but the medium time frame is kind of bearish.
On the lower timeframe chart, I'm revealing to you the secret pattern formation: the ending diagonal. The Fibonacci sequence levels are sharing with you all the supports and resistances. I forgot to show you the confirmed bearish cross, but that's okay because the ending diagonal itself is revealing to us the next highest probability movement of Bitcoin.
Paradisers! Keep in mind to trade only with a proper professional trading strategy. Wait for confirmations. Play with tactics. This is the only way you can be long-term profitable.
Remember, don’t trade without confirmations. Wait for them before creating a trade. Be disciplined, patient, and emotionally controlled. Only trade the highest probability setups with the greatest risk to reward ratio. This will ensure that you become a long-term profitable professional trader.
Don't be a gambler. Don't try to get rich quick. Make sure that your trading is professionally based on proper strategies and trade tactics.

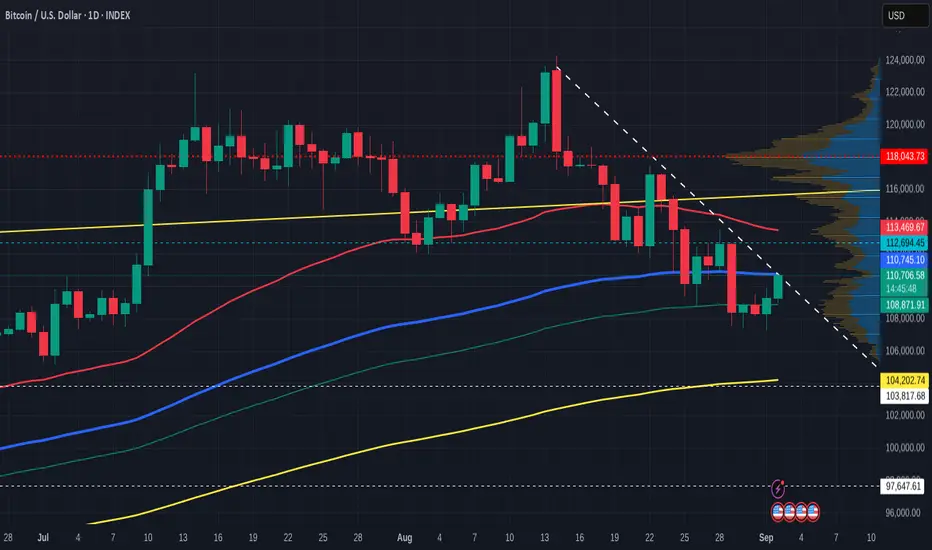
History Suggests Bitcoin Price Is Fated To ConsolidateBitcoin crossing the $112,500 resistance is encouraging, providing a path toward $115,000. This level is crucial for attracting new capital inflows, which would validate the recovery and increase the likelihood of sustained upward momentum.
However, historical patterns suggest consolidation remains likely. Bitcoin may settle under $115,000 or slip below $112,500, with sideways price action dominating the short term as the market absorbs recent volatility.
If profit-taking accelerates, Bitcoin could face sharper declines. A drop back to $110,000, or even a loss of this support, would weaken sentiment and invalidate the bullish thesis, leaving BTC vulnerable to extended consolidation or further downside.

BTC/USDT Crypto Heist - Bullish Breakout Blueprint!🔥 Thief Trading Style: BTC/USDT Bullish Heist Plan 🔥
Greetings, Money Makers & Market Robbers! 🤑
Ready to execute a daring heist in the Bitcoin vs. Tether (BTC/USDT) crypto market? 📈 Our Thief Trading Style combines technical precision and fundamental insights to target a bullish breakout. Follow this charted strategy to ride the wave and exit before the risky Red Zone. Let’s grab those profits together! 💪🎯
---
📊 Trade Setup: The Heist Plan
- Market: BTC/USDT (Crypto) 🌐
- Bias: Bullish Breakout 🌟
- Timeframe: 1D (Swing Trade) ⏰
Entry 📈:
- Breakout Entry: Wait for a clean breakout above the Moving Average (MA) at 108000. Place Buy Stop orders just above 108000 to seize the momentum. 🚀
- Pullback Entry: For lower-risk entries, set Buy Limit orders at the recent 15M/30M swing low (e.g., 105000-106000) to catch pullbacks. 📍
- Trader Tip: Set a TradingView alert for the 108000 breakout to stay ahead of the move! 🔔
Stop Loss 🛑:
- Breakout Traders: After the breakout confirms, place your Stop Loss below the recent 1D swing low at 96000 to guard against reversals. ⚠️
- Pullback Traders: Tailor your Stop Loss to your risk appetite (e.g., 1-2% of account). Adjust based on lot size and multiple orders. 📏
- Risk Alert: This heist is high-stakes! Stick to disciplined position sizing to protect your capital.🔥
Target 🎯:
- Aim for 122000, near the risky Red Zone (an overbought area prone to consolidation or reversal). 🏴☠️
- Exit Strategy: Consider taking profits early if bearish signals (e.g., high volume, reversal candles) emerge near 122000. 💸
Scalpers 👀:
- Stick to Long-side scalps with tight trailing stops. Join swing traders for the full heist or scalp quick moves if your capital allows. 💰
---
📡 Why This Heist Has Potential
BTC/USDT is in a neutral trend with strong bullish prospects, driven by:
- Technicals: A breakout above the 108000 MA, backed by higher lows on the 1D chart, signals robust momentum. 📊
- Fundamentals: Institutional buying and positive crypto sentiment (check COT reports) fuel upside potential. 📰
- Seasonal Trends: Bitcoin often rallies in Q2, aligning with our setup. 📅
- Intermarket Factors: USD weakness and altcoin strength could lift BTC higher. 🌎
---
⚠️ Risk Management: Secure Your Gains
- News Caution: Skip new trades during major news events (e.g., CPI, FOMC) to avoid volatility spikes. 🗞️
- Trailing Stops: Use trailing Stop Loss to lock in profits as price nears 122000. 🔒
- Position Sizing: Limit risk to 1-2% of your account per trade for a safe heist. 🚨
---
💥 Power Up the Heist! 💥
Join our Thief Trading Style crew by liking, commenting, and following for more high-energy trade plans! 🚀 Your support strengthens our market raids, helping us profit with precision. Let’s conquer BTC/USDT together! 🤝🏆🎉
Stay Sharp: Another heist plan is on the horizon. Keep your charts locked and loaded, traders! 🐱👤😎
#BTCUSDT #Bitcoin #Crypto #Bullish #SwingTrading #Breakout

BTC Triangle Squeeze: Next Stop $116K?Bitcoin is currently consolidating inside a symmetrical triangle, a classic squeeze that often precedes a strong breakout 💥. Price is building pressure with higher lows and lower highs, waiting for confirmation.
✅ Bullish Confluences:
Price is respecting triangle support and holding the structure.
Fibonacci retracement shows potential upside continuation.
Momentum is shifting after a prolonged corrective move.
🎯 Fibonacci Upside Targets:
🌟38.2% – $112,876
🌟61.8% – $114,195
🌟100% – $116,329
⚠️ Invalidation / Stop-Loss Zone:
If price breaks below $107,000 – $105,000, the bullish setup is invalidated ❌.
As long as BTC stays inside the triangle and above key support, the squeeze favors a bullish breakout

Quick Bitcoin Daily SMa update - PA getting rejected
As you can se, PA is getting rejected off the 50 SMA ( red)
If this rejection is confirmed, this could create a double Top and may push PA back down to create a Lower Low.
Watch this closely, it could turn if the bulls step in.
Just be Very cautious right now.
oshorter term 4 hour MACD is showing us that MACD did cross above the signal line however, this could turn down quickly as it did over on the left of the chart
Caution is advisable
NFP Jobs Data Could Trigger $116K or $105K Bitcoin MoveBitcoin is testing a critical breakout above $112,168 as markets prepare for tomorrow’s Non-Farm Payrolls report. The 4-hour chart has shown positive momentum, with BTC clearing resistance at $110,918 and pushing toward $112,856. If bulls can hold above $112K, the roadmap opens to $114,189 and $116,072. But if Bitcoin loses momentum, supports sit at $110,918, $108,592, and the deeper zone near $105,320.
The jobs report could be the catalyst that decides Bitcoin’s next big move. Consensus is around 75,000 jobs, just above last month’s 73,000. A weaker report could boost risk assets like Bitcoin as traders price in more Fed cuts. But a stronger print could cool risk sentiment and pressure BTC back into support. Either way, volatility is coming, and these levels will be key.

Bitcoin Daily SMA update- trend line tested and heldThis chart uses the SMA, Simple Moving Average
Red = 50, Blue = 100, Green = 128, Yellow = 200
As expected, PA came down and tested the trend line that has rejected PA since 13 August and has since bounced back up.
We will have to wait and see but this may have created a Higher Low as PA rose and now sits on the 100 as support.
Should PA continue to rise from here, the 50 SMA at 113254 is the line of resistance we Need to cross and test. This would then give is a Higher High.
After that, the next Higher High will be at a price after 119
Should PA get rejected, the 128 SMA is at 108995 and then the previous Low is at 107165
The Daily MACD seems to have Crossed above its signal line
This is "only Just " and so we wait to see where it goes form here but we are certainly looking Bullish in a longer term as Bulls show us they can respond.
The 4 hour BTC PA chart
This chart makes me a little cautious for now, waiting for confirmation of this move higher,
See how that 2nd Green candle after the bounce, came up and got rejected off the 100 SMA and the current candle is having the same problem.
We do seem to have support on the 50 SMA
PA is currently in a tight range above, with the SMA's very tight.
It is easier for PA to Drop from here so today could be a battle.
The 4 hour MACD is also at a point of crossing
The MACD here has NOT yet crossed the signal line and so we wait, watching to see what happens.
The Histogram shows positive momentum.
It should be remembered that we have the USA calling the possibility of Rate cuts this month.
If the FED goes against the grain, this could be damaging and should the FED decide to cut rates, we are off to the races.
This month is Pivotal.
Long term still Bullish, short term undecided..remaining Bullish CAUTIOUS

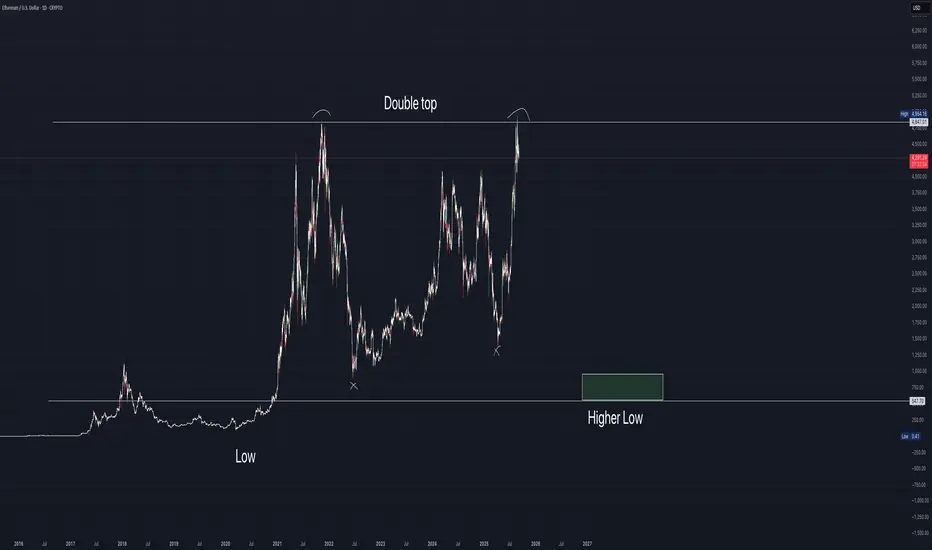
Ethereum ENDS all meme coins?We have a double top pattern here on eth the should end life of all memecoins and wash away the most if not all worthless projects from the blockchain even the first Defi project MKR is starting to be delisted. be careful out here
SOL/USDT | Is the Next Bullish Wave Coming? (READ THE CAPTION)By analyzing the Solana (SOL) chart on the daily timeframe, we can see that the bullish momentum is still intact, with the price currently trading around $207. I expect that after a short-term correction, we’ll likely see another bullish wave from Solana.
If the price resumes its upward move, the next potential targets are $218, $245, and $260.
Key demand zones to watch are $197–$204 and $173–$187.
Stay alert for reactions around these levels!
Please support me with your likes and comments to motivate me to share more analysis with you and share your opinion about the possible trend of this chart with me !
Best Regards , Arman Shaban

Bitcoin Daily SMA UPDATE This daily chart uses the SMA, Simple Moving Average
Red = 50, Blue = 100, Green = 128, Yellow = 200
PA got rejected yesterday from its rise over the 100 SMA and is currently testing that as support on a Daily chart.
If that fails, we could see PA retreat down to around 108900, where we have the 128 SMA and the descending line of resistance.
This line has not been tested as support yet.
As we can see on the chart, if this rejection continues down past 107165, we will have printed a Lower high, pointing towards continued price drops. with the 200 SMA at 104348
The Daily MACD has reached up to its Signal line
This could also be a point of rejection, keep your eye on this
The 4 Hour BTC PA chart shows us more near term detail
PA is currently testing the 50 as support after getting rejected from the 128 and falling through the 100.
If this fails, we can see PA will bump into the trend line, around 108900 - 108500.
To many extents, this would be a good move providing we then found support and bounced higher as it would create a Higher Low.
The 4 hour MACD
MACD has turned down and heading towards its signal line.
This may offer support but it will continue down Bearish if PA does reach down to the trend line.
Note how the Histogram has descending sharply.
Today we must sit and wait
For me, I think we could see the 109k - 108k area tested at some point over the next few days.
Maybe sooner than later

Bitcoin All Time Highs Forecasted DateWas just working on a new study showing the number of months and days between prior ATH's for Bitcoin has typically been between 46-49 months or 1400 to 1492 days as shown in the Green boxes.
Based on the 2017 cycle, that puts this cycle ATH around November 1st 2025.
So we don't have much time if this cycle is going to play out like prior ones.
Also global liquidity is slowing down, and BTC is deviating from following M2 Money Supply.
However, the daily cycle low is signaling a local bottom is in here.
What do you think?

BITCOIN PREDICTION: WHY IS NOBODY TALKING ABOUT THIS!!?(warning)Yello Paradisers! In this video, we are again, as professional traders, analyzing the multi-time frame context of the market. On an ultra-high time frame, we are seeing the medium moving average touch. We are also discussing the possible channel retest, plus I'm sharing with you the bearish cross and bearish divergence.
On the high time frame chart, we are having the zigzag finished, probably with the highest probability. The first ultra-high time frame wave is starting, that is the question of this video, which we are answering, and we are seeing the bullish divergence.
On the medium timeframe, we are seeing that as we are touching the resistance, the volume is dropping, which is a bearish sign. We are seeing two bearish divergences on RSI and MACD histogram, and with the highest probability, we are finishing the first wave.
On the low timeframe chart, I'm discussing the ending diagonal with you, and I forgot to tell you about this, but we are also having a bearish cross there.
Paradisers! Keep in mind to trade only with a proper professional trading strategy. Wait for confirmations. Play with tactics. This is the only way you can be long-term profitable.
Remember, don’t trade without confirmations. Wait for them before creating a trade. Be disciplined, patient, and emotionally controlled. Only trade the highest probability setups with the greatest risk to reward ratio. This will ensure that you become a long-term profitable professional trader.
Don't be a gambler. Don't try to get rich quick. Make sure that your trading is professionally based on proper strategies and trade tactics.

BTCUSD Bircoin drop, sell your minning farm, but just for nowThis Diagonal is still valid for me, selll @ 113.400
Targets 105.000 / 102.000 and 99.000
GG

Bitcoin Daily SMA UPDATE
This daily chart uses the SMA, Simple Moving Average
Red = 50, Blue = 100, Green = 128, Yellow = 200
Yesterday, PA broke through the descending line of resistance it had been under since 13 August.
As yet, this does not mean PA will now rise, though on a daily chart, the MACD certainly has the room to move higher, as seen below
However, given where we are in a traditionaly quiet month, I do still see PA sliding down this line in the bear future...testing it as support
This maybe supported by the fact that the shorter term 4 Hour MACD has Crossed Neutral but the Hitogram is showing White bars and not Green. This shows a weakening and the MACD line moving closer to the red signal line.
The Daily RSI is also turning over but remains above its MA for now
So for now, we see PA has broken over the Daily 100 SMA and is testing as support.
Above, we have the 50 at 113300
This could be the next line of resistance if PA rises now.
Should PA turn down now, we have the 100 SMA at 110762.
Below that , the 128 sits at 108194
To remain above that descending trend line, we need to Range in the area we currently are in and stay above that 100SMA at 110K for at least the next 24 hours
If we look at the Bitcoin 4 hour chart, we see this maybe possible
PA sits in a very tight range between the 50 and the 100 4 hour SMA and is currently sitting on the VRVP Point of control ( red dotted line )
This is all support but we have to wait and see if it remains so.
There is Very little action trading right now...we just waiting.

Btc looks bearish Bitcoin bears were successful in forming a new lower high during this small time frame down trend. If we do not close above 110k bitcoin will remain bearish.
Next support :- 105k and 100k

Bitcoin Daily on Lower Low Lower high again -till ?
This chart uses the SMA. Red - 50, Blue - 100, Green - 128 and 200 - Yellow
PA is absolutely in a descending channel with repeated Lower Low Lower high on a daily chart
Today, we will see if we break that or not as PA reaches resistance on a Trend line.
The 50 SMA is descending as potential resistance when the day comes were PA breaks out and reaches higher.
This will happen as I do not believe we are entering a Deep Bear..This is a Local "Cool off" but we may hit a tough one at that 50 SMA at around 113K
Till then, we are hitting the 100 as resistance and the 128 as support.
This may break today as we hit that line of resistance with the 128 SMA not far below.
The DAILY MACD offers some hope of strength as we see it bouncing off oversold
We will have to watch today close to see where we go
If we get rejected today, Next stop down could be the 200 SMA at around 103K low
This line needs to hold to show use confidence in the Bulls.
My line of concern will be reached if e go to 95K and fall through.
This daily chart below shows a number of things to support what is written above.
On this , we see the 2.618 Fib extension around the same area as the 200 day SMA @ 103900 usd
The circle highlights a point where a 236 Fib circle crosses over a rising line of support.
This is around 97K and just below this is another line of support around 95K
People that follow me will know that I often highlight 236 Fib circles as lines of strong resistance and on this occasion, this maybe Exactly why we see PA dropping now.
The intersection is near the end of September, a usually slow month that has a majority of RED Candle Closes on a month chart ( 9 red to 5 Green since 2013)
I am not saying we will get to this level but the potential does exist while we remain in a down trend....
I would hope that PA bounces off the Fib extension on that 200 SMA if we get near that 104K line.
On a longer term, we should take note of the WEEKLY MACD
Should this continue down the line drawn, that takes us to Late October before a bounce ur a more sustained push higher.
We should keep this in mind
I welcome any comments ( Sensible ones..)
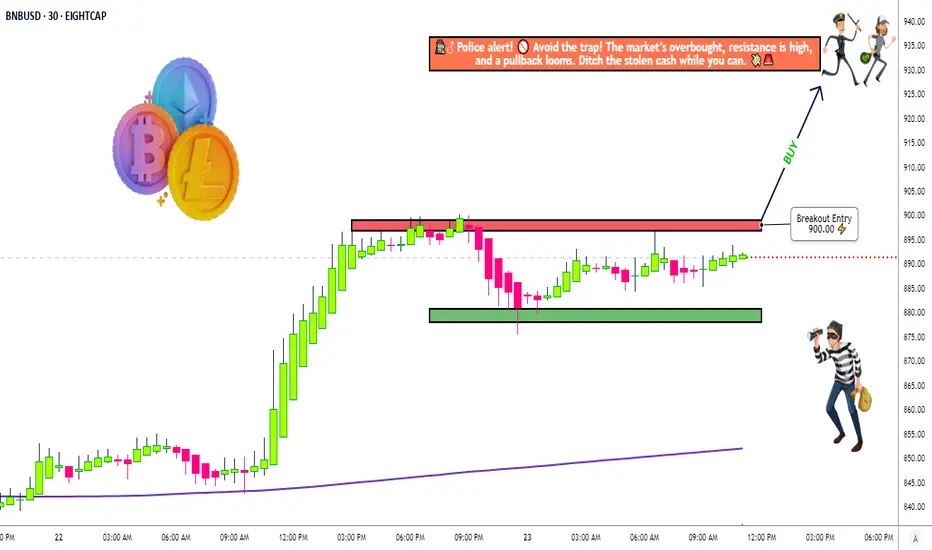
Binance Coin Robbery Setup – Bullish Layers or Police Trap?🚨💰 BNB/USD Crypto Market Grand Heist Plan 🎭🚨
🕵️♂️ Dear Thief OG’s & Market Robbers,
The vault door is open in BNB/USD “Binance Coin vs U.S Dollar” Crypto Market — today’s Day Trade Heist is about to begin! 🔥
📜 Master Plan
Direction: 📈 Bullish Robbery Mode Activated
Entry 🎯: Thief never knocks once — we layer entries at:
900.00 💵
890.00 💵
880.00 💵
👉 You can add more layers depending on how big your bag needs to be!
Stop Loss 🛑:
Thief SL is hidden at 870.00 — escape hatch ready!
⚠️ Adjust your SL based on your own strategy & risk appetite.
Target 🎯:
Police barricade spotted! 👮♂️💥
Our grand escape with the loot is at 930.00 — grab it before they catch you! 🚔💨
💡 Thief’s Strategy
We don’t enter all-in — we slice the entry with multiple limit orders (layering strategy style), just like cracking a safe piece by piece.
Patience, discipline, and precise timing = a clean heist. ⏱️🔓
⚠️ Trading Alert: Stay sharp — news releases & sudden volatility can trigger alarms. Always manage your positions and keep your stops in check!
💖 If this heist plan fuels your robbery spirit, hit the Boost Button 💥 and strengthen the Thief Army.
Together we rob the market daily with style, precision & profit. 🏆💪🤑
BTC correction august/septemberBTC has reached overbought territory, there is also bearisch divergence. It also didnt go above 123k anymore. i expect a correction in august/september.
dont chase FOMO, be prepared. Nothing goes in a straight line. there are always corrections.
CRYPTO:BTCUSD BINANCE:BTCUSD CME:BTC1! BINANCE:BTCUSDU2025

Bitcoin last leg down before going back up ?BITSTAMP:BTCUSD faces strong resistance near 110,100 – 110,650. Failure to break above increases the probability of continuation to the downside, with the Fibonacci levels acting as the next bearish targets.
📉 Bearish Confluences
Price is currently testing the mid-zone of the Bollinger/Keltner channel and struggling to break above the red resistance zone.
Previous upward attempts have been rejected around the 38.2% Fib retracement (110,100), showing weakness.
Structure still shows a lower-high pattern, keeping the short-term bias bearish.
🎯 Fibonacci Bearish Targets
If the rejection holds, downside Fibonacci extension levels provide potential targets:
38.2% retracement → 108,298
61.8% retracement → 107,742
100% retracement → 106,840

BITCOIN PREDICTION: WHALES PREPARING HUGE MOVE!!!? (damn)Yello Paradisers! In this video, as professional traders, we have been going through multi-time frame analysis. First, we went through an ultra-high time frame where I shared with you that we are touching an important moving average trend line. Because of that, we understand that a channel retest is possible, but we need to be careful because there is a bearish divergence, and we already got a confirmational bearish cross.
On the high timeframe chart, we have seen that the ABC zigzag is already finished. Right now, we are forming a possible first ultra-high timeframe wave, and from that, we are starting the first motive mode wave. We are seeing bullish divergence, and what I forgot to say is that if we start moving to the upside and creating the secondary high timeframe wave, we will touch the CME futures gap and close it. Which is another confluence.
After that, we have been shifting our focus to the medium timeframe. I've told you that what's important is also what you don't see in the market and we are seeing so far no bearish divergence plus what I have didn't show you but there are also two bullish hammer candlestick patterns candles I have been sharing with you the moving average trend line the Fibonacci time zone and the next resistances finally at low time frame chart we have been going through the ending diagonal.
Paradisers! Keep in mind to trade only with a proper professional trading strategy. Wait for confirmations. Play with tactics. This is the only way you can be long-term profitable.
Remember, don’t trade without confirmations. Wait for them before creating a trade. Be disciplined, patient, and emotionally controlled. Only trade the highest probability setups with the greatest risk to reward ratio. This will ensure that you become a long-term profitable professional trader.
Don't be a gambler. Don't try to get rich quick. Make sure that your trading is professionally based on proper strategies and trade tactics.
I apologize; I accidentally turned off the video in the middle. Unfortunately, TradingView doesn't allow me to continue, so the next video will be here on TradingView on Wednesday. Stay tuned.
