Bitcoin Monthly Candle Colour closes since 2013 - August Close
August closed RED and so now we have 10 red closes to 5 Green.
This has closed the possibility of continuing the pattern we had been following.
The Dashed line Boxes show us The only 2 occasions where we have had a Green December, Red January, Red February, Green March, Green April.
Then we had a Green May 2012 and a Red May 2020
Then both repeated a Green June, Green July.
They both also had had Green August but we just closed Red.
This breaks this sequence for me but I will keep the boxes in place for now just incase we revert back to Sequence.
The horizontal arrows are pointing to the previous 9 Red August Closes.
Where you see 2 Arrows is where this was followed by a Green September. This happened 4 times.
Note those double arrows on the left are in the 2016 build up to 2017 ATH and the ones on the right are in the Current cycle.
September Candle close count is currently is 5 Green to 9 Red, the same as August was.
Of those 5 Green September closes, 4 were after a Red August.
The other Green September was in the 2020 run up to the March 2021 ATH ( Middle dashed box)
Odds are on for a Red September as we see Bitcoin falling below some serious support levels but we should also note how PA is remaining above the 100k line for now.
August and September are traditionally months of Holidays and so trading slows, hence the majority of Red candles
Q4 is the ones to wait for and as you can see from the colour counts, Q4 is usually Bullish
We wait - we Hold and if PA Drops to the possible 104K line where the 200 day SMA sits, I will Buy More.
Scale in
Bitcoinprice

Bitcoin testing 116k zoneIf we are successful in breaking above the 116k zone resistance. Bitcoin will pump hard to 120k and 123k next. As the high time frame trend continues to stay uptrend. Let's see if bitcoin breaks it now or has some other plans.
Stay tuned!

Bitcoin - Important scenario of what will happend soon!Did you know this cycle is almost identical to the 2020 cycle?
When I say identical, I don’t mean the exact percentage of price moves, but rather the price behavior and market structure.
If you look closely at the Bitcoin chart, you’ll notice that the current price action is very similar to what happened back in 2020 — and not only that, it’s happening in the same months as well.
There are so many strong similarities confirming this theory.
📌 So what’s the reason behind this?
-Both cycles are happening under Trump’s presidency.
-Same policies, same decisions, which lead to the same market behavior.
-The market is literally moving the same way it did during his first term.
- for example Bitcoin Dominance, didn’t reach the 66% level since 2020, and right after that it dropped to around 40%. The same setup could be repeating now... as it's expected to move up and retest the 60% level during Sep before going to 40% level
And here’s the shocking part 👇
If you check the SPX fractal between Feb 19, 2020 and 2025, you’ll see the exact same pattern — even on the same day! This can’t just be a coincidence. It’s part of a much bigger game being played on us.
Based on this, here’s what I expect:
The S&P 500 (SPX) could correct around 10% in September, dropping towards the 5800 level.
And of course, this will have a direct impact on the crypto market, likely causing it to drop in September.
So what should we expect?
September is likely to start with high volatility and downside pressure, with some altcoins potentially dumping over 30%.
After that, starting in October, we could be entering the real bull run, lasting until mid-2026.
Best Regards :
Ceciliones🎯

Bitcoin to 125,000After 9 months of downtrend/sideways price action, bitcoin has finally broke out of this trend.
If we zoom out to weekly time frame, the 9 months of downtrend/sideways price action, serves as "handle" for "cup and handle" pattern which goes back to Nov 2021. Finally, after 3 years, this pattern is completed and bitcoin is set to get to it's next target which is ~125,000.
On it's way up, bitcoin will probably face some resistance at 100K, since people have been waiting for bitcoin to hit this price target from all the way back in 2019-2020. Moreover, 100K is Fibonacci famous 1.6 extension level, so we might see some sell off at this price. However, we believe that FOMO can break this resistance level with ease and bring up the price to 125,000 USD.
From this point, we probably see more sharp upward trend toward 155K and 200K but this is the danger zone where we might see sharp pullbacks to 100-125K range.

BTC price analysis for SeptemberWith ICC we read what price is telling us and we act accordingly.
After the ranging sideways zone, price has given the bearish indication, went up to take the shorts above 122k then pushed back down.
The trend is still bearish, 1h,4h and Daily both MACD and RSI are still bearish.
The support from 105k to 106k has held price before so it could be where BTC reverses and strong buys will step in OR it fails to hold and we head further down. We don't try to predict.

BTC on the beat :))))everything has gone according to analysis. I hope you have enjoyed the sell positions. Make sure to save profit and manage your positions or make them risk free.

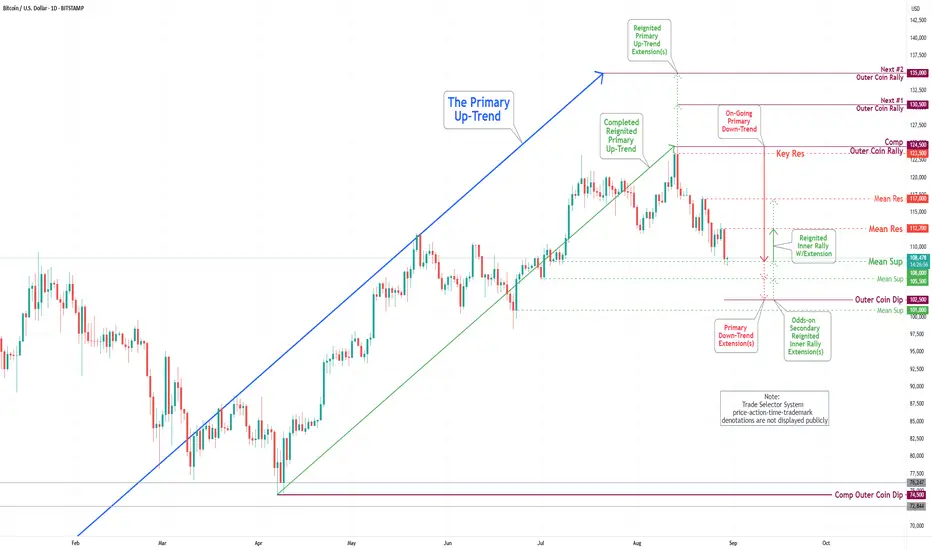
Bitcoin(BTC/USD) Daily Chart Analysis For Week of August 29 2025Technical Analysis and Outlook:
During the trading session of the previous week, the Bitcoin market underwent a significant pullback, surpassing the completed Outer Coin Dip at 112000, and is currently stabilized at the Mean Support level of 108000. The prevailing analysis indicates a substantial likelihood of a rebound for the cryptocurrency, with a target set at the critical Mean Resistance level of 112700. There is, however, a possibility of further extension towards the Mean Resistance level denoted as 117000. On the downside, Bitcoin may continue its descent to the final target of Outer Coin Dip 102500, navigating through Mean Support 105500 before ultimately resuming its bullish trajectory.
Bitcoin at Golden Pocket Support – Don’t Sell the Dip?Bitcoin is currently testing the 0.618–0.65 Fibonacci retracement zone (~$108k), a historically strong support level also known as the “Golden Pocket.”
With confluence from CZ’s reminder — “Things to avoid in crypto: Selling the dip” — this area could be a major bounce zone if bulls defend it.
🔹 Strong Support: $108k
🔹 Next Support: $98k if breakdown happens
🔹 Resistance: $113k – $117k
Bias: Watch for confirmation candles. A bounce here could send BTC back toward $113k–117k. A breakdown invalidates this support.

A Question many people don't know the answer to.In this post we’ll answer a question many people don't know the answer to, and provide an in-depth explanation of why the crypto market is bound to a 4-year cycle.
🔸The answer:
-The market is tied to a key event — the Bitcoin Halving . This is when the block reward for mining Bitcoin is cut in half every 4 years. Mining is the lifeline that brings Bitcoin into circulation. Without it, there would be no supply entering the market.
But is this still effective now, given that most of Bitcoin’s supply is already mined?
The total supply of Bitcoin is fixed at 21 million, and so far, around 19.9 million have already been mined. That leaves only about 1.1 million Bitcoin still to be mined — scheduled, with halvings, until the year 2140.
I know what you’re thinking … Why does the halving still impact market behavior if the remaining supply is so small and its effect seems limited?
-History shows that after every halving, the market tends to rise for about a year and a half. This proves that investors wait for the halving to take place, monitor the network’s smooth performance during the event, and once they confirm no issues exist, they begin injecting liquidity into the market.
------------------------------------------
Is there a scenario where the 4-year cycle could change?
It’s difficult, but yes …
Why? Because since Bitcoin’s inception, its price cycle has been tied to the halving. This pattern has been consistent since 2011, across three full cycles, and now we are in the fourth.
However, the halving itself has become a symbol of trust and security for investors. Every successful halving event reinforces confidence in Bitcoin’s scarcity and strength. That’s why the 4-year rhythm will only change if another factor emerges strong enough to rival the influence of the halving.
Signs of such a new factor already appeared in 2025 — with the U.S. President’s support for Bitcoin and the growing trend of corporations and financial institutions purchasing it, alongside increased transparency in declaring holdings and reserves.
This shift is crucial. When supply moves from scattered hands (individuals) to stronger hands (corporations) , and holdings are publicly disclosed, it strengthens trust in the Bitcoin network and reduces the wild volatility that individuals once caused.
Conclusion : The 4-year cycle could evolve in the future, especially if supportive policies accelerate and corporations continue to accumulate Bitcoin in massive quantities starting from the next cycle.
Best regards
Cecilione🎯


XRP LABOR DAY SALEXRP HIT A CRITICAL SUPPORT ZONE BETWEEN $2.80-$2.76
Xrp can head back towards $3 to test resistance. If xrp breaks $3 it can head to $3.50 and breakout towards $5 on the weekly charting
This is not financial advice. Good luck!
-R2C

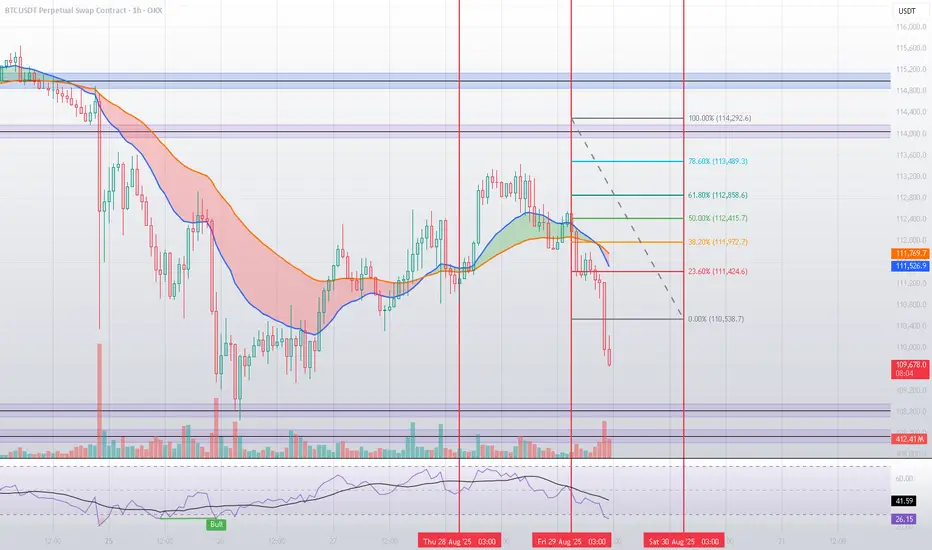
Technical Analysis for BTC/USDTBased on mathematical and statistical models, along with technical tools such as Fibonacci retracement levels and moving averages, Bitcoin is currently undergoing a bearish correction after failing to break through the key resistance at $114,046.
🔹 Interaction with Fibonacci Levels
In the previous analysis, we highlighted the importance of Fibonacci retracements in anticipating turning points. Recent price action confirmed this, as Bitcoin repeatedly reacted to these levels. The 61.8% retracement at $112,858 acted as a strong resistance, turning into a supply zone where sellers regained control.
Moreover, price failed to approach the 100% retracement at $114,292, reflecting a clear weakness in bullish momentum at higher levels. After that, Bitcoin broke below the 38.2% retracement at $111,972, triggering a sharper downside move — once again proving the reliability of statistical models in mapping market behavior ahead of time. 📉
🔹 Key Support Levels
$108,832: The first major support, aligning with a previous liquidity zone where price showed strong reactions. 🛡️
$108,353: A stronger support level. If broken, this could lead to a deeper bearish extension toward $107,500 or lower.
🔹 Technical Indicators
The RSI dropped to low levels (41.6 and even near 26.4 at certain points), signaling oversold conditions ⚠️, which may lead to a short-term rebound from the supports.
The 20 & 50 EMAs have crossed bearishly, confirming the downward bias.
🟢 Bullish Scenario
To regain momentum, Bitcoin must reclaim the $111,400 – $111,900 area and then retest the $112,800 (61.8% Fibonacci) level. Only a sustained breakout here would open the way toward the major resistance at $114,046. 🚀
🔴 Bearish Scenario
Failure to stabilize near current levels could push price down to $108,832, followed by $108,353. A breakdown below the latter would likely accelerate bearish momentum significantly.
✅ Conclusion
Bitcoin failed to reach the key resistance at $114,046 and gradually lost strength as it broke through crucial Fibonacci levels. The market is now testing critical supports at $108,832 and $108,353, which will determine whether a rebound is possible or if further downside is ahead. At this stage, caution is essential ⚖️, with close monitoring of liquidity and momentum.
$BTC: -$4000 in 10min – panic or opportunity?Here's our take:
🔹 Historically, such sharp CRYPTOCAP:BTC drops used to cause -20% to -40% crashes in altcoins.
Now, some alts are holding, others correcting mildly, and a few are even rallying.
🔹 In the last 24 hours, $840M was liquidated.
Roughly 80% were long positions.
Historically, reversals often start after $1.1–1.3B in total liquidations.
🔹 BTC Dominance (BTC.D) and Tether Dominance (USDT.D) are forming readable, consistent patterns.
👉 Current thesis: OKX:BTCUSDT will likely continue its movement inside the falling purple channel.
If price reaches $107–108K, we’ll consider closing our short bot to reassess market conditions.
💬 What’s your perspective? Share below.
______________
◆ Follow us ❤️ for daily crypto insights & updates!
🚀 Don’t miss out on important market moves
🧠 DYOR | This is not financial advice, just thinking out loud.

BITCOIN PREDICTION: CRASH WILL STOP HERE!!!? (nobody watching) Yello Paradisers! In this video, I'm sharing with you the ultra-line time frame perspective. We are analyzing the channel and the Elliott Wave Theory on a high time frame chart. I'm sharing with you how the ABC correction is finished. We are going through the Bitcoin CME futures gap or medium time frame. I'm sharing with you the Fibonacci time zone, the Elliott Wave count, and the confirmations we are waiting for to start in your positions.
Paradisers! Keep in mind to trade only with a proper professional trading strategy. Wait for confirmations. Play with tactics. This is the only way you can be long-term profitable.
Remember, don’t trade without confirmations. Wait for them before creating a trade. Be disciplined, patient, and emotionally controlled. Only trade the highest probability setups with the greatest risk to reward ratio. This will ensure that you become a long-term profitable professional trader.
Don't be a gambler. Don't try to get rich quick. Make sure that your trading is professionally based on proper strategies and trade tactics.

BTCUSD Faces Mid-Band Rejection: Deeper Retracement incoming Price is showing rejection around the mid-range of its volatility bands after failing to sustain above the $112,800 zone, suggesting a potential continuation lower. The setup aligns with multiple bearish signals favoring downside momentum.
✅ Bearish Confluences:
Fibonacci Resistance: Price rejected just below the 38.2% retracement level at $114,619, failing to reclaim higher ground.
Lower High Structure: Market continues to print lower highs, reinforcing the short-term bearish trend.
Volatility Band Pressure: Rejection from the mid-band area highlights weakening buy-side momentum and strengthens the case for further downside.
🎯 Fibonacci-Based Targets:
TP1 – $111,016 (38.2%): First support test within the lower range.
TP2 – $109,903 (61.8%): Deeper retracement target in line with bearish continuation.
TP3 – $108,102 (100%): Full measured move completion toward the lower volatility band.
SL: Placed above $114,620 to invalidate the short thesis in case of bullish breakout.

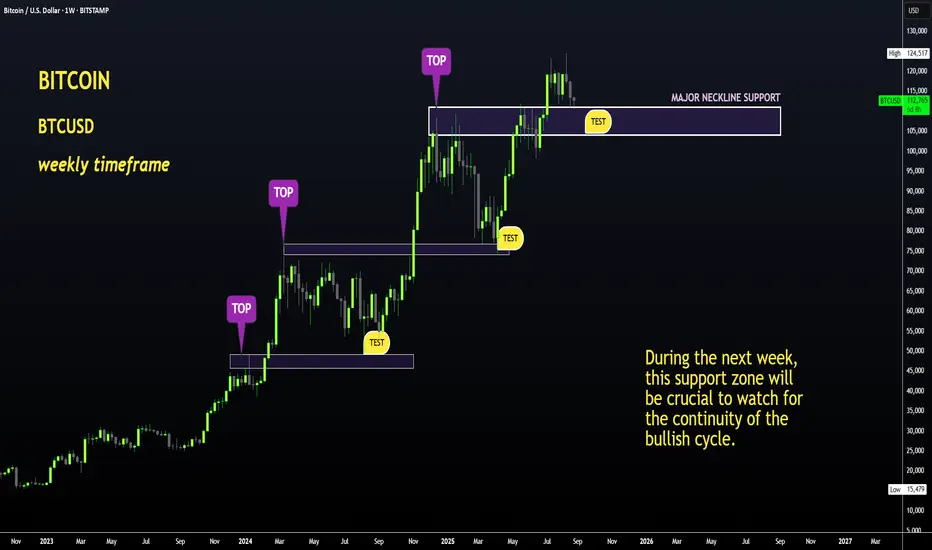
BTC in Trouble if THIS Support Breaks !Hello BTC Watchers
The previous update on Bitcoin was on how we may expect the altcoin market to play out during the next few weeks. (Find it here):
Now, if we look at Bitcoin in the weekly timeframe, the price is trading right on top of a KEY support zone. Here, we can either see a dip - marking the start of the bearish cycle OR the price can maintain this level and perhaps even push towards a higher high. This will all depend on the SUPPORT ZONE, and if the weekly candle will close ABOVE or BELOW this zone.
This would be between these zones:
Interestingly enough, we've extended to a full 2.0 on the Fibonacci retracement level. This will be very helpful in determining major bounce zones during the bearish season:
The next week will be vital! Update to follow at the end on the week on the progress of Bitcoin.
BITCOIN Bearish Breakout!
HI,Traders !
#BITCOIN made an epic
Bearish breakout of a very
Strong key horizontal level
Of 112340.5which is now a
Resistance and the breakout
Is confirmed so we are
Bearish biased and we will
Be expecting a further
Bearish move down !
Comment and subscribe to help us grow !

Bitcoin Daily update - will the 100SMA hold this time?
So, PA lost momentum and is falling abck to support on the 100 Daily SMA ( blue )
Last time we fell through the 100 we reached down to teh 128 Daily SMA ( green ) and found support
We need to watch closely and se if this happens again if the 100 fails
It is worth remembering that should the 128 fail, the 200 Daily SMA ( Yellow ) is down around 100K
After this, support lays around 94K

BTC short set upCurrently trading a short on BTCUSDT... this will drop to 108900 and retest 110600 before completing the dump to 105500

Bitcoin Reclaims Support Zone – Potential Move Toward $117KBITSTAMP:BTCUSD is rebounding from a key dynamic support zone within its descending channel, with price action now testing the mid-range of the EMA cloud structure. This bounce suggests potential short-term upside continuation if momentum holds.
✅ Bullish Confluences:
Fibonacci Retracement Support: Price respected the 38.2%–61.8% retracement zone between ~$111,330 and ~$110,218, confirming strong demand.
EMA Cloud Reclaim: Current price action is attempting to reclaim the EMA cluster, signaling improving bullish pressure.
Trend Structure: Short-term higher low forming after the recent sell-off, keeping the possibility of a reversal alive.
Candlestick Reaction: Strong rejection wicks from support levels indicate buyers stepping back in.
🎯 Fibonacci-Based Targets:
TP1 – ~$114,442 (38.2% retracement resistance).
TP2 – ~$115,555 (61.8% retracement / mid-supply zone).
TP3 – ~$117,356 (full retracement / key resistance).
🛡️ Stop-Loss: Just below $110,800 (61.8% support breakdown), invalidating the bullish scenario.

BTCUSD is set to cross 125,000$112000 is a key level of support that tested the previous resistance turned support and price bounced off this level $124500 and rejected with head and shoulder formation to support. We can spot a over extension below the key support level $112400.
With strong liquidity trigger from the support level BTCUSD potentially bouncing off the level and may continue to rise upto $125000 and beyond as the continuation of long term uptrend.

Technical Analysis for BTC/USDTBased on mathematical and statistical models, along with Fibonacci retracement levels and moving averages, Bitcoin is currently trading near the $113,000 area. The recent bullish momentum has pushed the price upward, but the market now faces key pivot levels that will determine the next move.
🔹 Key Resistance Levels
$114,047.7: The first major resistance. A clear breakout above this level could fuel further bullish momentum. 🚀
$114,995.1: A critical resistance both technically and psychologically. Surpassing this level would likely open the way towards $115,800 – $116,000, confirming the strength of the current uptrend.
🔹 Major Support Levels
$108,829: A crucial support zone. If broken, short-term market sentiment may shift from bullish to neutral. 🛡️
$108,349: A stronger support level. A breakdown here could trigger a move toward $107,000 or even lower.
📈 Indicator Insights
The RSI is hovering near 66, suggesting the market is gradually entering overbought territory. This highlights the importance of the resistance zones, where profit-taking could occur.
The 20 & 50 EMA lines are showing a bullish crossover, supporting upward momentum as long as support levels hold.
🟢 Bullish Scenario
If the price breaks above $114,047.7 and then $114,995.1, Bitcoin could quickly advance toward $115,800 – $116,000 in the short term.
🔴 Bearish Scenario
Failure to sustain above $113,000 could lead to a pullback, with $108,829 as the first line of defense, followed by the stronger support at $108,349. A breakdown below this zone would turn the short-term outlook bearish.
✅ Conclusion
Bitcoin is at a decisive point: strong resistance lies between $114K – $115K, while robust supports are clustered near $108K. A breakout or breakdown from these levels will set the tone for the next major move. Until then, risk management remains essential. ⚖️

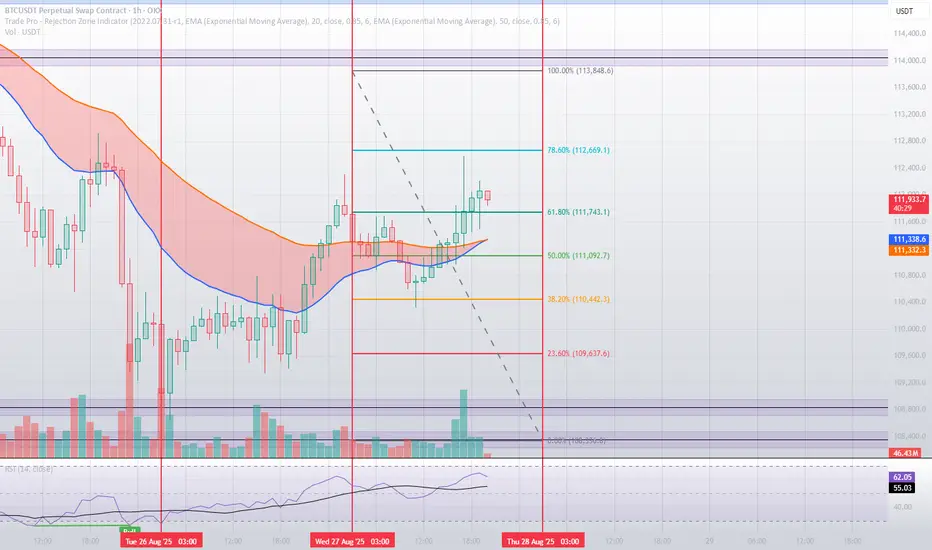
The Power of Mathematics & Statistics in BTC/USDT PredictionWhen comparing the previous analysis with the latest chart, we can clearly see how mathematical and statistical models helped anticipate Bitcoin’s movements with remarkable accuracy using Fibonacci retracements.
🔹 In the earlier analysis, we highlighted the 61.8% level at $111,743 as a decisive pivot. The new chart shows that the price indeed rallied into this zone, even pushing slightly higher towards the 78.6% level at $112,669 before facing strong selling pressure. This demonstrates the precision of mathematical models in mapping potential turning points before they happen. 📈
🔹 Support levels projected previously — such as $110,442 and $109,637 — remain intact as strong defensive zones, perfectly aligned with historical rebound areas.
⚖️ The Comparison
Mathematics and statistics are not just theoretical tools; they provide a real-time roadmap for traders:
Upside: Price climbed to the 78.6% Fibonacci extension as projected. 🚀
Downside: Key supports held firm, validating the statistical forecasts. 🛡️
🔍 Momentum indicators (RSI) also confirmed this move: rising from the neutral 52–54 range in the earlier chart to above 62 in the latest one, reinforcing the bullish swing towards mathematically calculated targets.
✅ Conclusion
From one chart to the next, it becomes clear: mathematical and statistical models are not only explanatory but predictive. Fibonacci levels acted as precise guideposts, allowing us to foresee both potential highs and lows. Their reflection on actual market action proves the strength of these models — a must-have tool for any professional trader seeking accuracy and confidence. 💡📊