BITCOIN PREDICTION: ANOTHER MASSIVE LIQUIDATION INCOMING!!?(bad)Yello Paradisers! In this video, we have been going through multi-time frame analysis. Professional trading requires doing analysis on multiple time frames so you can really understand the context of what's going on. On the ultra-long timeframe, I've been sharing with you the Elliott Wave plus the bearish cross, the bearish divergence.
On the high timeframe chart, we have been going through the ABC zigzag, which seems to be finished already, and we are starting the first wave of our ultra-high timeframe impulse.
On the medium time frame, we have been going through the Fibonacci and Elliott Wave count. I have been sharing with you on the RSI, a bullish divergence. We have been going through the sub-waves and where the secondary wave might end.
We didn't have enough time to go through it, but I wanted to show you the CME Futures gap that will probably close on the creation of the secondary wave.
Paradisers! Keep in mind to trade only with a proper professional trading strategy. Wait for confirmations. Play with tactics. This is the only way you can be long-term profitable.
Remember, don’t trade without confirmations. Wait for them before creating a trade. Be disciplined, patient, and emotionally controlled. Only trade the highest probability setups with the greatest risk to reward ratio. This will ensure that you become a long-term profitable professional trader.
Don't be a gambler. Don't try to get rich quick. Make sure that your trading is professionally based on proper strategies and trade tactics.
Bitcoinprice

Short Bitcoin Update DAILY
Bitcoin has reclained the 100 Daily SMA as support after a good day yesterday.
However, Daily MACD still falling Bearish, with room to continue
Daily RSI has room to move higher or Lower
We can Tip either way here and I feel the likelihood is for PA to continue as it is..
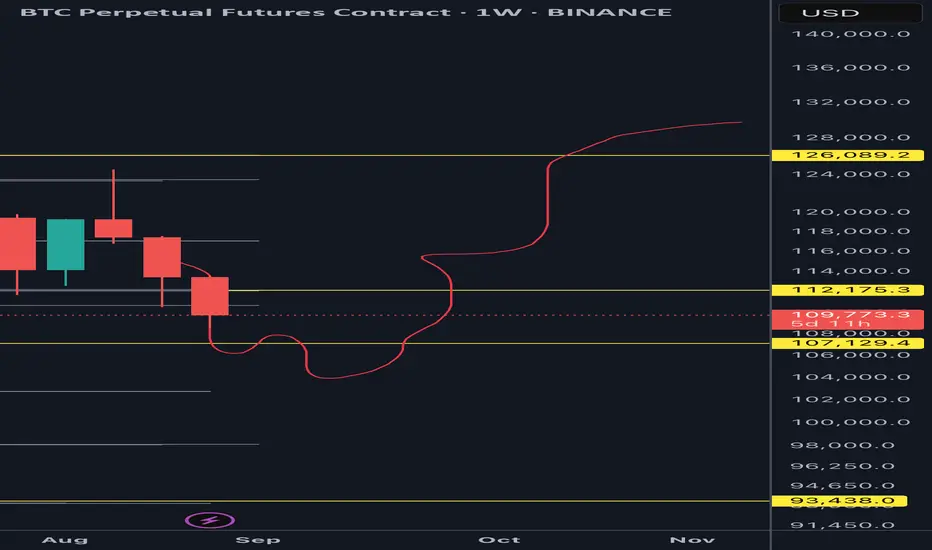
As mentioned in the Monthly Colour candle post, This could lead to a slightly RED September followed by a Big start to Q4
Possibly good for ALTS

Bitcoin buy Soon as soon possibleBitcoin buy Soon as soon possible
The live Bitcoin price today is $111497.14 USD with a 24-hour trading volume of $64109128491.21 USD. We update our BTC to USD price in real-time.

BTC Professional Market Movement Analysis🏗️ How Market Moves
Liquidity Grab at Support 🟢
Price dips into the 112K zone to collect liquidity (stop-hunts + institutional buys).
Market shows wick rejections & volume absorption.
This is where smart money positions for the next leg higher.
Expansion Phase 🚀
After liquidity grab → market expands upward.
Price pushes aggressively toward the 124K resistance.
This movement is fueled by trapped sellers covering shorts + buyers entering late.
Resistance Reaction 🔴
At 124K zone, market faces supply.
Either:
Rejects and falls back toward support (range continues).
Breaks through → signals strong bullish continuation (trend shift).
📉 If Support Fails
If BTC closes below 111K, it means liquidity is not enough.
Market will seek the next major demand zone (100K) where bigger orders sit.
This creates a stop-hunt + deeper accumulation before a new push higher.
🧠 Pro Definition
Market does not move randomly — it moves from liquidity pool to liquidity pool.
BTC is currently collecting orders at 112K support.
Expect a bounce → expansion → test of 124K supply.
If 112K fails, price will seek deeper liquidity near 100K before rebounding.
⚡ In simple terms:
👉 Market first hunts liquidity at support 🟢,
👉 then expands upward toward resistance 🔴,
👉 and finally decides — either reject back into the range or break higher for continuation.

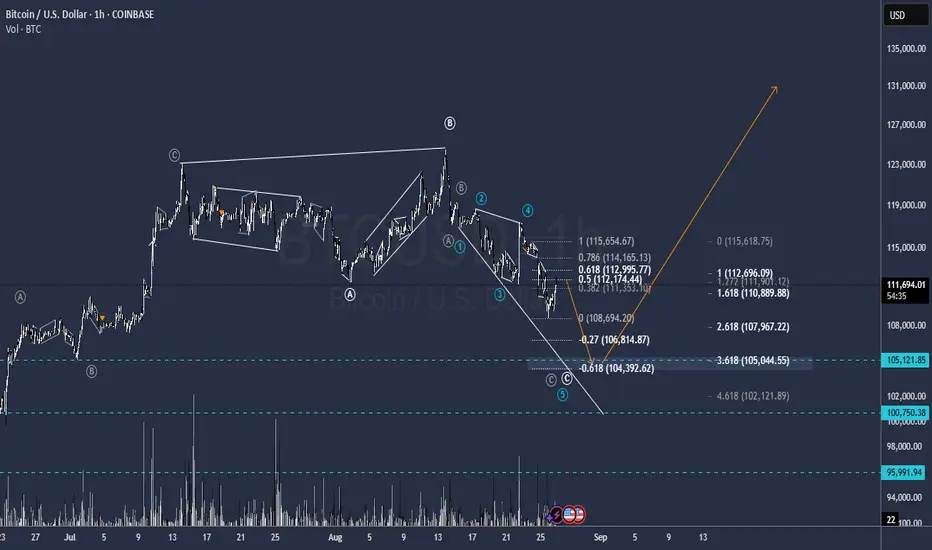
BTC Leading Diagonal for C last Corrective waveTicky one but it is about to make the last wave of the Diagonal that finish the Correction
Buy Level is 105.150 Targets unknown, starts at 127.500 / 133.000 and further
It can Go a little Lower 101.000, possible but not needed.
For now its a Sell from 112.000 to 105.150
GG
Bitcoin Halts Declines Around the $111,000 ZoneThe last few trading sessions have been particularly challenging for Bitcoin’s bullish momentum in the short term, mainly because two sessions ago the price dropped by more than 6%. This pullback was driven by profit-taking, following Powell’s comments at Jackson Hole, which had sparked a brief surge in confidence toward the end of last week. However, the current scenario is different: after this sharp drop, a highly neutral sentiment has emerged on the chart, as the market continues to assess how a lower interest rate environment could impact Bitcoin demand in the coming weeks.
For now, the Crypto Fear & Greed Index remains in neutral territory, standing at 43 points, right on the threshold where a new “fear” phase could start to develop in the sentiment indicator. As long as uncertainty persists in the short term, it is likely that neutrality will continue to dominate movements in the sessions ahead.
A Significant Bearish Move Emerges
Bitcoin’s price had managed to sustain an uptrend from early April until mid-August. However, at that point a relevant bearish bias began to surface, consistently breaking through the prevailing uptrend line and putting at risk the bullish momentum that had supported the chart. Now, the predominance of selling pressure in the short term raises the risk of triggering a move that could give way to a more consistent downtrend in the coming sessions.
RSI: the RSI line has slipped slightly below the neutral 50 level, reflecting that selling momentum has started to dominate in the short term. If this pattern persists, bearish pressure could intensify in the upcoming sessions.
MACD: the MACD histogram also shows a bearish bias, as it remains below the 0 line. This indicates that the average of recent moving averages has shifted into negative territory, reinforcing the outlook for the continuation of the current correction.
Key Levels to Watch:
$122,000 – Historical High Zone: the main barrier for bullish moves. A sustained return to this level could reactivate the uptrend line that has recently been broken.
$113,000 – Immediate Resistance: corresponds to the 23.6% Fibonacci retracement and acts as the nearest barrier in the short term. A breakout above this level would end the current bearish bias and could pave the way for a more neutral scenario.
$106,000 – Definitive Support: aligns with the 100-period moving average. A break below this level would imply a deeper change in market structure, opening the door to a more solid bearish trend in the short term.
Written by Julian Pineda, CFA – Market Analyst

Very Possible Bitcoin Scenario BTC lost momentum and it will possibly go to July opening level sweep below and continue upwards.
This is just my opinion, I don’t see huge distribution in price to go down further than that 👍
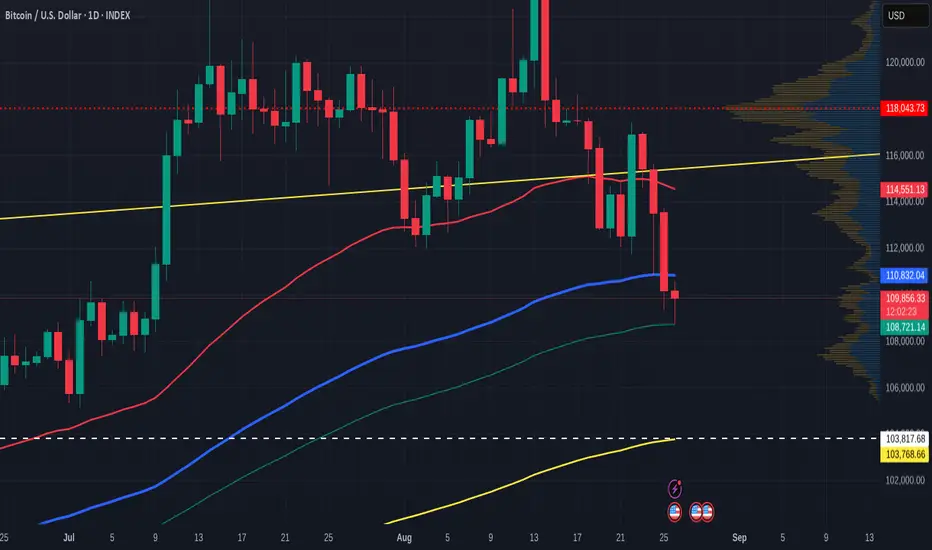
Quick Bitcoin Update with SMA's
PA is currently finding support off the 126 day SMA (Green) having falling through the 100 days SMA ( blue)
The 50 dayy SMA is falling fast and we need to watch this does not act as a line of resistance in the near future.
PA may drop further and we could hit the 200 day SMa ( Yellow ) on around 103k
For me, I am happy to Hit 100k again towards the end of the month..
BUY MORE BITCOIN AT 100K
Bitcoin May Correct – Critical Support at $110K📊 Market Developments
Bitcoin is currently trading around $110,154, with intraday movement between $108,951 – $112,820.
The minor pullback follows a decline from the $112K–$113K support zone, triggering $44M outflows on Aug 26.
📈 Technical Analysis
🔹 Key Resistance: ~$113,800 → breakout above this may trigger strong recovery.
🔹 Nearest Support: ~$110K → holding here could lead to bounce; breakdown targets $108K – $106.2K.
📌 EMA09: Not specified, but price near support suggests buying pressure being tested.
📉 Candlestick / Momentum: BTC broke below its multi-month upward channel, showing a CHoCH → short-term bearish control.
🧐 Outlook
Bitcoin may continue to correct short-term if $110K support fails.
However, a rebound above $113.8K could revive bullish momentum toward $120K+.
💡 Suggested Trading Strategy
🔺 BUY BTC/USD: 108,500 – 109,000
🎯 TP: 40/80/200 pips
🛑 SL: 107,900
🔻 SELL BTC/USD: 113,800 (if bearish reversal confirmed)
🎯 TP: 40/80/200 pips
🛑 SL: 114,300

This is what Bitcoin Dominance Index indicates about the market The Bitcoin Market Dominance Index (often called BTC Dominance) is a metric that shows how much of the entire cryptocurrency market's total market capitalization is made up by Bitcoin alone. In simple terms,
When BTC dominance rises, altcoins may underperform, and traders may rotate into BTC or stablecoins.
When BTC dominance starts falling, it could indicate the start of an altcoin rally
The chart snapshot shows BTC.D from 2018 to current date, with key indications marked for the 2018 - 2021 Bull Run and the current Bull Run. As observed, BTC reached its ATH (red vertical line : Nov 08, 2021) 1064 days since the start of the 2018 - 2021 Bull Run. Another such indication is that during the past cycles BTC has reached its ATH roughly around 201 to 250 days from its immediate halving date. When these two indications are correlated to the current cycle, BTC should top this cycle within the range of mid-September to end October (range indicated within the two vertical red lines)
Another key indication is the falling of BTC.D, marking the start of the Altcoin season. During the previous cycle, BTC.D went sideways during early 2021 before dropping from ~60% to ~39% within a period of 6 weeks. Similar consolidation can be observed in the current cycle before BTC.D starts to drop from ~60% at the beginning of August 2025. This is a strong indication that we are currently running through the midway of the Altseason.
At the time of writing CRYPTOCAP:BTC.D is at 58.55% after reaching a 7-month low of 57.69% after achieving its cycle high of 66.03%. This is a strong indication that Alts domination will continue for the rest of the season until the end of October or probably extended till the year end. Also, since the start of the current Bull Run, this is the first time the 14-day RSI has dropped below its 14-day smoothing SMA further proving the trend reversal.
There are some considerations where the above indications extracted from previous cycle behaviors can be challenged. The investor sentiment is very different compared to previous cycles with institutional adoption of crypto and exposure of BTC and ETH through ETFs allowing ordinary investors to flock into crypto. Also, the current macro-economic conditions and regulatory framework have a significant effect on the market behavior.
These factors might result in BTC.D to not to drop to the levels they dropped in the previous cycle at this stage (varying in between 39% to 46%). So, we might see a replication of drop in value of BTC.D similar to previous cycle but under a different scale.

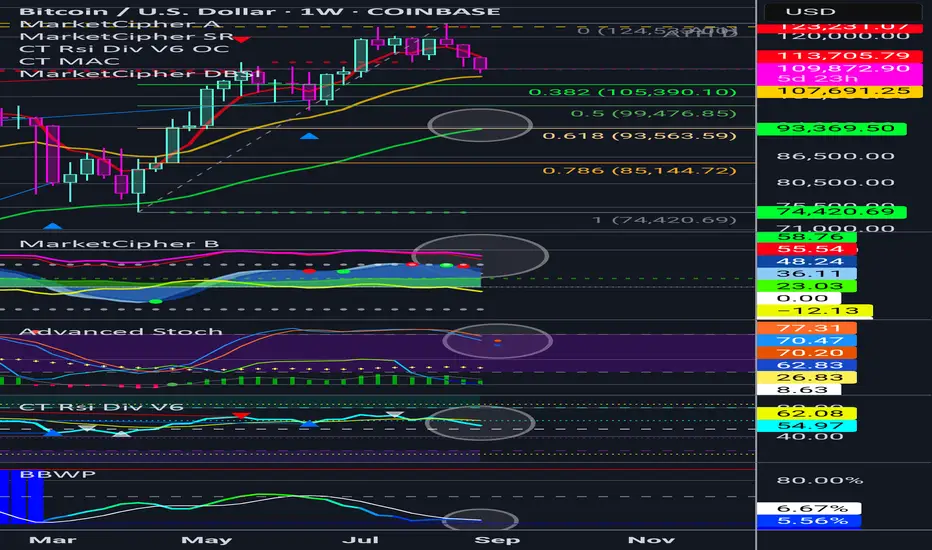
BTC 93-94K target on the Weekly...?Just an idea but what do you think...?
All indicators pointing we move down. And there so happens to be a 50EMA sitting at the 618 Fib retracement. Would love input.
NFA
Bitcoin - The magical $1.000.000 level!🚀Bitcoin ( CRYPTO:BTCUSD ) is not done yet:
🔎Analysis summary:
Over the course of the past couple of months, we have been witnessing a bullish continuation on Bitcoin. After the all time high breakout, there is a high chance that this bullrun will continue and Bitcoin might even retest the resistance trendline at seven digits in the near future.
📝Levels to watch:
$1.000.000
SwingTraderPhil
SwingTrading.Simplified. | Investing.Simplified. | #LONGTERMVISION

BTC Breakout Watch🚨 BTC Breakout Watch
Massive volume spike. Clean breakout. Now it’s all about follow-through.
📍The Alpha View:
In the 1/2 hour, these levels matter:
✅ Above Green Line→ Bullish🐂
🟡 Above Yellow Line → Cautiously Bullish
🟨 Below Yellow Line → Cautiously Bearish
😡Below Red Line → Bearish 🐻
This is where momentum decides who owns the next move — bulls must hold the line, or it’s just another fakeout in disguise.
➼Stay Sharp. Stay Disciplined. Stay Ready.

Bitcoin Profits Hit 2-Month Low, How Are Investors Reacting?BINANCE:BTCUSDT current price is $111,653, falling through the $112,500 support level. This zone has held strong since early August, offering a key buffer against deeper losses. For now, price action shows consolidation rather than collapse.
In the span of one week, BINANCE:BTCUSDT profits have declined sharply, hitting a two-month low. The price drop has pushed several addresses out of profit, reducing overall realized gains. Such drawdowns often follow overheated conditions, which may have marked a recent market top.
Given the current sentiment and net accumulation, BINANCE:BTCUSDT could see a bounce to $115,000 . If buying pressure increases and macro support builds, BTC might stabilize above this resistance. Alternatively, it may continue to trade sideways between $112,500 and $115,000 until clarity returns.
However, if accumulation slows and selling resumes, BINANCE:BTCUSDT may drop to $110,000. A move this low would mark a near two-month bottom and could expose BTC to increased downside risk.

BITCOIN MASSIVE CRASH TOWARDS $44K JUST STARTED!!!? (warning) Yello Paradisers!
In this video, I'm sharing with you the CME futures gap that we have created and what needs to be done to close it. On the ultra-high time frame, I'm sharing with you the bearish cross. We are shifting our focus afterward to the high time frame where I'm seeing the bullish divergence. I'm telling you where the daily candle cannot close.
Then, we move our focus to the medium time frame, where I'm sharing with you the RSI bullish divergence plus the support. On the lower time frame, we will look in the next video.
Paradisers! Keep in mind to trade only with a proper professional trading strategy. Wait for confirmations. Play with tactics. This is the only way you can be long-term profitable.
Remember, don’t trade without confirmations. Wait for them before creating a trade. Be disciplined, patient, and emotionally controlled. Only trade the highest probability setups with the greatest risk to reward ratio. This will ensure that you become a long-term profitable professional trader.
Don't be a gambler. Don't try to get rich quick. Make sure that your trading is professionally based on proper strategies and trade tactics.

BTCUSDT: Price Action Trade Bitcoin 121K!Hello friends, based on the price action levels and this phase change from a bearish mode and back to a broken level, Bitcoin is expected to reach the level of 121,000.

Where is Bitcoin on the LONG Term resistance since 2013? ARROW
To recap, that Blue Arc that has rejected Bitcoin PA ever since it rose into the Channel.
The Arrow points towards it.
This is the ONLY line that has rejected EVERY ATH since 2013 and is a part of a calculated Fibonacci Spiral.
I have posted the details and shown this in another post.
SO, as you can See, PA has begun getting squeezed by this and the long term rising line of support below. PA has never dropped below this line since rising over it in 2012.
The Crunch point of this squeeze is in December this year.
And PA recentlyt broke ABOVE this Arc in July and has been battling to remain above ever since.
The Daily chart below shows this cearly.
As with anytime that PA rises above resostance, it needs to test it as support and THIS has to be Crucial...We Drop back bellow thisline, PA could get dragged backwards, down, as the spiral descends....
We have tested thisperfectly now, twice -- but we are not clear of trouble yet and as you can see n the daily, PA is currently under the POC ( Red Dots )
The Point of Control (POC) on the Volume Profile Visible Range (VPVR) indicator is the specific price level within the visible range that has recorded the highest volume of trading activity during the selected time period.
This is local resistance
We need to break Free and Rise above this but we may not see that till September

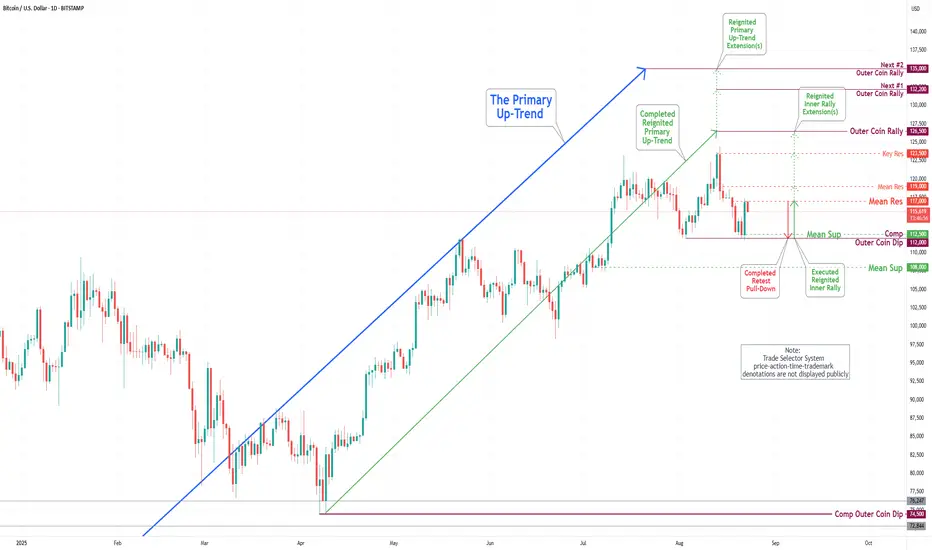
Bitcoin(BTC/USD) Daily Chart Analysis For Week of August 22 2025Technical Analysis and Outlook:
During the current trading session, the Bitcoin market has experienced a noteworthy pullback to the completed Outer Coin Dip at 112000, and as a result, has demonstrated considerable resilience, reaching the Mean Resistance (the inverse of Mean Support) at 116600 as detailed in the Daily Chart Analysis for the week of August 15. The prevailing analysis suggests that the cryptocurrency may revisit the Mean Support at 116500, as well as the completed Outer Coin Dip at 112000, before resuming its bullish trend.
Bitcoin Explodes to $116,000 After Fed Speech SignalBitcoin Surges Past $116,000 as Federal Reserve Signals Historic Policy Shift
The cryptocurrency market experienced a dramatic reversal of fortune as Bitcoin rocketed past $116,000, recovering from a challenging period that had seen the digital asset touch six-week lows. The catalyst for this remarkable turnaround came from an unlikely source: Federal Reserve Chair Jerome Powell, whose dovish remarks at the prestigious Jackson Hole Economic Symposium sent ripple effects through global financial markets, fundamentally altering the trajectory for risk assets and digital currencies alike.
The Jackson Hole Moment That Changed Everything
In what many market observers are calling a pivotal moment for monetary policy, Jerome Powell delivered a speech that effectively cemented market expectations for an interest rate cut in September. The immediate reaction was nothing short of spectacular. Within minutes of Powell's comments hitting the wires, Bitcoin surged over 2%, climbing from approximately $114,200 to breach the psychologically significant $116,000 level. This rapid appreciation represented not just a technical bounce, but a fundamental reassessment of the cryptocurrency's near-term prospects in a changing monetary environment.
The significance of Powell's speech cannot be overstated. The Jackson Hole Economic Symposium has historically served as a platform for Federal Reserve chairs to signal major policy shifts, and this year proved no exception. Powell's carefully calibrated remarks suggested that the Federal Reserve's aggressive rate-hiking cycle, which had been implemented to combat persistent inflation, might finally be approaching its conclusion. For Bitcoin and the broader cryptocurrency ecosystem, which had struggled under the weight of tighter monetary conditions for much of the past two years, this represented a potential game-changer.
The market's interpretation was unambiguous. Federal funds futures immediately repriced to reflect a 90% probability of a rate cut at the September Federal Open Market Committee meeting, up from roughly 70% before Powell's speech. This dramatic shift in expectations triggered an immediate reallocation of capital across asset classes, with risk assets being the primary beneficiaries and the US dollar experiencing notable weakness.
A Broader Market Rally Takes Shape
While Bitcoin's surge captured headlines, the positive sentiment extended far beyond the cryptocurrency market. Ethereum, the second-largest cryptocurrency by market capitalization, staged an even more impressive recovery, rebounding 8% after having endured a painful 12% correction in the preceding sessions. This outperformance by Ethereum suggested that investors were not merely buying Bitcoin as a hedge against monetary policy uncertainty, but were expressing renewed confidence in the broader digital asset ecosystem.
Traditional financial markets also responded enthusiastically to Powell's dovish pivot. US equity indices gained approximately 1%, with technology stocks leading the advance. The yield on benchmark Treasury securities dropped to 4.27%, reflecting bond traders' expectations for a less restrictive monetary policy stance going forward. Gold, that traditional safe-haven asset and frequent competitor to Bitcoin for investor attention, rose 0.6%, demonstrating that the appetite for alternative stores of value remained robust even as risk sentiment improved.
This synchronized movement across asset classes highlighted an important dynamic that has become increasingly evident in recent years: the growing correlation between cryptocurrency markets and traditional financial assets during periods of significant monetary policy shifts. While Bitcoin was originally conceived as an uncorrelated asset that would provide portfolio diversification benefits, its behavior during major macro events has increasingly mirrored that of other risk assets, particularly growth-oriented technology stocks.
Understanding the Whale Dynamics
Beneath the surface of the price action, on-chain data revealed fascinating insights into how different market participants positioned themselves ahead of Powell's speech. Most notably, Bitcoin whales – entities holding large quantities of the cryptocurrency – had been quietly accumulating during the recent downtrend. According to blockchain analytics, these major holders added approximately 16,000 BTC to their positions during the period of price weakness, suggesting that sophisticated investors saw value at lower levels and were positioning for exactly the type of policy-driven rally that ultimately materialized.
This accumulation pattern by whales deserves closer examination, as it often serves as a leading indicator for future price movements. The fact that these large holders were adding to positions while retail investors were capitulating speaks to a divergence in market sentiment that often precedes significant trend changes. The 16,000 BTC accumulation represents over $1.8 billion at current prices, demonstrating serious conviction among institutional and high-net-worth investors about Bitcoin's medium-term prospects.
The whale accumulation also highlights the maturation of Bitcoin markets. Unlike the wild speculation that characterized earlier cycles, current market dynamics show signs of more sophisticated trading strategies and longer-term investment horizons. These large holders appear to be treating Bitcoin less as a speculative vehicle and more as a legitimate asset class worthy of strategic allocation within diversified portfolios.
The Federal Reserve's Delicate Balancing Act
The enthusiasm surrounding Powell's dovish turn must be tempered with an understanding of the complex challenges facing the Federal Reserve. Some cryptocurrency strategists have sounded alarm bells, warning that a significant Bitcoin surge could potentially clash with the Fed's broader economic goals. If cryptocurrency markets experience excessive speculation leading to wealth effects that stimulate consumer spending, this could complicate the Fed's efforts to bring inflation back to its 2% target.
This concern is not without merit. The cryptocurrency market's total capitalization now exceeds $2.5 trillion, making it large enough to have meaningful macroeconomic impacts. A sustained rally in digital assets could create wealth effects that filter through to the real economy, potentially reigniting inflationary pressures just as the Fed believes it has gained the upper hand in its fight against rising prices. This dynamic creates a fascinating feedback loop where the very monetary policy easing that benefits Bitcoin could ultimately be constrained by Bitcoin's success.
Furthermore, the Federal Reserve must consider the international implications of its policy decisions. A weaker dollar resulting from rate cuts could have significant consequences for global trade and financial stability. Many emerging market economies have dollar-denominated debt, and a rapidly weakening dollar could create challenges for these nations. Additionally, other major central banks might be forced to adjust their own policies in response to Fed actions, potentially triggering a global easing cycle with unpredictable consequences.
Technical Analysis and Market Structure
From a technical perspective, Bitcoin's surge past $116,000 represents a significant development in market structure. The cryptocurrency had been trading in a descending channel for several weeks, with each rally attempt meeting selling pressure at lower highs. The Powell-induced breakout decisively violated this bearish pattern, suggesting a potential trend reversal is underway.
However, technical indicators present a mixed picture that warrants careful consideration. The Bitcoin Bull Score Index, a composite metric that aggregates various momentum and sentiment indicators, has been signaling fading momentum despite the recent price surge. This divergence between price action and underlying momentum suggests that while the immediate reaction to Powell's speech was strongly positive, questions remain about the sustainability of the current rally.
Volume patterns also deserve attention. The surge past $116,000 occurred on elevated but not exceptional volume, suggesting that while there was genuine buying interest, we haven't yet seen the kind of capitulation from bears or FOMO from sidelined buyers that typically characterizes major trend changes. This could mean that the market is still in the early stages of processing the implications of the Fed's policy shift, with more significant moves potentially ahead as participants fully digest the changing macro landscape.
Support and resistance levels have also shifted following the breakout. The $114,000-$115,000 zone, which previously acted as resistance, should now serve as support on any pullbacks. Above current levels, the next major resistance lies around $120,000, which represents both a psychological level and the site of significant selling during previous rallies. How Bitcoin behaves around these key levels in coming sessions will provide important clues about the strength of the current uptrend.
The Broader Implications for Cryptocurrency Adoption
Beyond the immediate price implications, the Federal Reserve's policy shift could have profound effects on cryptocurrency adoption and development. Lower interest rates reduce the opportunity cost of holding non-yielding assets like Bitcoin, making them relatively more attractive compared to traditional fixed-income investments. This dynamic could accelerate institutional adoption of cryptocurrencies as portfolio diversifiers.
Moreover, a more accommodative monetary policy environment could reignite interest in decentralized finance (DeFi) protocols, which had seen diminished activity during the period of rising rates. Lower rates in traditional finance make the yields available in DeFi more competitive, potentially driving renewed capital flows into these innovative financial platforms. This could create a virtuous cycle where increased DeFi activity drives demand for cryptocurrencies like Ethereum, which serves as the backbone for most DeFi applications.
The changing monetary landscape also has implications for central bank digital currency (CBDC) initiatives. As traditional monetary policy tools become less effective in a low-rate environment, central banks might accelerate their exploration of CBDCs as alternative mechanisms for implementing monetary policy. While CBDCs could potentially compete with cryptocurrencies in some use cases, they might also serve to legitimize digital currencies more broadly, ultimately benefiting the entire ecosystem.
Risk Factors and Considerations
Despite the current optimism, several risk factors could derail Bitcoin's bullish momentum. First, the Federal Reserve's commitment to rate cuts is contingent on continued progress in reducing inflation. Any resurgence in price pressures could force the Fed to maintain or even increase rates, potentially triggering another leg down in cryptocurrency markets.
Regulatory risks also remain omnipresent. While the regulatory environment for cryptocurrencies has generally improved in recent years, with the approval of Bitcoin ETFs and growing institutional participation, the potential for adverse regulatory actions remains. Any major regulatory crackdown, particularly in the United States or European Union, could quickly reverse current gains.
Geopolitical tensions represent another wildcard. While Bitcoin has sometimes benefited from geopolitical uncertainty as investors seek alternatives to traditional financial systems, extreme events could trigger broad-based risk aversion that negatively impacts all speculative assets, including cryptocurrencies. The ongoing conflicts in various regions and tensions between major powers create an environment where sudden shocks remain possible.
Technical vulnerabilities within the cryptocurrency ecosystem itself also warrant consideration. While Bitcoin's network has proven remarkably resilient over its history, the broader cryptocurrency space has experienced numerous hacks, exploits, and technical failures. Any major security breach or technical failure could undermine confidence and trigger selling pressure across digital assets.
Market Psychology and Sentiment Dynamics
The psychological aspect of the current rally deserves special attention. After months of ranging price action and failed breakout attempts, many market participants had grown pessimistic about Bitcoin's near-term prospects. The sudden reversal triggered by Powell's speech has likely caught many traders off-guard, potentially setting up a powerful short squeeze as bearishly positioned traders scramble to cover their positions.
This shift in sentiment is already visible in various metrics. Funding rates in perpetual futures markets have turned positive, indicating that traders are willing to pay premiums to maintain long positions. Social media sentiment, as measured by various analytical tools, has shifted from predominantly bearish to cautiously optimistic. The fear and greed index, which had been mired in "fear" territory for weeks, has begun moving toward neutral readings.
However, this rapid shift in sentiment also creates vulnerabilities. Markets that move too far, too fast often experience sharp pullbacks as early buyers take profits and late entrants get shaken out. The key for sustained upward movement will be whether the current rally can attract new capital from investors who have been waiting on the sidelines, rather than simply representing a reshuffling of existing positions.
The International Perspective
The Federal Reserve's policy shift has global implications that extend far beyond US borders. Other major central banks, including the European Central Bank and the Bank of Japan, will need to carefully consider their own policy stances in light of the Fed's dovish turn. This could potentially trigger a synchronized global easing cycle, which would likely be highly supportive for risk assets including cryptocurrencies.
For Bitcoin specifically, international dynamics are particularly important given its global nature. Demand from regions experiencing currency devaluation or financial instability has historically been a significant driver of Bitcoin adoption. If the Fed's rate cuts lead to dollar weakness, this could accelerate Bitcoin adoption in emerging markets as a hedge against local currency depreciation.
The Asian markets, particularly China despite its official ban on cryptocurrency trading, remain influential in Bitcoin price dynamics. Any shifts in Chinese policy toward cryptocurrencies, or changes in how Chinese investors access Bitcoin through offshore channels, could have significant impacts on global prices. The recent rally has already seen increased activity from Asian trading hours, suggesting renewed interest from this important region.
Looking Ahead: The Path Forward
As markets digest the implications of Powell's Jackson Hole speech, the path forward for Bitcoin appears more constructive than it has in months. The combination of potential monetary easing, continued institutional adoption, and improving regulatory clarity creates a favorable backdrop for digital assets. However, the journey is unlikely to be smooth, with volatility remaining a defining characteristic of cryptocurrency markets.
The September Federal Open Market Committee meeting looms large on the horizon. While markets have largely priced in a rate cut, the magnitude of the cut and the Fed's forward guidance will be crucial in determining whether the current rally has legs. A more aggressive easing stance than currently expected could propel Bitcoin toward new all-time highs, while a more cautious approach might lead to some near-term disappointment.
Beyond monetary policy, several other catalysts could influence Bitcoin's trajectory in coming months. The continued development of the Lightning Network and other scaling solutions could enhance Bitcoin's utility as a payment method. Growing environmental consciousness and Bitcoin mining's increasing use of renewable energy could address one of the persistent criticisms of the cryptocurrency. Additionally, further institutional adoption, particularly from major corporations adding Bitcoin to their treasury reserves, could provide fundamental support for prices.
Conclusion: A Pivotal Moment in Bitcoin's Evolution
The surge past $116,000 following Jerome Powell's dovish signals represents more than just another rally in Bitcoin's volatile history. It potentially marks a pivotal moment in the cryptocurrency's evolution from speculative asset to recognized component of the global financial system. The fact that Federal Reserve policy now has such direct and immediate impacts on Bitcoin prices underscores how integrated cryptocurrencies have become with traditional financial markets.
For investors and observers, the current environment presents both opportunities and challenges. The potential for significant gains exists, particularly if the Federal Reserve follows through with monetary easing and the global economy achieves the sought-after "soft landing." However, the risks remain substantial, and the cryptocurrency market's inherent volatility means that dramatic reversals remain possible.
What seems clear is that Bitcoin has successfully weathered another period of adversity and emerged with renewed momentum. The quiet accumulation by whales during the recent downturn, followed by the explosive response to Powell's speech, demonstrates that demand for digital assets remains robust among sophisticated investors. As the financial world continues to evolve and adapt to technological innovation, Bitcoin's role appears increasingly assured, even if its exact price trajectory remains uncertain.
The coming weeks and months will be crucial in determining whether this latest surge represents the beginning of a new bull cycle or merely another rally within a broader consolidation phase. What is certain is that Bitcoin continues to capture the imagination of investors worldwide, and its correlation with macro policy decisions ensures it will remain at the center of financial market discussions for the foreseeable future. As traditional monetary policy reaches its limits and financial innovation accelerates, Bitcoin stands ready to play an increasingly important role in the global financial ecosystem, with the $116,000 level potentially representing just another milestone on a much longer journey.

BTCZ looks very interesting RIGHT NOWBTC looks like it had a decent day, but just like everything that goes up, it must come down. The technicals look ripe to drop (candle length, wick, crossing 9SMA etc.) and signals UltraShort show weakness (clearly seen here). Easy trade!

BTC testing key liquidity zones with bullish divergence but rejeOn the 4H chart, BTC recently showed a clear bullish divergence that sparked an upward move. The current structure points toward a favorable liquidity zone between 120k and 118k, but the real test lies at the 122k level. If BTC can hold above 122k, momentum could continue, but failure to sustain will likely bring a rejection back near 119k. With the weekend approaching and typical sell pressure often kicking in around Monday or Tuesday, traders should stay cautious. Longs from lower levels are looking good, but this is not the moment to expect a fresh all-time high. Watch the liquidity flips and manage positions carefully.
BITCOIN PREDICTION: PUMP TO $135K STARTING???! (Buy Now?) Yello Paradisers! In this video, I'm sharing with you the high time frame chart, the double shooting star candlestick pattern, double top formation, bearish divergence that needs to be confirmed, and its channel that we are trying to break to the downside. High time frame chart, I'm sharing with you the ABC zigzag and the potentiality of that C move being already finished. If not, the previous low needs to hold, and we are looking at things on a medium time frame. The bullish things on a medium time frame are the bullish divergence, and on a low time frame chart, the Elliott wave count that seems to be completed to the downside. If the previous low is going to hold, we are starting a new impulse towards $129,000 as a higher degree third wave. Then we will have a fourth wave, and the final fifth wave will take us towards $135,000. Watch the video where I'm explaining all the confirmations and the price action dynamics, and how we will be developing with the highest probability.
Paradisers! Keep in mind to trade only with a proper professional trading strategy. Wait for confirmations. Play with tactics. This is the only way you can be long-term profitable.
Remember, don’t trade without confirmations. Wait for them before creating a trade. Be disciplined, patient, and emotionally controlled. Only trade the highest probability setups with the greatest risk to reward ratio. This will ensure that you become a long-term profitable professional trader.
Don't be a gambler. Don't try to get rich quick. Make sure that your trading is professionally based on proper strategies and trade tactics.

BTC Warning: Hidden Signals Before October’s Big Move!Right now, I’m leaning a bit bearish on BTC. Why?
I’m spotting a bearish divergence both on the daily and weekly timeframe.
Volume has also been drying up, which makes the move look a bit weak.
And historically… September tends to be shaky before October kicks in with that bullish momentum.
That said, I’ve marked key support zones in case BTC decides to dump before a bounce:
🔴 112,770 (0.236 Fib) – first line of defense
🟠 105,455 (0.382 Fib) – solid support zone
🟢 99,543 (0.5 Fib) – critical level to hold
🔵 93,631 – 92,028 (0.618–0.65 Fib) – last strong demand zone
So if BTC wants to test liquidity, these are the areas I’m watching closely.
👉 What do you guys think? Are you also seeing the same bearish signs, or do you think BTC skips the dump and runs straight into October bullish?
Drop your thoughts below ⬇️ and hit that follow if you’re tracking BTC moves with me. Let’s ride this market together. 💯
