BTC preparing for run to 150k technical tp on higher timeframeTechnical analysis indicating "measured move" buy setup on higher timeframes
I expect price to advance from current 88-93k buy zone (consolidation structure on 4 hr tf) back to new highs above 109k, which was previously noted as tp1 (with anticipated near term consolidation in low 90k range). It's possible we have one more retest of 88-93k levels after reaching 108-110k level on next buy wave, but as previously noted, it primarily remains a buy opportunity.
Once a move above 120k is achieved, price will be strongly in the hands of buyers (with diminishing supply) and head towards 150-155k level fairly steadily & easily to achieve technical "measured move" target.
There remains possibility that we get one final retracement from 150k but my own cycles analysis indicates that would be the final big discount opportunity IF it were to occur at all.
Price advancement above 100k is a SIGNAL that mass adoption is taking place globally and will lead to much higher highs. Any price dips below 100k remain discounts for institutional ownership
Bitcoinprice

"BTC Alert: Sellers Dominate Until the Price Hits the Bottom!"BINANCE:BTCUSDT
COINBASE:BTCUSD
📈Which side you pick?
Bulls or Bears
Bitcoin (BTC) is currently forming a repetitive pattern. 📈 The price will test the identified support at the bottom of the channel, which could drive the price down toward the 86K-88K level. 📉
If the price drops below 92K, we may see a more significant decline into the 84K range, possibly accompanied by a long shadow reaching the 80-82K area (highlighted in red). 🔻🔍
🧐The Alternate scenario:
If the price stabilizes against the direction of the position below or above the trigger zone (92K), the setup will be canceled.

BTCUSD Rejected its Daily SupportHello Traders
In This Chart BTCUSD HOURLY Forex Forecast By FOREX PLANET
today BTCUSD analysis 👆
🟢This Chart includes_ BTCUSD market update)
🟢What is The Next Opportunity on BTCUSD Market
🟢how to Enter to the Valid Entry With Assurance Profit
This CHART is For Trader's that Want to Improve Their Technical Analysis Skills and Their Trading By Understanding How To Analyze The Market Using Multiple Timeframes and Understanding The Bigger Picture on the Charts

bitcoin price bounce on January 14th @ 89377 USDTbitcoin will bounce from the green line on January 14th where you see the green heart.
that line is close to an important fib level. but it also shows that on november 18th, price retested november 11th's high, which is also on that line.
on november 18th planet Venus travelled between 14-15º of Sagittarius.
on January 14th Budha (Mercury) will reach that point.
there is more information on the January 14th bounce in the book SHININGBULL 2025
BINANCE:BTCUSDT
BTC - 1H PulllbackBitcoin has formed a bearish descending channel following a sharp bearish spike, indicating continued downward momentum. Currently, the price is showing signs of recovery and may rise towards the channel base around the $97,000 resistance zone.
This resistance zone, marked by previous rejections and high selling pressure, is a critical area to monitor. It offers a potential opportunity to enter short positions if rejection signs are observed, with expectations of further declines from that zone.
Traders should remain cautious and wait for confirmation of price action at the resistance before entering positions. Both bullish retracements and potential rejections at resistance offer opportunities for strategic trades. 🚀

Recency Bias: Your Brain’s Worst Trade Idea Ever!Let’s face it: your brain is out to sabotage your trading, and recency bias is its weapon of choice. This sneaky psychological gremlin convinces you that your last few trades—good or bad—are all that matter. But spoiler alert: they’re not.
🎲 What is Recency Bias?
Recency bias is your brain’s tendency to overvalue recent events and ignore the bigger picture. Three wins in a row? You’re invincible, right? WRONG. Three losses? Time to ditch your strategy? ALSO WRONG. The market doesn’t care about your streak—it plays the long game, and so should you.
💀 How It Destroys You
1️⃣ Winning Streak Confidence: After a few wins, you start upping your risk like you’re Warren Buffet. Then BAM—one loss wipes you out.
2️⃣ Losing Streak Paralysis: A few losses, and suddenly you’re too scared to pull the trigger, even on solid setups.
3️⃣ Revenge Trading: The currency pair that burned you? Oh, you’ll “get it back,” right? Nope. You’ll just lose more.
🛡️ How to Beat It
1️⃣ Reset Daily: Clear your head before every session. Meditate, walk, scream into a pillow—whatever works.
2️⃣ Stick to Your Plan: Your strategy works because it’s tested, not because your emotions say so.
3️⃣ Journal Everything: Spot your patterns before they wreck you.
4️⃣ Manage Risk: Winning or losing streaks shouldn’t change your position size. Period.
5️⃣ Check Your Ego: The market isn’t out to get you. It doesn’t even know you exist.
🧠 Final Words
Recency bias is a sneaky little troll, but with self-awareness and discipline, you can shut it down. Remember: your last trade doesn’t define you—your consistency does.
Now stop letting your brain gaslight you and go trade like the pro you were meant to be. 🚀

BTC, TON, SOL - Heavy LONG!If you’re looking for a potential entry point, BTC, TON, and SOL are currently highlighting the same compelling pattern, making a strong case for a long position. Let’s analyze the technical and fundamental factors suggesting an upward reversal could be imminent for all three assets.
Fundamentally Strong Assets
Every trade begins with solid fundamentals, and BTC, TON, and SOL all exhibit strong intrinsic value. This makes them strong candidates for recovery after recent volatility. Aligning technical indicators with their fundamental strength increases the likelihood of success.
Significant 3-Day Drop
Each asset has experienced a sharp decline over the past three days, signaling potential overselling. Such rapid drops often push assets into undervalued territory, creating an opportunity for a significant bounce, especially when paired with key support levels.
Triple-Tested Support
All three assets have tested their support levels three times, solidifying these zones as strong foundations. Multiple tests without a breakdown often signal a potential reversal, as sellers struggle to push prices lower.
Outside Bollinger Bands
Currently, BTC, TON, and SOL are trading outside their lower Bollinger Bands, a classic indicator of oversold conditions. This suggests that bearish momentum is waning, with a likely return toward the center of the bands.
Below All Major Moving Averages (MAs)
Prices for all three assets are sitting below their 50 MA, 100 MA, and 200 MA. While this might initially appear bearish, it also indicates they are in extreme positions, primed for a rally when momentum shifts.
MACD and RSI Signal a Reversal
MACD and RSI for BTC, TON, and SOL are signaling bullish momentum:
• MACD: Showing signs of convergence or a potential crossover, often a precursor to upward movement.
• RSI: In oversold territory, indicating undervaluation and readiness for recovery.
Too Many Bullish Factors to Ignore
With these overlapping patterns, BTC, TON, and SOL present rare alignment across both technical and fundamental indicators.
• Timeframe: Can be short-term or long-term, depending on your strategy. For TON, Solana you can also invest in its ecosystem and utilize DCA strategies for risk management.
• Target: 100% potential gain.
• Position Details: Entered with Binance x25 leverage, $30 margin, total size of $770.
• Risk Level: Medium, provided you’re ready to apply DCA for better control over your position.
This confluence of signals creates a high-conviction trade opportunity. Are you ready to take advantage of it?
But be cautious! This is still just gambling :)

Bitcoin - live or die? Bitcoin bull is trying hard to defend the previous month/week low around 91,000 region. If a daily candle closes below that line, all momentum indicators are likely to enter the bear territory. In that case, I have to accept the probability that the price can come down as low as 73,000 area (Fib 0.618).
But my bias for Bitcoin is still upside so I am going to wait for an entry position to buy more. I will wait for the daily MACD lines and RSI lines to cross and close above the descending trendlines in the bull territory. Horizontal lines are more reliable than ascending/descending trendlines on a price chart, but when I see clear highs and lows in the momentum indicators (4H, daily, and weekly), I draw a trendline and wait for the line to get broken. It often works really well to identify a good entry point.

BTC head and shoulders? (-.-)To me, this head and shoulders has many issues such as not being symmetrical, no actual head and a weak looking left shoulder.
We haven't even touched the neckline yet and people are freaking out about it.
If anything a better light to reframe this in is a potential triple topping pattern. That makes more sense than any kind of buzz word pattern we're forcing a bias onto the chart when it's not even fulfilled. If the neckline doesn't break, it's not a fulfilled pattern.

Bitcoin | How to Master Ranges ?In our latest analysis ( BTCUSDT.P: Liquidation of Highly Leveraged Longs ) about ranges we had concluded that high leveraged longs would be liquidated, this was due to the belief of the indicators (cdv, volume footprint, etc.) that there were buyers.
However, the lack of buyers in the current picture is a big problem, the data currently says so, but the data is not stable, it can change, you can follow this from volume footprints, cumulative delta volume, liquidation heatmaps. If you do not know how to use these, you can visit my profile, you can contact me, I explain how I use all these tools completely free of charge.
My opinion today is that the price will sell nicely from the red line and the decline will deepen, and everyone who follows me knows that I have been repeating this opinion since $103,000.
I keep my charts clean and simple because I believe clarity leads to better decisions.
My approach is built on years of experience and a solid track record. I don’t claim to know it all, but I’m confident in my ability to spot high-probability setups.
If you would like to learn how to use the heatmap, cumulative volume delta and volume footprint techniques that I use below to determine very accurate demand regions, you can send me a private message. I help anyone who wants it completely free of charge.
My Previous Analysis
🐶 DOGEUSDT.P: Next Move
🎨 RENDERUSDT.P: Opportunity of the Month
💎 ETHUSDT.P: Where to Retrace
🟢 BNBUSDT.P: Potential Surge
📊 BTC Dominance: Reaction Zone
🌊 WAVESUSDT.P: Demand Zone Potential
🟣 UNIUSDT.P: Long-Term Trade
🔵 XRPUSDT.P: Entry Zones
🔗 LINKUSDT.P: Follow The River
📈 BTCUSDT.P: Two Key Demand Zones
🟩 POLUSDT: Bullish Momentum
🌟 PENDLEUSDT.P: Where Opportunity Meets Precision
🔥 BTCUSDT.P: Liquidation of Highly Leveraged Longs
🌊 SOLUSDT.P: SOL's Dip - Your Opportunity
🐸 1000PEPEUSDT.P: Prime Bounce Zone Unlocked
🚀 ETHUSDT.P: Set to Explode - Don't Miss This Game Changer
🤖 IQUSDT: Smart Plan
⚡️ PONDUSDT: A Trade Not Taken Is Better Than a Losing One
💼 STMXUSDT: 2 Buying Areas
🐢 TURBOUSDT: Buy Zones and Buyer Presence
🌍 ICPUSDT.P: Massive Upside Potential | Check the Trade Update For Seeing Results
🟠 IDEXUSDT: Spot Buy Area | %26 Profit if You Trade with MSB
📌 USUALUSDT: Buyers Are Active + %70 Profit in Total
🌟 FORTHUSDT: Sniper Entry +%26 Reaction
🐳 QKCUSDT: Sniper Entry +%57 Reaction
I stopped adding to the list because it's kinda tiring to add 5-10 charts in every move but you can check my profile and see that it goes on..

Crypto Alpha Report - January 08, 2025Happy Wednesday, friends! Today, I want to discuss the discipline necessary to consistently succeed in this market.
It’s Wednesday morning, and I’ve been up since 5 am. I’ve worked out, showered, breakfasted, cared for my kid, and am already about an hour into my work day. I have a clear idea of what capital rotations I will make and what trades I’m considering putting on, and I’ve consumed my morning data.
I don’t tell you this to toot my own horn. I’m showing you an example of what efficiency looks like, of what discipline looks like. Many mornings, I just want to stay in bed, not hit the weights, not hit the charts, and not read another newsletter. I don’t get out of bed because I want to but because I’ve made it a moral imperative.
That was the trick to re-wiring my brain. Focus less on being “disciplined” and instead, make self-improvement and being consistent a moral issue for myself. That seemed to do the trick for me, as I have had a long history of battling depression and apathy.
There’s no such thing as overnight success (at least long-lasting). Consistent results come from consistent inputs. You have to put in the work to be successful. I don’t find a trade every day, hell, most days. But the fact that I put in the time in front of my computer every day means that when an opportunity does come in front of me, I’m prepared to act on it with conviction.
We’ll talk about conviction in tomorrow’s newsletter, but for today, let’s stick to discipline.
To be a successful trader, you must put in the time every day. In the beginning stages, it will be about learning and backtesting. You need to carve out at least 1-2 hours per day to do it. You will have to sacrifice other things you want to do. But if you want this, you must make time to become good at it. That will only come with consistently putting in the time.
If you want to start playing guitar, you won’t be so great in the beginning. But one hour of practice a day and after a few months, you won’t be so terrible. After two years, you’ll be jamming and the center of joy for the campsite (assuming your singing voice isn’t awful).
It’s the same with trading and investing. Whether you want to full portfolio high conviction plays 1-2 times per year or risk 2% taking 2-3 trades per week, whatever your strategy or edge is, the market will not reward you if you don’t put the time in.
Make this the year of buckling down, concentrating your efforts, and making this a serious occupation, not just a moonshot hobby.
Onwards and upwards, friends!
Crypto Market Update
Stablecoin Dominance
A continued movement up from this metric, +1.45% today. Daily momentum is still turned to the upside; however, we remain on a bearish trend with negative momentum—resistance at 5.96% of MC. This is a potential early warning sign of lengthier consolidation, but we’re currently just oscillating around the current Point of Control and the previous local high.
Bitcoin + Stablecoin Dominance
After three days of advance, this metric puts in a Doji indecision candle. Since we saw stablecoin dominance increasing, capital is rotating into altcoins. This is a good early sign of altcoin recovery moving forward.
Altcoin Performance Relative to Bitcoin
This metric is down -0.83% today, conflicting slightly with our previous metric. Potentially putting in a Hammer Reversal Candle, indicating buyers are beginning to step back into altcoins on this dip.
Bitcoin
Bitcoin continued to sell off throughout the night and early morning. However, buyers have stepped in and front-run support at $93,000. I do not expect Bitcoin to break down from our current trading range of $92,000 - $103,000 until January’s catalysts are out of the way.
Trends
5M: Bearish
30M: Bearish
1H: Bearish
4H: Bullish
D: Bullish
W: Bullish
While Bitcoin remains in a bearish short-term trend, Bullish Divergence is printing on the 30M and 1H timeframe, with 4H Volatility, maxed out and nearly oversold. Bitcoin is also now trading above daily VWAP, with a prolonged period of consolidation from $94-$95,000. Expecting either a recovery move upwards, however, it is still likely to re-test the range lows again.
Key Levels
POC: $93,637
VWAP: $95,768
Value Area High: $96,540 - $97,282
Value Area Low: $94,253 - $94,995
Next Liquidity Zone Above: $96,313 - $97,198
Next Liquidity Zone Below: $93,258 - $94,126
Bitcoin is showing substantial bullish divergence in both the 30M and 1H timeframes and some buying strength. There is potential for some recovery today. However, I still expect us to test range lows before making another push for $100,000 or even a bigger breakout, depending on January’s catalysts.
Strategy:
6/10 Conviction that we push up today. I wouldn’t structure a trade here with tight invalidation. Indeed, I think it’s likely we will test $91,000 - $92,000 before pushing back up significantly like we saw moving into Monday morning. Bitcoin is in a consolidation pattern, trading in a wedge formation, and it will likely be later in January that we get a resolution. I expect buyers to keep price above $90,000 until Trump’s inauguration; there’s just too much potential juice left in the market. I would focus on building a swing position to the upside over the next couple of days.

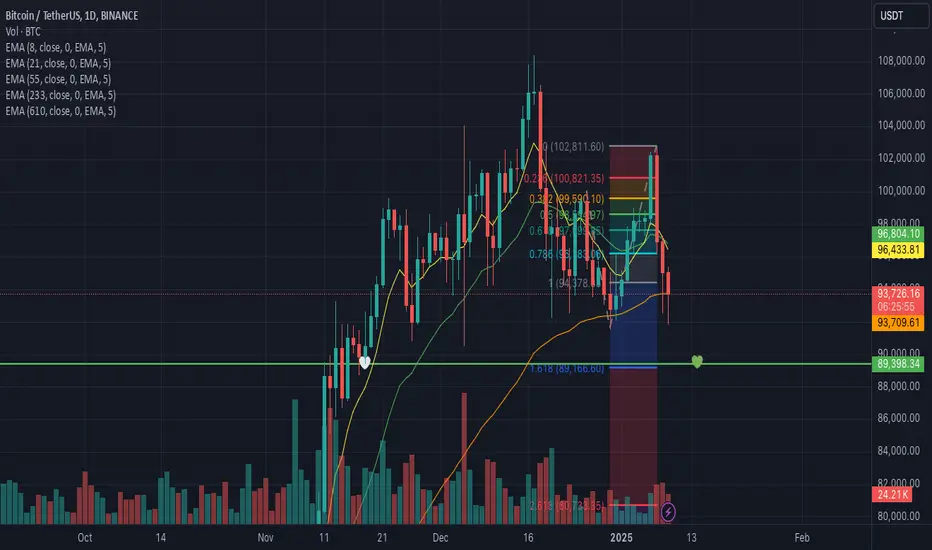
Bitcoin (BTC/USDT) – Daily Analysis UpdatePrice Action Recap:
Yesterday, Bitcoin was rejected near $102,500, causing a retracement to the current level around $96,000.
The inability to clear the $100,000–$102,500 resistance zone has kept BTC under short-term bearish pressure.
Key Levels to Watch:
Resistance Zones:
$100,000–$102,500: Critical level that needs to be breached to resume the uptrend.
A rejection here could attract more selling pressure and lead to additional downside testing.
Support Zones:
$91,000–$93,000: Immediate support area that bulls must defend to prevent further losses.
$85,000–$87,500: A significant horizontal support zone that coincides with prior consolidation areas and could attract strong buying interest if tested.
Market Implications:
A failure to reclaim $100,000–$102,500 would maintain downward momentum and weaken confidence in the short-term bullish case.
Altcoins are particularly vulnerable during BTC’s downward moves, as dominance often rises in such scenarios, draining liquidity from alternative assets.
Outlook:
Bullish Scenario: A decisive break and daily close above $102,500 would signal renewed strength, opening the path to retest $110,000–$112,000.
Bearish Scenario: A breakdown below $91,000–$93,000 could accelerate selling, targeting the $85,000–$87,500 zone as the next major support level.
Conclusion:
The $100,000–$102,500 resistance zone is pivotal for Bitcoin’s near-term direction. Bulls need to reclaim this range to reignite upward momentum. Failure to do so will likely result in a test of lower support zones, where a reaction will determine the broader trend.

How to nail BTC flash crashes and see into the future!The most accurate analyst on TView is back!
The only one who calls black swan events before they happen, calls bottoms on the day they happen and calls flash crashes hours before they occur, is back on TView.
Yesterday I posted this privately:
Left chart yellow arrow shows everytime the right chart USDT Dominance hit the green trendline.
Break down below red line on RSI and the green trendline on chart for USDT.D should take BTC to yellow line or red line above on left chart. Bounce off these lines on USDT.D chart and BTC trade would be a short right now.
I have closed the short trade now based off another chart which I won't show here. If I show this other chart publicly it will get invalidated as it is a fractal showing every move BTC has made for the last 6 weeks including yesterdays flash crash.
Seeya soon for more alpha analysis!

Don't fumble the red flags, we are not out of the woods yet.When analyzing cryptocurrency markets, maintaining a neutral and impartial perspective is crucial. Having an optimistic bias will have you fumbling all the red flags and focusing only on information that supports your hopes and dreams.
Currently, two main theories are shaping the discussion around Bitcoin's price action:
Wave 4 has been completed, and we are now entering Wave 5 or;
The market is still in a corrective phase.
Let me know what you think, would love to hear your thoughts. Let’s delve into the two scenarios in detail.
Theory 1: Wave 4 is Complete, and We Are Entering Wave 5
This theory is that Bitcoin has finished an ABC corrective wave and is poised for an upward move into Wave 5. A confirmed Wave 5 would be indicated by a price break above the previous Wave 3 high at $108,705. Until then, we remain in speculative territory.
The Positives:
The Stochastic Oscillator on the daily timeframe is in a favorable position.
On the weekly chart, the Stochastic has exited the overbought region and is moving toward oversold territory.
The Negatives:
The current correction appears shallow and short-lived, failing to even retrace to the 0.386 Fibonacci level.
Historically, 70% of Wave 4 corrections retrace between the 0.386 and 0.618 Fibonacci levels.
I would prefer that the weekly Stochastic RSI had a bullish crossover in the overbought region.
During the last bull run, the Wave 4 correction lasted three months and corrected nearly to the 0.618 Fib level. Bitcoin Dominance collapsed during the Wave 4 correction, signaling the start of an altcoin season. While history doesn’t have to repeat itself, we have only corrected for 3.5 weeks and bitcoin dominance is still high, these anomalies raise concerns until the $108,705 resistance is breached.
Theory 2: The Market Is Still Correcting
In this scenario, the Zig-Zag correction we’ve observed may represent the first impulse (Wave A) of a larger ABC correction. If this is the case, the market could experience:
Wave B: A brief upward impulse.
Wave C: A downward move to lower price targets.
Key Observations:
A more extended and deeper correction would align with historical patterns, potentially creating a stronger foundation for future growth.
If this plays out, we may see Bitcoin Dominance collapse, paving the way for an altcoin season to rise alongside Bitcoin’s eventual Wave 5.
Conclusion: Watching $108,705 Is Key
The confirmation of Wave 5 hinges on Bitcoin breaking the $108,705 resistance level. Until that point, it’s essential to remain cautious and consider both possibilities. Whether we are on the verge of a new bullish wave or navigating a deeper correction, understanding the broader market context will help investors make informed decisions.
My bets though are on Theory 2, what do you think?

"BTCUSDT Alert: Short Signal Activated at the Hunt Level!"BINANCE:BTCUSDT
COINBASE:BTCUSD
📈Which side you pick?
Bulls or Bears ----> Quick help: look at Negan's bat!
SL1 ---> Low-risk status: 1x-2x Leverage
SL2 ---> Mid-risk status: 3x-4x Leverage
(If there is just one SL on the chart, I suggest, low risk status)
As you can see, Bitcoin (BTC) is currently forming a repetitive pattern. 📈 When the price pulls back to the identified resistance level, we can expect another bearish move, which could potentially drive the price down toward the 92K level. 📉
If the price drops below 92K, we may see a more significant decline into the 88K-84K range, possibly accompanied by a long shadow in a recent candle pattern. 🔍
👾Note: The setup is active but expect the uncertain phase as well. also movement lines drawn to predict future price reactions are relative and approximate.
➡️Entry Area:
Yellow zone
⚡️TP:
96,779
95,247
93,254
🔴SL:
101,826
🧐The Alternate scenario:
If the price stabilizes against the direction of the position, below or above the trigger zone, the setup will be canceled.

BTCUSDT: Elliot Wave End of 5 WaveHello friends. According by Elliot Wave theory I see the end of 5th wave and we are in correction waves as ABC .So with rising the price better than for sell don't try to buy .

Crypto Alpha Report - January 7Happy Tuesday, friends! With the current AI Agent narrative likely leaving your heads spin as you scramble to deploy capital, let’s reflect on how to truly make money consistently in this market, regardless of what the meta is.
Well, what’s the secret? Scrolling X all day and night? Buying whatever your favorite influencer shills? Listening to every Bankless podcast to keep up on the current alpha?
While all of those things can sometimes get you into profitable positions, if you can’t define your strategy to me within 60 seconds, you are unlikely to achieve long-term success in this market.
Countless cryptocurrencies will go up and come down. You do not, nor does anyone, have the capacity to be involved in every successful project. You only have so much time in the day. You must narrow your focus. You must narrow your entry and exit conditions. You need, in short, an actual strategy.
Trading without a strategy is riding turbulent waves of emotions: utter joy when your portfolio goes up, utter terror and uncertainty when it goes down. Inevitably, you will make emotional, impulsive decisions on whether to buy or sell, often determined by others’ “alpha.”
There is no single successful trader out there who outsources their decision like this. Every successful trader I’ve met and interviewed can define their strategy within 60 seconds. That doesn’t mean the strategy has to be simple, but it has to be definable and actionable.
Example: “I monitor high-volume projects fitting the current meta-narrative. I then wait for a bullish MA cross on the 1H timeframe and go in with x profit target and x stop loss. My win rate is X. My average win per win is X. My average loss per loss is X.”
There could have been a few more sentences to describe the entry and exit conditions; some traders don’t use hard stops or profit targets and instead rely on alerts or technical signals. There’s nothing wrong with this. But your strategy needs to, in essence, be quantifiable like this. Otherwise, you’re just randomly buying and selling. Your strategy is luck. Unfortunately, this market does not reward those who depend on luck; it rewards those who put in the hard work.
If you know you’re just relying on luck, I challenge you. Spend one week trading a simple strategy. It can be on Bitcoin, on any timeframe, or Solana meme coins. I don’t care. Just sit down and define a strategy. If you can’t be bothered, I’ll supply you with one.
1H Timeframe: Bullish EMA Cross - 21/55. Your buy condition is active when the 21 EMA crosses over the 55 EMA. That’s your overall “we can buy” signal.
Entry Signal: 5-Minute Timeframe: Buy when the 5-minute RSI is oversold (below 30%).
Exit Signal: 5-Minute Timeframe: Buy when the 5-minute RSI is overbought (above 70%).
Sell at a loss if the One-Hour 21 EMA crosses below the 55 EMA.
It is a simple technical strategy that works very well in bull markets. I’m not promising you’ll make money, but you have a good chance to. But I want you to focus on your mental and emotional state over the week of this challenge. You will notice how in control you feel and how calculating you become. You will no longer be gripped by anxiety or a feeling of missing out. You will simply be waiting for your opportunities. Ultimately, you can reflect on what went well, what went wrong, and how you could improve. This is the mindset I want you to carry forward because once you start trading with a strategy, you’re unlikely to look back.
Onwards and upwards, friends!
Crypto Market Update
Stablecoin Dominance
There is a sizeable move up in this metric today, +4.80%. Daily Momentum returned to the upside after our momentum oscillator neared -2.00% conditions. This metric is still in a downtrend, and we need to see a significant market pivot to reverse that trend.
Bitcoin + Stablecoin Dominance
A movement up of 0.35%, so we know this movement is dominated mainly by the significant increase in Stablecoin Dominance. In other words, there is a big glut of profit taking on Bitcoin. It's still in a bearish trend.
Altcoin Performance Relative to Bitcoin
Altcoins are also taking a slight hit today, as this metric is down by -0.55%. Still in a bullish trend, so I still expect altcoins to perform favorably.
Bitcoin
Bitcoin is experiencing a lot of profit-taking today, as traders capitalize on the ‘Bull Trap’ zone above $100,000.
Trends
5M: Bearish
30M: Neutral
1H: Bullish
4H: Bullish
D: Bullish
W: Bullish
Significant selling pressure has caused Bitcoin to lose its lower timeframe bullish trends. Although the selling today was quite dramatic, there’s not too much concern for alarm technically. Daily and Weekly bullish trends remain intact, with trend support from $92,000 - $94,000. The 4H chart suggests ranging price action, oscillating around the 4H 200 SMA. A higher low above $94,000 would confirm a local bottom and a second push above $100,000 - likely beginning to form a bottom within the next few days.
Key Levels
POC: $93,637
VWAP: $99,514
Value Area High: $101,524 - $103,455
Value Area Low: $95,570 - $97,500
Next Liquidity Zone Above: $100,400 - $101,120
Next Liquidity Zone Below: $95,499 - $95,770
The bottom shelf of the Liquidity Zone Bitcoin currently trades in terminates at $96,331. There is a void in liquidity slightly below that at $95,900. The first group of buyers have stepped in on Bitcoin between $97-$98K.
Strategy:
Significant liquidity was just tapped, as stops below $97,500 support just got taken out. There is potential to see a short-term bounce to $99,000; however, that’s a much higher risk. Catching falling knives is dangerous, particularly with Bitcoin.
Big picture: a higher low above $94,000 is necessary for continued price appreciation throughout the next week in January. This is a bit early cycle-wise to expect a reversal in Bitcoin’s price; we currently estimate that early January should be bullish for Bitcoin - however, rules exist to be broken.
Regardless, our first limit fill at $97,000 was just filled, and we have an additional order at $96,000. Our target for BTC in January is $105-108,000.

Bitcoin Struggles to Cross the 105k Barrier
The price has once again returned to the 98K zone, experiencing a nearly 4% drop in the last few hours and erasing the bullish pressure seen over the past four sessions.
Lateral Range: Neutrality persists between the resistance at 105k and the support at 91k, with oscillations failing to break these levels since late November 2024.
$105k: A nearby resistance zone crucial for the previous upward trend. A breakout above this level could reinforce the bullish outlook.
$91k: A key support zone that has twice prevented the formation of a new and fresh downward movement. Oscillations below this level could jeopardize the accelerated trend that BTC exhibited towards the end of 2024.
MACD: The indicator's histogram remains oscillating below the 0 level, demonstrating stronger bearish impulses that dominate the market. Oscillations very close to 0 could increase neutrality, making it challenging to break the current lateral range anytime soon.
-JP


How would you react if Bitcoin hit $115,000 this month?Hello and greetings to all the crypto enthusiasts, ✌
In several of my previous analyses, I have accurately identified and hit all of the gain targets. In this analysis, I aim to provide you with a comprehensive overview of the future price potential for Bitcoin , 📚🎇
The answer to this question can largely be considered affirmative. After the typical holiday slowdown, which often results in short-term price declines, we are now observing a fresh influx of volume into the crypto market. This increased activity signals renewed investor interest and is inherently a bullish indicator, suggesting potential price rises in the near term. Such a trend could pave the way for Bitcoin to reach new all-time highs (ATH) once again. 📚✨
From a technical analysis perspective , the charts are also showing strong support levels, further reinforcing the likelihood of continued upward momentum. These support levels act as a solid foundation for future price growth, and if this trend continues, it could lead to significant gains in the coming weeks or months. 📚🎇
🧨 Our team's main opinion is: 🧨
After the usual holiday dip, we're seeing fresh volume entering the crypto market, which suggests price increases and potential new all-time highs for Bitcoin. The technical charts also show strong support, signaling further upward momentum ahead.
Give me some energy !!
✨We invest countless hours researching opportunities and crafting valuable ideas. Your support means the world to us! If you have any questions, feel free to drop them in the comment box.
Cheers, Mad Whale. 🐋

Crypto Alpha Report - January 06Happy Monday, friends! In today’s issue, I want to cover the grind and the mindset necessary to succeed in 2025.
Love it or hate it, you are not a computer. You are a biological meat bag filled with swirling hormones, fluids, and organic components. While many of us favor philosophy, the pursuit of truth/wisdom, and self-improvement, we’re still hindered by our biology regarding stress, anxiety, motivation, and discipline.
You see, the answers don’t all live up in your mind. The answers often live inside your body. There will be days you don’t want to trade, days you don’t want to backtest, and days you don’t want to scan the markets. While being kind to ourselves is essential, it’s equally important not to let poor planning and overreliance on our “feelings” dictate our actions.
Just as it is essential to set clear profit targets and goals for our trades and investments BEFORE entering a position, it’s equally important to set a pre-planned schedule and routine for our trading and investment activities.
Too often, I would wake up early and be excited to get to the markets. I would log onto my computer and immediately consume all of my alpha newsletters, telegram & discord chats, and then start scrolling X searching for Alpha. Before I knew it, it would be the afternoon, and while I “felt” like I had done something productive for my trading account, I hadn’t done a thing but scroll social media.
Knowledge without action is pointless. It doesn’t do you a bit of good to listen to a long podcast about motivation if you don’t use that knowledge to make any fundamental changes in your life. Similar in crypto, while it’s helpful to have a baseline knowledge of the ecosystem, at the end of the day, we’re not working in the marketing department for any project or giving long lectures or TED talks about cryptocurrency evangelism. We’re here to make money.
Researching all these new projects and trading strategies isn’t helpful if it doesn’t inspire direct action. You will be much more sane AND profitable if you restrict your knowledge-gathering activities to more actionable intel.
There’s only so much time in the day, and you can’t be good at everything. It is better to niche down, focus on what you’re going to trade, and focus on the chains you’re holding positions on than to get spread too thin knowing a little bit about a lot.
Here’s to niching down for riches in 2025 friends.
Crypto Market Update
Macro
Stablecoin Dominance
A nice clean breakdown from our consolidation area and a Lower Low. Happy days for altcoin holders. Our portfolios are up nicely because of it. This metric is getting close to being oversold, so I expect a corrective move up to re-test the breakdown point of 5.75% within the next 3-5 days. Use this metric to take short-term profits on higher-risk, lower-conviction positions.
Stablecoin + Bitcoin Dominance
This metric got oversold over the weekend, and today, it is putting in a nice bounce. As we already saw that Stablecoin Dominance is down, we know this is purely capital rotation back into Bitcoin, as people are beginning to finally buy back into Bitcoin with some size and conviction and dump stables.
Altcoin Performance Relative to Bitcoin
This metric is taking a hit today as altcoins pull back as capital rotates back into Bitcoin. This pullback will likely last a few more days, so there is an opportunity to cycle altcoin gains back into Bitcoin until this metric stabilizes. However, you can also hold your altcoin positions as this metric is still in an uptrend, and the long-term potential for overperformance is very high.
Bitcoin
Bitcoin had a beautiful day today, successfully reclaiming $100,000. We have regained bullish momentum on all timeframes and should continue to see overall price appreciation dominating throughout the week. Expect prices to pull back this weekend into early next week in anticipation of the Interest Rate print coming out on the 15th, but should that print be positive, we should rally into Trump’s inauguration.
Trends
5M: Bullish
30M: Bullish
1H: Bullish
4H: Bullish
D: Bullish
W: Bullish
Bitcoin has successfully regained its bullish trend in all timeframes. The 1H Guppies have been dominating as the pullback entry zone for this current rally. That range is currently $99,200 - $100,000. Limit bids for re-entry can be stacked there and at the 4H pullback zone of $97,200 - $98,000.
Key Levels
POC: $93,634
VWAP: $100,481
Value Area High: $102,185 - $103,823
Value Area Low: $97,139 - $98,777
Next Liquidity Zone Above: $103,550 - $104,267
Next Liquidity Zone Below: $96,522 - $98,580
Generally, following big breakouts like this, Bitcoin does not pullback very much and just continues aggressively. Nevertheless, this is a higher-risk type of entry. I recommend setting limit bids at $99,700 as I see a liquidity gap (likely a dip target). If Bitcoin keeps pushing, we should move rapidly for the next liquidity zone above.
Strategy:
While enthusiastic, discipline as a trader and following our pre-plan is essential for long-term success. We still face a potential bull trap between $100,000 - $108,000, and Bitcoin has key catalysts coming up in the form of the Interest Rate Print (15th), Trump’s Inauguration (20th), and FOMC Decision (29th).
As I originally outlined, I don’t expect the Fed to pivot on interest rate decisions until March or May, which means Bitcoin is unlikely to sustain a continued rally above the current ATH until that event occurs.
While I would love to be wrong, I expect a reversal in Bitcoin’s price somewhere around $105,000 - $108,000 unless something crazy happens following Trump’s inauguration (sighing of SBR on day one?).
Therefore, I recommend taking partial profits on Bitcoin longs opened up at or below $95,000. Move your Stop Loss to $95,000 or slightly above, and continue to hold positions.
Look for re-entries on pullbacks to the key levels identified above.

$BTC parabolic waves are inevitable!#Bitcoin don't worry about the corrective waves occurring in the early stages of the bull run, focus on the big picture and enjoy the ride!

Bitcoin will reach $240k - $260k in 2025!With concerns over inflation and money printing in many economies, Bitcoin has increasingly been viewed as a store of value, often compared to gold. If inflation fears persist, more investors could flock to Bitcoin, pushing up its price. In times of geopolitical instability, Bitcoin's decentralized nature and appeal as a "safe haven" asset could drive demand. As Bitcoin continues to capture public interest, more individual investors may enter the market, contributing to price increases.
Conclusion: There are many bullish factors that could drive Bitcoin's price toward $250k in 2025. The combination of institutional adoption, regulatory clarity, inflation concerns, and technological advancements makes this potential price level a possibility!
