BTCUSD- 4H Bullish setupBTC remains in a clean bullish continuation phase.
As long as price sustains above $106 000, upside targets are:
T1: $110 800 First reaction zone — short-term resistance.
T2: $114 200 Mid-level target — aligns with momentum breakout region.
T3 (Final): $118 000 Final target zone — coincides with full measured move projection.
Momentum, EMAs, and Fibonacci structure all support a high-probability push toward the $118K objective.
Bullish Confluences
EMA Alignment: 20-EMA trending above 50-EMA across 4H and 1D — strong momentum confirmation.
Volume Breakout: Expanding buy-side volume since reclaiming $105 000 indicates sustained interest.
RSI Trend: RSI holding above 60 with higher lows — momentum remains in bullish control.
Fibonacci Confluence: The 1.618 extension overlaps with prior breakout liquidity zone near $114K.
Weekly Support (62–63K): Remains the structural base for the broader bull cycle — trend intact above that zone.
Bitcoinprice

Bitcoin (BTC) - Bullish Reversal ScenarioCurrently anticipating a potential bullish reversal in Bitcoin (BTC) following a sweep of key liquidity levels, specifically the previous week’s low (PWL) and the previous day’s low (PDL). This liquidity grab appears to have been followed by a strong rejection at the PWL level, indicating a possible shift in market sentiment toward the upside. 📈
Before this reversal unfolds, I expect price to first target and sweep the previous day’s high (PDH), which would provide the necessary momentum to tap into deeper liquidity levels and confirm directional intent. 📉
Furthermore, I’m anticipating price to retest a significant H4 BISI, which adds confluence to the bullish outlook.
On the buyside, there is a well defined engineered liquidity pool characterized by relatively equal highs and the previous week’s high (PWH), offering a clear draw for price. 💰
Overall, these factors suggest a high probability setup for a bullish continuation, contingent on the successful sweep of PDH and sustained support at the H4 imbalance zone.

Bitcoin Analysis for 2025 (best Entries)I’ve highlighted the best entry points for 2025 in my latest analysis for the upcoming month.

The 16 year old question. Bitcoin or Gold?Since 2009, the question has emerged.
Which asset is the best safe haven against currency depreciation? Bitcoin or Gold?
For 16 years Bitcoin has massively outperformed Gold and many have become extremely wealthy as a result.
However, the tide is changing.
The number of Gold ounces required to buy Bitcoin is dropping. When this figure is above the indicated trendline Bitcoin is the clear favorite over Gold, below the opposite.
Not once has this number dropped below the upward trend. Until recently...
This chart says now is the time to switch from Bitcoin to Gold.

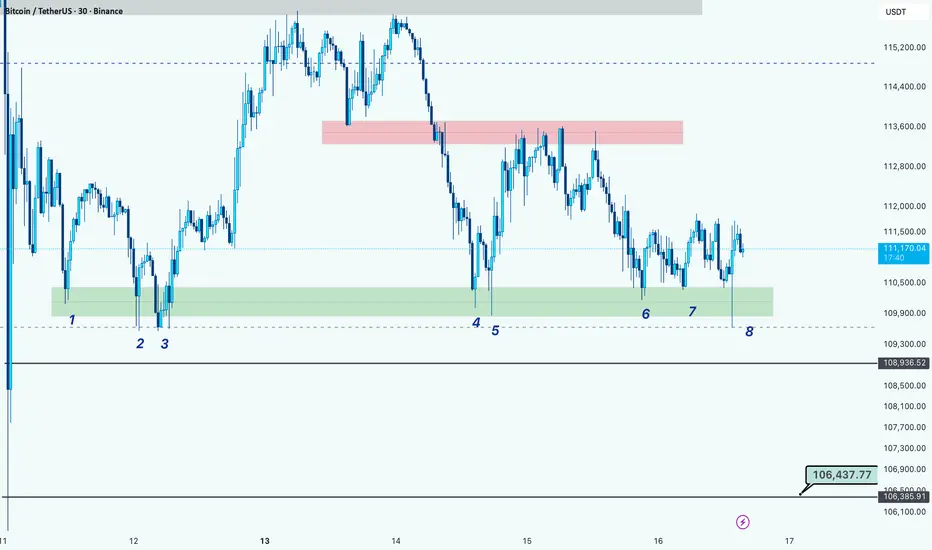
BTC Testing Key Support for the 8th Time, Breakdown Ahead?Hi guys!
BTC has tested the same support zone eight times around the $110,000 – $110,300 range (highlighted in green).
Repeated retests of a support level often signal weakening buyer strength, increasing the probability of a breakdown.
If the price manages to break below this zone, the next key support lies around $106,430, which could be the next target area for bears.
Bitcoin Price Slips Below $108,000: Time To Buy The Dip?At press time, Bitcoin trades at $106,947, sitting below the critical $108,000 level that previously acted as strong support. This loss has heightened volatility across the market, but a rebound remains possible if buying momentum holds.
Should accumulation persist and investor sentiment strengthen, Bitcoin could reclaim $108,000. This would push it toward $110,000, with a potential extension to $112,500 if momentum builds further. Such a move would indicate renewed market confidence.
Conversely, failure to maintain current levels could lead to further downside. A drop below $105,000 would expose Bitcoin to additional selling pressure. This would potentially dragging it toward $101,477 and invalidating the short-term bullish outlook.

Next Bitcoin Target - $135,000Bitcoin is retesting a key Point of Control (POC) level around $105K.
So far, the level appears to be holding strong, and price action suggests Bitcoin is gearing up for another move higher.
The 2-week cycle indicator has already bottomed, and the 1-week indicator is expected to follow within the next 10 days.
November is shaping up to be a highly bullish month - potentially the last window for easy gains in this cycle.

BTC to 70kThis is my idea on $BINANCE:BTCUSDT. We all know BINANCE:BTCUSDT hit all time high reached 70k in 2021. In 2024 we all witnessed BITSTAMP:BTCUSD able to break all time high reached new high which is 126k. Was there any consolidation after breaking high 70k? yes there was but BITSTAMP:BTCUSD never able to check 70k from above, you can say there is a gap BITSTAMP:BTCUSD must come to fill. There are few minor support zones which may able to hold BITSTAMP:BTCUSD but I wouldn't trust those areas which is around 100k, 86.5k, 75k. If BINANCE:BTCUSDT ever reach 75k-70k that means BTC is ready to make higher high. In worst case scenario we might see 65k 60k 50k, which may caused by Trump speaking or any other major news related to USD.

BTC/USDT Analysis. Strong Short
Hello everyone! This is the trader-analyst from CryptoRobotics, and here’s the daily analysis.
Yesterday, Bitcoin broke through a key level we mentioned earlier. Although this scenario was not the primary one, buyers were completely absent, allowing sellers to take full control.
Since yesterday, Bitcoin has dropped by around 6%. The decline could potentially extend to $97,000, where strong support is located.
Locally, we’re seeing a volume anomaly around the current levels.
If buyers defend the $105,000 area, we could see a bounce toward $108,000.
If not, the next downside target remains $100,000.
Buy Zones:
• $97,000–$93,000 (major volume cluster).
Sell Zones:
• $108,000 (volume anomaly),
• $110,000–$113,000 (accumulated volume),
• $114,400–$115,600 (local volume zone),
• $120,900–$124,000 (major volume zone).
This publication does not constitute financial advice.

Bitcoin Now on Last reserve of Support. it MUST bounce hereThe right cirxle is where i expected BTC PA to reach before it bounced, as it did on the left circle.
But It Fell out of Range and has reached this line Early.
the BIG question is now, Will it bounce ? And if it does, the previous line of support....wi that now be resistance ?
It needs to & maintain any semblance of Bullishness....Or we will likely see 94K and truly Test the Bulls.
I do have a BUY order down there. Why Not, I will be surprised if we get there but I relish the idea of buying there again
The weekly RSI certainly shows the ability to rise as it drop lower
The Daily RSI is also in a Good shape.
So we can bounce from here but we have heavy resistance overhead now around 109K
I mentioned this date range ( 12 - 15 Oct ) at the begining of th emonth...and it has played out but, now, we need that bounce higher and up and out of Range OR we could see a drop below and possible enter a mini Bear for the rest of the month.
Maybe longer.
As always, TIME WILL TELL>

BITCOIN Bearish Breakout!
HI,Traders !
#BITCOIN made a bearish
Breakout of the key horizontal
Level of 109022.4 and the
Breakout is confirmed
So we are bearish biased
And we will be expecting
A further bearish move down !
Comment and subscribe to help us grow !

BTC Top in play. The diagonal at 95k–98k is the last defenceYou have seen this movie. The current weekly structure mirrors the Jan to Nov 2021 distribution: two peaks, heavy swings, then loss of momentum that led to a full cycle retrace. Back then Bitcoin set an all time high in November 2021 after a prior April peak, then rolled over.
Here is the read. Treat the rising weekly diagonal on the chart as your line in the sand. That line aligns with the 95k to 98k area. Hold above it and the uptrend stays intact. Lose it on a weekly close and trend shifts down with room for a deeper retrace. This is standard trend line and support logic. A break of support signals direction.
Why compare to 2021. That cycle topped after a double top style range and then unwound sharply. The pattern of repeated rallies that fail at highs fits that script. Double tops mark bearish reversals after an advance.
What to do now. Focus on the diagonal and the 95k to 98k zone. Watch weekly closes, not intraday wicks. If price closes below the line, accept the downtrend and step aside or trade with the trend. If price reclaims the recent weekly high and holds, the top thesis is invalid. Use the chart, not opinions.
Context for new readers. In the last full cycle Bitcoin peaked near 69k in November 2021 and then fell into a bear market, which is why this comparison matters.

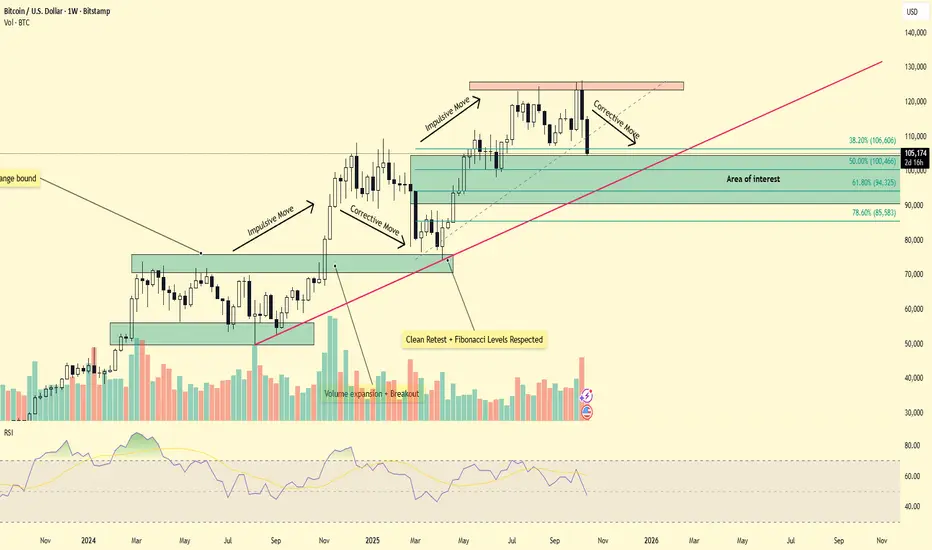
From Euphoria to Correction — Is BTC Setting Up for a Deeper PulIn my previous published idea, I mentioned that BTC was due for a corrective phase following an extended period of bullish momentum to the upside. That projection appears to be unfolding, as Bitcoin’s recent uptrend has started to cool off after several euphoric weeks of gains.
The weekly chart now shows price consolidating below the highs, indicating reduced buying pressure and potential exhaustion at elevated levels.
A weekly close below the 38.2% Fibonacci retracement level (≈106,000) could open the door for a deeper pullback toward the 50% retracement zone around 100,530, an area that previously acted as a strong demand zone and launch point for the last rally.
If the correction extends further, the 61.8% retracement level near 94,000 becomes the next key structural support — aligning closely with the ascending trendline that has guided BTC’s broader move.
Overall, Bitcoin remains within a macro bullish structure, but sustained weakness below the 100K region could mark the early signs of trend exhaustion and a potential sentiment shift.
BITCOIN ACCUMULATIONS MAY START <= 100KFor those planning to buy Bitcoin (BTC), you could wait for the price to decline to the $100,000 level or below.
Currently, the price chart shows a "double top" formation, which is a potential bearish reversal signal. I suspect this could evolve into a "head and shoulders" pattern. A break below the neckline could push the price toward the discount or value area.
N.B!
- BTCUSD price might not follow the drawn lines . Actual price movements may likely differ from the forecast.
- Let emotions and sentiments work for you
- ALWAYS Use Proper Risk Management In Your Trades
#ethusd
#crypto
#btcusd

$BINANCE:BTCUSDT BINANCE:BTCUSDT
30min hollows
After a spectacular price drop of 16% - 17% over 8 hours on 30 minutes timeframe chart...
We can say that a downward parallel channel has been formed, from which since the price came out of the channel, this signaled the beginning of the consolidation phase, that is the stabilization of the price.
The stabilization rate ranges between 4%.
So using the Fibonacci retracement sequence, we can see the Support and Resistance areas forming.
So there is this condition:
If the price is within the support point and breaks it downwards, this means that the market trend will be downward.
Respectively, if the price enters the resistance point and then breaks it, we can say that we have an upward market trend.
and then the resistance point will become the support point.
Good Luck
#CryptoHellas team

BTC/USDT Analysis. Inside the Range
Hello everyone! This is the trader-analyst from CryptoRobotics, and here’s the daily analysis.
Yesterday, unfortunately, buyers failed to regain market activity, and today we’ve once again moved down to the lower boundary of the range. After a false breakout of the local low, the price bounced back and tested a small demand zone at $112,000–$113,000 formed yesterday.
The cumulative delta continues to decline, showing ineffective buying pressure.
On the other hand, the price is being squeezed tightly toward the $109,500 low, suggesting a possible liquidity sweep soon. In case of a false breakout, the move could extend up to $115,000.
However, if we see a clear breakout and consolidation below, the scenario shifts toward short positions.
Buy Zones:
• $109,500 (false breakout level),
• $97,000–$93,000 (volume cluster).
Sell Zones:
• $112,000–$113,000 (local volume zone),
• $114,400–$115,600 (local volume zone),
• $120,900–$124,000 (major volume zone).
This publication does not constitute financial advice.

BTC/USD - Bearish SetupBitcoin is currently trading within a clear downtrend on the 4-hour chart. Multiple bearish confluences suggest that further downside is likely. Based on recent price action and Fibonacci extension levels, I have identified three potential take-profit targets for a short trade setup.
📉 Bearish Confluences:
Rejection at the EQ of Descending Channel
Price was rejected at the equilibrium level of the descending channel, reinforcing the strength of the ongoing bearish trend.
EMA Ribbon Resistance
Price is consistently getting rejected by the red and brown EMA ribbons, acting as dynamic resistance and confirming downward momentum.
Weak Bounce with Low Volume
The recent bounce lacked significant volume and follow-through, signaling weak buyer interest and potential for further downside.
Bearish Market Structure
The chart shows a clear pattern of lower highs and lower lows since early October, confirming a bearish market structure.
🎯 Fibonacci Extension Targets:
Based on the recent swing high (~111,780) and swing low (~110,056):
TP1 - 0.618 Extension: 105,741
This level aligns with a lower support zone of the descending channel and could serve as the first reaction point.
TP2 - 1.0 Extension: 103,150
A full extension move, potentially reaching key historical support or volume areas.
TP3 - 1.618 Extension: 99,820
A deep target near the golden Fibonacci extension area, likely marking the end of this bearish leg unless strong reversal catalysts appear.

Seems like a when situation for BTC. What do you think?Am I the only one worried that BTC on the monthly looks like its set to do a massive retracement for proper support, before climbing higher?

BTC 4HThe most likely scenario is an upward move to liquidate well-positioned shorts, reaching the 116k level. This would result in a rebound to the 55-period moving average and further decline.

Next Projection On BTCUSDWe have analyzed Bitcoin market from various timeframes and we currently anticipating further bearish continuation formation to the downside, Price is ranging on the 4 hours timeframe that could lead price further to the downside.

BTCUSD – Bullish Continuation Expected from Demand Zone BITSTAMP:BTCUSD
🟢
Market Overview
BTC has been consolidating within a corrective pattern after a sharp impulsive rise from the same demand zone.
The zone has held multiple times, confirming strong institutional interest.
As long as price respects this area, bullish momentum is expected to resume, targeting mid-range liquidity levels and previous structural highs.
Key Scenarios
✅ Bullish Case 🚀 → 🎯 Target 1 113 100 | 🎯 Target 2 114 500 | 🎯 Target 3 116 000
❌ Bearish Case 📉 → Break and close below 110 700 may open move toward 109 700 – 108 700 support
Current Levels to Watch
Resistance 🔴 113 100 – 114 500
Support 🟢 110 700 – 109 700
⚠️ Disclaimer: This analysis is for educational purposes only. Not financial advice.

BTCUSD (15M) – Bullish Continuation SetupBITSTAMP:BTCUSD
🚀
Structure | Trend | Key Reaction Zones
Price rebounded strongly from the yellow demand zone, confirming bullish structure formation.
A descending channel breakout is forming, showing potential for continuation.
The 113,000–112,000 range is acting as a short-term support and accumulation base.
Market Overview
BTC has regained momentum after tapping into the demand zone, showing strong buyer reaction and a shift in structure. If the market maintains support above 113,000, we can expect continuation toward the 114,500–116,000 range. Retracements toward 112,800–112,000 may offer fresh long opportunities for continuation plays.
Key Scenarios
✅ Bullish Case 🚀 → 🎯 Target 1: 114,500 → 🎯 Target 2: 116,000
❌ Bearish Case 📉 → Invalidation below 111,800
Current Levels to Watch
Resistance 🔴: 114,500 – 116,000
Support 🟢: 112,000 – 111,800
⚠️ Disclaimer: This analysis is for educational purposes only. Not financial advice.

BITCOIN SIGNAL: THIS IS WHAT WILL HAPPEN NEXT!!!(smash it) Yello Paradisers! Enjoy the video!!
And Paradisers! Keep in mind to trade only with a proper professional trading strategy. Wait for confirmations. Play with tactics. This is the only way you can be long-term profitable.
Remember, don’t trade without confirmations. Wait for them before creating a trade. Be disciplined, patient, and emotionally controlled. Only trade the highest probability setups with the greatest risk to reward ratio. This will ensure that you become a long-term profitable professional trader.
Don't be a gambler. Don't try to get rich quick. Make sure that your trading is professionally based on proper strategies and trade tactics.
