#Bitcoin (April9)The most in-demand buying zones in Bitcoin —don’t miss the opportunity! :)
Naturally, you can freely use the levels for a new order or for TP of your positions. The levels are updated daily!
The results of price reaction to these levels will be shown in the upcoming videos.
Bitcointrading

BTCUSD: Last chance to prove the Bull Cycle is still intact.Bitcoin remains bearish on its 1W technical outlook (RSI = 40.819, MACD = 1234.500, ADX = 47.185) as it is on the 3rd red 1W candle in a row, which just hit the 1W MA50. First contact since Sep 2nd 2024. The weeky low is also almost at the HL bottom of the Bull Cycle's Channel Up. Needless to say, it has to hold in order for the bullish trend to continue. Practically this is the market's last chance to prove that the Bull Cycle is still intact. So far the -32% decline is no different that all prior inside the Channel Up but an Arc shaped bottom needs to start forming. If it does and that's the new bottom, expect $160,000 by September.
## If you like our free content follow our profile to get more daily ideas. ##
## Comments and likes are greatly appreciated. ##

It could be worse for Gold and Bitcoin, right? Apple alone has shed nearly $640 billion in market capitalisation over just three days. The S&P 500 has fallen more than 10% during the same stretch—its worst performance since the onset of the COVID-19 pandemic. In Asia, the selloff is even more severe, with Japan's Nikkei 225 down nearly 8%, South Korea’s Kospi 200 off almost 6%, and Taiwan equities falling close to 10%, triggering circuit breakers.
In comparison, Bitcoin and Gold, while under pressure, appear to be weathering the downturn with relatively less panic.
Bitcoin has declined around 10%—a notable drop, but not unusual by crypto standards. Trading near $76,000, it has returned to pre-election levels, breaching both short- and long-term support zones.
Gold is tracking its worst three-day performance in over four years. Although some positive forecasts are emerging. Deutsche Bank has revised its year-end gold price forecast upward to $3,350, citing rising recession risks and renewed safe-haven demand.

BTCUSD: Can this M2 supply signal trigger a massive rally?Bitcoin has neutralized the previously oversold levels on its 1D technical outlook (RSI = 35.383, MACD = -1887.100, ADX = 31.814) as it is making a strong technical rebound on the 1W MA50. Today's analysis features the Global M2 supply, which is a leading indicator for Bitcoin. Both in July 2024 and November 2022 (the last two major bottoms for the market) when the M2 started to rise aggressively, Bitcoin declined and consolidated. It followed the bullish trend of the M2 with a rise of its own much later. This is similar to what the market has been experiencing since January 2025, when the M2 started rising but Bitcoin peaked on its ATH and started a decline that continues to this very date. If the pattern gets repeated then by end of April - start of May we are in for a strong Bitcoin recovery (if not earlier).
## If you like our free content follow our profile to get more daily ideas. ##
## Comments and likes are greatly appreciated. ##

Breaking: Bitcoin Loses $80,000 Support The price of Bitcoin ( CRYPTOCAP:BTC ) today saw a noteworthy downtick of 2.24% today making it down 7% since last week losing the $80k grip. This move came days after Donald Trump the recently elected president, on Wednesday, announced a minimum tariff rate of 10% and higher rates for 57 economies like China (34%), the European Union (20%), and Japan (24%). Fitch Ratings estimated that the effective tariff rate could hit 25% on average — the highest in more than 115 years.
The asset has tanked to the $76,000- $74,000 support point, placing CRYPTOCAP:BTC on the brink of a selling spree should CRYPTOCAP:BTC break below the $70k support, possible retracement should be around the $60- $50k support points.
Similarly, with CRYPTOCAP:BTC trading below key Moving Averages (MA), and the RSI at 35, CRYPTOCAP:BTC is gearing up for a reversal albeit the market is still volatile. If Bitcoin ( CRYPTOCAP:BTC ) should break the 1-month high resistant a possible uptick to $120k is feasible.
Bitcoin Price Live Data
The live Bitcoin price today is $77,615.23 USD with a 24-hour trading volume of $78,391,741,615 USD. Bitcoin is down 5.64% in the last 24 hours. The current CoinMarketCap ranking is #1, with a live market cap of $1,540,502,278,162 USD. It has a circulating supply of 19,847,937 BTC coins and a max. supply of 21,000,000 BTC coins.

Is Bitcoin about to touch the 50 SMA and BOUNCE ?
Just a Quick Idea - But the 50 SMA has been a Good Lauch pad previously in 2024 - Is it about to do so again ?
We also have the MACD ( Weekly ) nearing Neutral, It also bounced off this level in 2024
We will know by tomorrow or Tuesday, Just what is happening
HANG ON

Revisit to a BITCOIN idea posted in Mid March- TAKE OFF SOON ?
I first posted this idea on 19 March ( link at end of this post )
The idea is that because MACD on the weekly is still Falling bearish and is likely to remain doing so till at least Neutral is reached. This would Mean that PA had to Range in a region to allow that Drop
Things Excellerated though and that date of Mid Late April has now been pushed forward and Now, MACD reaches Neutral around 7th April - NEXT WEEK
Once MACD Neutral is reached, PA could rise with strength behind it....... This moment is getting nearer.... and so the original idea that this would happen over months got condensed in to Weeks and we now have DAYS to wait.
So, on the main chart, we wait to see if PA crosses that overhead resistance ealy next week
HOWEVER, we need to watch this Close as MACD could Drop below Neutral.
This would likely take PA down to that 618 retrace Fib line originaly arrowed.
Another thing backing a possible push is the BITCOIN DOMINACE cotined strength.
This, to the cost of the ALTS, has contained to rise and as long as it remains above that trend line, people shold buy BITCOIN more than ALTS.
It is that simple
So, lets see what happens next week. This cold be VERY GOOD

BTCUSD: Conservative September Target $150kBitcoin remains neutral on its 1W technical outlook (RSI = 46.307, MACD = 1999.100, ADX = 44.501), firmly supported on top of the 1W MA50. On this analysis you see the Channel Up that dictated the price action of the last three Cycles. Since December 2023 BTC has traded solely inside the 0.382 - 0.618 Fibonacci Zone, the median zone of the Channel Up. The Theory of pre-Halving / post-Halving symmetry implies that the time range from the Cycle Bottom to the Halving is almost the same as the time from the Halving to the Cycle Top. Since on the current Cycle, the time from the Bottom to the Halving has been 76 weeks, in theory the Top should be another 76 weeks from the Halving. We take the worst case estimate of 74 weeks like the 2017 Top. That's the end of September. And with regards to the target, a conservative estimate is just over the 0.5 Fib at 150k, like the highs of December 2024 and March 2024.
## If you like our free content follow our profile to get more daily ideas. ##
## Comments and likes are greatly appreciated. ##

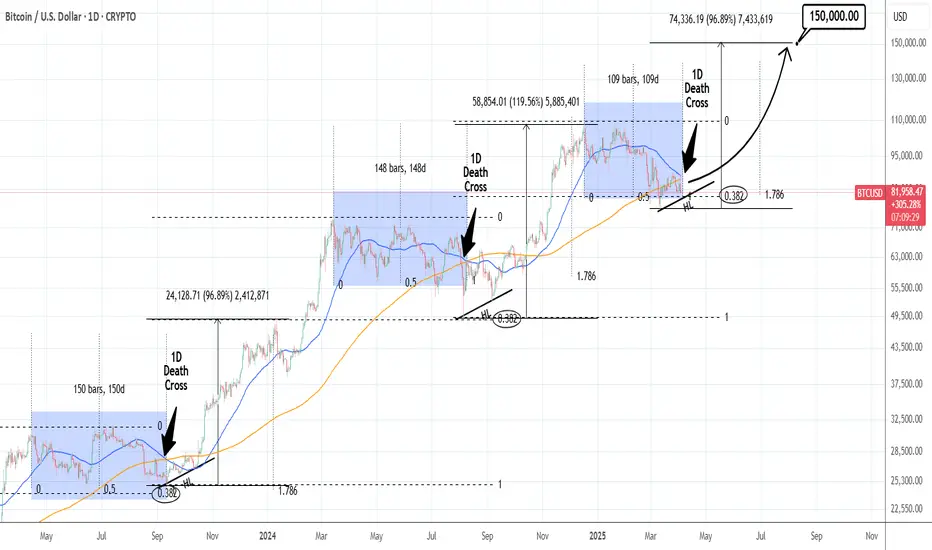
BTCUSD: 1D Death Cross can push it to $150k by August.Bitcoin turned bearish again on its 1D technical outlook (RSI = 43.071, MACD = -1375.000, ADX = 26.965) showcasing the high volatility that yesterday's tariffs announcement inflicted. 1W remains marginally neutral though (RSI = 45.519), highlighting the long term buy opportunity the current levels present.
The market is about to form the first 1D Death Cross, which occurs when the 1D MA50 crosses under the 1D MA200, since August 9th 2024. Even though that's technically a bearish formation, it has worked only as a bottom market during the current Bull Cycle. Both the Aug 9th 2024 and September 11th 2023 1D Death Crosses were formed exactly when BTC bottomed. In symmetric fashion the first two were formed 150 days after the previous high and rose by at least +96.86% by the 1.786 Time Fibonacci extension. Also both bottoms held the 0.382 Fibonacci retracement level.
This time the 1D Death Cross will be formed approximately 109 days after the previous high, which means that this phase is more aggressive than the others and may equally be more aggresive on the bullish wave too. Still, if it 'just' repeats the previous ones, we estimate to reach $150,000 by this August.
## If you like our free content follow our profile to get more daily ideas. ##
## Comments and likes are greatly appreciated. ##
BTCUSD: We are nowhere near the top.Bitcoin has turned neutral again on its 1D technical outlook (RSI = 52.405, MACD = -937.300, ADX = 31.574) and should turn bullish once it crosses above its 1D MA50, which is now a 2 month Resistance. This simple illustration of cyclical tops and bottoms shows that the market is nowhere near a top and we will not consider selling until we enter October (2025).
## If you like our free content follow our profile to get more daily ideas. ##
## Comments and likes are greatly appreciated. ##

Coin geometry 3 hours chart going up in whilethis is slight update to the previous video about coin
it will continuum down in the channel for while
then rally up for long term traders

BTCUSD: Bollinger squeeze paving the way for $160k.Bitcoin remains marginally neutral on its 1W technical outlook (RSI = 46.017, MACD = 2013.300, ADX = 45.410) and started last week a Bollinger Bands squeeze process. This squeeze has been present inside the 2.5 year Channel Up every time after it bottomed. Only July-August 2024 made a slightly lower low because the squeeze process turned out to be longer. Even in the event, what follows all Bollinger squeezes is an expansion rally, especially after a 1W STOCH RSI Bullish Cross and the pattern shows that by this September, we can reach $160,000.
## If you like our free content follow our profile to get more daily ideas. ##
## Comments and likes are greatly appreciated. ##

Bitcoin at a Crossroads – Two Paths, One TruthThe market is at a breaking point. Retail traders are still guessing. The real players already know. This isn’t just about price action—it’s about power.
Scenario 1 – The Bullish Illusion? 🚀
BTC is breaking out of a falling wedge on the weekly timeframe—a textbook bullish signal. If momentum holds above $90K, we could see an explosive push to new all-time highs. Liquidity is there. Whales are positioning.
✅ LONG ENTRY: $81,000 – $85,000
🎯 Targets:
Short Term: $117,983
Mid Term: $134,291
Long Term: $148,822 🌍💥
🔻 STOP LOSS: $78,000 – Because risk management isn’t optional.
But here’s the problem… the game is never that simple.
Scenario 2 – The Elite Trap 🩸
If BTC fails to reclaim $90K, this is a setup. Fake breakouts exist for one reason—to trap retail and liquidate late longs. If smart money decides to pull the plug, BTC gets dumped straight into the liquidity void below.
📌 What to Watch:
Failure to hold $90K = Bull Trap.
Liquidity below $78K = Liquidation Cascade Incoming.
And guess what? Scenario 2 is already in motion.
Retail FOMO’d in.
We shorted the top.
🚨 Bitcoin Short Printing Money – Precision Over Emotion 🚨
📉 SHORT ENTRY: $85,000 – $85,250
🎯 Targets Hit So Far:
✅ $83,800 – Cleared
✅ $83,000 – Cleared
✅ $82,700 – Cleared
✅ $82,000 – Cleared
💰 Massive profits already banked—but the real move is still unfolding.
🔻 Remaining Targets:
🎯 $81,150 → Next Stop
🎯 $79,100 → Breaking Structure
🎯 $77,000 → Liquidity Grab
🎯 $73,900 → Elites Accumulating
🎯 $69,100 - $68,100 → The Real Target Zone
🚨 The Final Move – The True Target? 🚨
A rising wedge successfully broke out on the 1D chart on February 6, 2025. It’s playing out perfectly, and the last target sits at $50,500.
The Only Question Left: When?
Retail keeps chasing the dream. The elites are already cashing in.
🚨 This isn’t speculation—it’s precision. This isn’t emotion—it’s control. The system plays the masses, but we play the system. 🚨

BTCUSD: Such consolidations end up very well for Bitcoin.Bitcoin just turned bearish again on its 1D technical outlook (RSI = 44.578, MACD = -918.200, ADX = 29.021) and with 1W still neutral, we are again on strong long term buy levels. Today's chart is yet another illustration of the market dynamics and the similarities with the previous Cycle. The market is well on its way towards the 1.618 Fibonacci extension target, which now translates to $175,000. Unless the 1W MA50 support breaks, BTC is a buy opportunity on every pullback.
## If you like our free content follow our profile to get more daily ideas. ##
## Comments and likes are greatly appreciated. ##

Bitcoin -potential to 91K, back to 78K wick to 73K and THEN -->>In this cycle, since the push up from the Low in Jan 2023, we have had 2 other Major pushes.
Each of these came off the Rising line of support that we are currently heading towards again, with the date of "Touch" currently in Mid June.
If we rise and stay back in the higher Range Box, that date is even later in the year ( around Mid Q4 )
As I have talked about many times, I am watching the MACD as the "trigger".
The chart below is the Weekly MACD
We reach Neutral , if we continue current rate of descent, around end of April
This is obviously before we would hit the line of support being talked about above.
That leaves 2 possibilities.
1) - MACD may drop below Neutral
2) - We may see a bounce from PA but NOT to a New ATH
If you look back at previous range we had in 2024, there was a bounce there.
See how the Histogram went White as we had that bounce
We Just had a white bar on the histogram .
Will we see another White bar next week and a further rise in PA
Top of current Range box in 91K - We could head to that again, Drop back to the Low around 78K and then we would be ready. This would be over the next 3 - 6 weeks
78K is the Price that touches that line of support the soonest, in early June
Why could we go back down?
For the reasons above regarding the MACD BUT ALSO ;-
There are things called FAIR VALUE GAPS (FVG)
. These gaps highlight market inefficiencies and potential trading opportunities, allowing traders to anticipate price movements and confirm trends.
That area just below Current PA on this weekly chart is the FVG that goes down to 73K
It is NOT guaranteed that PA will revisit that area but while we sit so close, the potential exists
But something to note, that could be benifical is that Should PA Drop to Fill that Gap, PA could hit that line of support earlier than Mid June..infact, it would be a month earlier and be in Mid May.
So, I can see the potential for a push higher in the near future, to extend MACD, then a drop back to the range Lows, a Sharp wick down to around 73K and THEN a sustained push higher...
This is just an idea.....No guarantees...But it does have Potential
We will see - Time will tell...........

BTCUSD: What if it's just a Channel Up to $175k?Bitcoin remains neutral on its 1D technical outlook (RSI = 51.175, MACD = -714.800, ADX = 31.665) as it is stuck between the 1D MA50 and 1D MA200 but it's the wider timeframes that are particularly critical right now and more specifically the 1W, which is causing the current rebound on the 1W MA50. We can argue that the pattern since the Dec 2017 Top is a Channel Up, even though the last Bear Cycle bottom didn't make exact contact with its bottom.
We can equally however assume that the new Cycle High won't make direct contact with the Channel's Top either. And that's also backed up technically by the Fibonacci levels of the previous Cycle, which saw BTC making a Top just over the 1.618 Fib extension. Consequently we can assume the new Top to hit at least $175,000 (Fib 1.618 currently). The bullish wave is also a direct Channel Up since the November 2022 bottom after all. Even on the previous Cycle, if we exclude the COVID crash price distortion, the bullish wave was a Channel Up as well.
## If you like our free content follow our profile to get more daily ideas. ##
## Comments and likes are greatly appreciated. ##

BTCUSD: Can $160k be a very 'pessimistic' target estimate?Bitcoin is neutral on its 1W technical outlook (RSI = 50.359, MACD = 2868.500, ADX = 51.194) and having rebounded almost on its 1W MA50, there couldn't be a better buy opportunity for the rest of the year. Basically the price is now ranged inside the 1W MA50 and top trendline of the Pi Cycle, while the 1W CCI hit the -100.00 oversold limit. This has been the most efficient buy entry in August 2024 August 2023 even on the Cycle before in June 2021.
Even if the market doesn't make an 'excessive top' above the Channel Up, like the last two Cycles, hitting $160,000 would still be under the top of the Channel Up and the top of the Pi Cycle. No matter how high this target seems now, it will still be a pessimistic, 'bad case' scenario.
## If you like our free content follow our profile to get more daily ideas. ##
## Comments and likes are greatly appreciated. ##

Bitcoin Following 2013-2017 Fractal UPDATE 2We can see from the chart above that PA has now fallen below the Fractal for the first time since July 2023
This is itself was expected as we can see from previous posts on this Idea
PA was overbought and so HAS to cool off
However, we have targets as to when PA may try and recover.
initially, the circle in End of May was my expected "turn around" point
Things have progressed faster and so now, we have possibilities opening up for a move higher, sooner, maybe around end of April 2925
However until the weekly MACD is on Neutral, these would be short lived - hopefully.
For a sustainable move higher, PA needs to have the ability to maintain the push
the Weekly MACD shown above needs till end of April before any significant move can be maintained. PA has bounced of Neutral previously. But MACD can , obviously, Drop below this point, wait till May, or later, and move then.
For me, the line of the arrow higher is becoming the more realistic ideal path
But the longer we wait, the Steeper the rise has to be to maintain the idea of Cycle ATH in Q4, as per cycle trends.
And to conitnue to follow this Fractal.
The Time WILL come were we break away from this Fractal but as I have been saying for years, we are still on it......many things point towards that continuing.
But as I have mentioned in a post earlier today, These Trends may be changing.
Bitcoin is Maturing
All we can do is watch, react and learn
HAVE A PLAN FOR ALL OUTCOMES but also understand, the idea of Bitcoin collapsing is becoming more and more unrealistic...
The outlook is BULLISH noi matter what
I expect to remain on the fractal path till Next cycle ATH
Time will tell

BTCUSD: The Cycle won't peak before September!Bitcoin remains neutral on its 1W technical outlook (RSI = 47.334, MACD = 3198.500, ADX = 54.017) which, having kept the 1W MA50 intact as Support, suggest that this is the ideal level to buy again upon the continuation of the Bull Cycle. Despite the recent 2 month correction, the Cycle hasn't peaked and according to the Pre-Halving/ Post-Halving theory, that suggests that the time from the Cycle's Bottom to the Halving is almost identical to the time form the Halving to the Cycle's Top, we have until the end of September before the bull run is over. And that's because the range from the Cycle's Bottom to the 4th Halving was 75 weeks (525 days), which indicates that it will take around the same amount of time from the Halving before the Bull Cycle tops. See how amazingly consistent that has been on all of prior 3 Cycles. Consequently, the best strategy here would be to hold and start selling in September.
## If you like our free content follow our profile to get more daily ideas. ##
## Comments and likes are greatly appreciated. ##

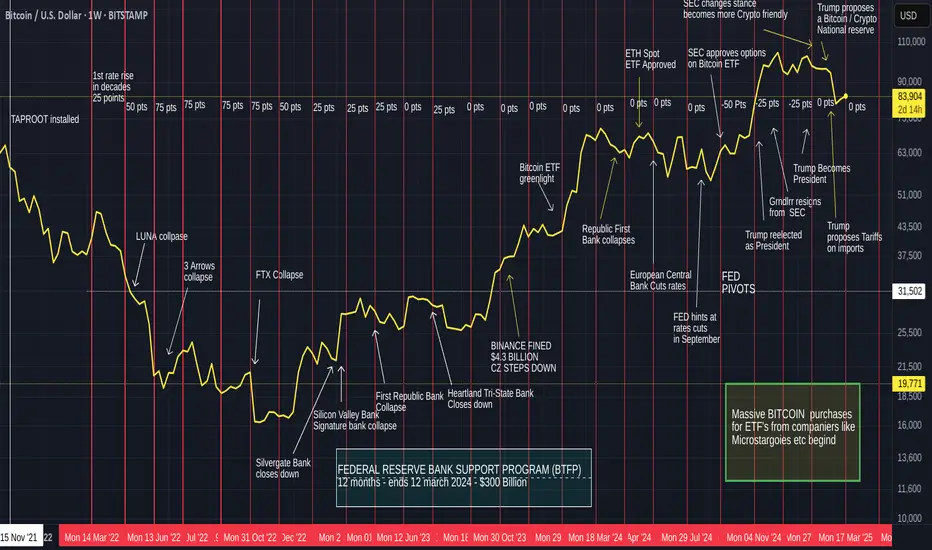
Bitcoin, interest rate effects, Macro events since 2021 - UPDATEThere is one very simple takeaway for me from this chart and that is simply that raises and Lowering of interest rates had Very little Effect on Bitcoin
It is more the effect it had on other organisations and the sentiment that followed Bitcoin and the traders.
For instance, From Jan 2023, when we saw Bitcoin begin its recovery, interest rates continued to rise.....and had NO effect on the Bitcoin recovery
And I think this continues to this day.
After the First push higher by Bitcoin in 2023, PA went into a Long range...in this time, interest rates began remaining at a static level. Bitcoin did not rise because of this.
When BTC was ready, it made a push higher again, interest rates were static and remained so while BTC entered another long range in 2024
It could be said that BTC PA rose once Rates were reduced but PA leveled out again even while the next rates decision was to reduce.
Bitcoin has its own agenda, it is NOT dependant on the USA to control its choices
On Each range, the MACD on the weekly timef rames was OVERBOUGHT.
And it is currently resetting having been overbought again.
This s NOTHING to do with interest rates.
MACRO events do have an impact though and we need to pay attention this this
But over all, Bitcoin is GOOD, BULLISH and getting ready for its next push
Have a Nice day now
BTCUSD: Staying bullish with this breakthrough analysis.Bitcoin remains marginally neutral on its 1D technical outlook (RSI = 45.889, MACD = -2304.900, ADX = 28.298) as it erased yesterday's Fed gains. Nevertheless, this doesn't make us lose sight of the bigger picture. On this 1M chart, we have selected all Decembers, as they hold critical importance for BTC Cycles. Both bottoms and tops tend to be priced around them and in between two consolidation phases take place. Don't let the short term volatility cloud your long term perspective. This Cycle hasn't topped yet. Stay bullish.
## If you like our free content follow our profile to get more daily ideas. ##
## Comments and likes are greatly appreciated. ##

Bitcoin Rising to Fill most recent CME GAP - what then ?We have seen some pretty Good CME Gaps in recent months, a sign of volatility.
And, as I have been saying, CME GAPS ALWAYS GET FILLLED
the proof of that is right here, showing you the recent ones.
So, eight now, we are filling a gap from Below
The question is, what will we do than? Once the Gap is filled at around 86485
I would be a Very rich man if I knew for sure but as I have been saying in a few posts, I do not think PA is fully ready to berak out just yet BUT we may see a push higher to around 90K before it returns to the Low, maybe even to dip lower into the 73K zone.
But, obviously, this may not happen. However, Next time you see a CME Gap, understand it WILL get Filled.
If in a bull run Move, it will remain a gap till a later date, or, as we range as we are now, you can see howe this happens.
The Dips are great buying opportunists
Almost like the Fair Value Gaps ( FVG )
Stay safe

A possible scenario for Bitcoin over next 2 monthsI do think this has a Strong possibility of happening
MARCH will close as a RED Candle and the statisical expectation is that April will close GREEN and yet there are many reasons why Bitcoin Cannot rise a lot in April to make that Green
SO, We may see March drop down to the 74K area to end the month
This Gives PA the ability to Rise, hit that trend line and still Close the month GREEN and then take off in May.
Why May ?
Because that descending trend line perfectly matches the Weekly MACD decent and the date is when MACD reaches Neutral. Begining of May.
This is also why PA will likely be rejected from the Trend line before MAY
Should PA remain where it is now, it doesn't give a lot of room for April to close Green.
This really is just an Idea so we just need to see if it happens.
I do have a SPOt buy order sitting at 74779 just in case lol
