Bitcoin: It's not gonna make it, is it?This quick idea is intended to illustrate what is happening to Bitcoin and how final it is.
Let's take a look at the development of the Bitcoin / Gold ratio over the last five years.
The thick black line was always the last support.
On March 12, 2020, it was broken down massively and very aggressively and became the new long-term resistance.
Thereafter, on 20th March, the price still tried to overcome the new resistance and was rejected.
From now on it will go down for a very long time and very deeply.
A "hodl" strategy makes no sense at all under these circumstances, unless you are willing to wait many years and want to risk losing everything in the end.
With regard to Bitcoin's long-term prospects, it is particularly important to monitor the further course of the thick black line.
If, as it looks at the moment, it bends and starts to go down, then the Bitcoin dream is over.
The line will bend if the price of Bitcoin remains permanently below it and cannot break out beyond it.
Take care & stay healthy!
Bitcointrend

BTC PULLBACK?It seems very likely that the bitcoin price chart will return to the 9100 USD zone in the next 2 days.
Wave Elliot's target area (BC) at:
9100 - 8968 USD.
#bitcoinlovers


Let's Flip a Bitcoin: Bullet Proof Let's see how stable that bottom really is.
As always, this is your signal analyst, Krewbacca_xR.
Shutting down fake analysts left and right with these two hands.


BTC USDT, Probably Bearish PennantIt seems that enthusiasm due to the recent decline in historical media is rapidly coming to a halt. The most attentive has not responded to the purchase around 7k USD. I believe that this triangle can predict the new Bearish towards lower supports confirming last week's bearish trend.
A difficult time to venture forecasts, but we'll see.
For me, it's a 70% Bearish.

BITCOIN: This could be your life-changing trade?!
If you are watching the actions this week, that was very big firework on the ground.
09/23: BAKKT Launch
09/24: FSC general SEC meeting
and after this meeting 400M $ of LONGS liquidated on bullmarket(!) and BTC dropped 15% in a single day mostly in one hour....
You sould ask: WTF happend here sir? They said BAKKT is bullish...or not?
Let's see where could go the price from now:
~~~~~~~~~~~~~~~~~~~~~~~~~~~~~~~~~~~~~~~~~~~~~~~~~~~~~~~~~~~
1/ ANALYZE THE 200DMA PRICE ACTIONS
Are on bearmarket again? Or will be soon?
~~~~~~~~~~~~~~~~~~~~~~~~~~~~~~~~~~~~~~~~~~~~~~~~~~~~~~~~~~~
The most important indicator for BTC is the 200MA ribbon on daily:
* closing above this for more than 2 days & after a long term trend: we are now on bullmarket
* closing below this for more than 2 days & after a long term trend: we are on bearmarket
Lets see EVERY example in BTC history:
2011 Sept - 2012 Marc / BTC Daily
* small market , penny stock , short time of bearmarket
* 200MA closed below, but the bulls didn't can close above 200MA for many days
(bulltraps over time from 2012 Jan to Marc)
2012 Marc - 2014 Marc / BTC Daily
In the next 2 years BTC didn't can to close below the 200MA, only once (for 1 day) but obviously that was a beartrap
2014 Marc - 2015 Jun / BTC Daily
Closing more than 2 days below 200MA causing new bearmarket for more than 1 year.
After few hundred days trend changed and confirmed with more than 2 daily candle, doesn't matter this bulltrap near after the trend reversal.
2015 Jun- 2017 Dec / BTC Daily
This one is very interesting! After a ~1.5 years of bear trend we are closing above 200MA for more than 2 days.
After 1 month the bears trapped for another month.
After the fake breakdown we are now on confirmed bullmarket for the next 2 years.
2018 Febr - 2019 Apr / BTC Daily
After 2 years 3 candles in a row closed below 200MA you.
So you should prepare for bearmarket.
Doesn't really matter where the price goes after this .... or deadcat or whatever
We are on confirmed bear trend now.
2019 Apr - ? / BTC Daily
Closing above 200MA for 3 days after a long bearmarket confirms the trend changed to BULLISH.
Touching or closing for a few days (or perhaps for a month!) below the 200MA after a confirmed trend changing doesn't really effect the main trend for next 1-2 years.
Which is now obviously BULLISH since April 1...
CONCLUSION of the 200DMA point : if we are changing the 1-2 years main trend with more then 2 candle close on the other side of the 200MA : this will cause trend changing for long duration anyway.
If we are going below the 200DMA at the starting of a bullmarket (like now) - the price cannot stay there more then ~1 month beacause the trend already flipped before strongly.
~~~~~~~~~~~~~~~~~~~~~~~~~~~~~~~~~~~~~~~~~~~~~~~~~~~~~~~~~~~
2/ RSI(20) must be your best friend ever
The best tool for searching entry points inside a trend
~~~~~~~~~~~~~~~~~~~~~~~~~~~~~~~~~~~~~~~~~~~~~~~~~~~~~~~~~~~
I've wrote an another educational content about RSI(20) usage : BTCUSD How to making LOT of MONEY - Hunting Divergence
So I'm a very conservative trader, I'm not using many charting tools, because as I've experienced: most of them are showing the past instead of future.
So using MA, EMA, Boilinger B., MACD, Stochstic oscillators, SAR, and other averaged ribbons are not the best way for catching a momentum of a good entry point!
Instantly stop using these indicators if you are not veryvery successfuly with these tools in the past 1 year!
I will writing more free educational materials about my YOU-MUST-USE indicators. (these are completely free and built in on every charting software....so this is not an advertisement!)
The RSI(20) is the most important one!
In this section I will show the other usage or daily RSI on the BTC chart (not the divergence, what about I was wrote earlier).
There is a proofable correlation of BTCUSD and the daily RSI : During a confirmed bullmarket if you are open a long position ONLY WHEN the RSI(20) CLOSE on daily is below 40 : you must be maybe one of the most successfuly traders on the world.
As you see 5/5 example worked at the last bullmarket....
And that is not all!
If you've opened this only once at the first occured time inside a bulltrend and let the position run away to the moon for at least 1.5-2 years.... so this causing 20x, 30x, 40x, 50x price move!
Oh boy what a move, it isn't?
Think about it: how many times are you so stressed about the intraday price moves...and for what?! Big lose or small win inside a day trading... not very satisfied if you would like to live a normal life out there in the world!
With this strategy you can make at least the following dollar value result:
* x20 BTCUSD move like above
* with Perpetual Inverse Swap Contract trade ( for example with Bybit )
* and ONLY x2 MARGIN (which I think is very safe!)
YOU'VE MADE 40x profit ( 4 000 % ) on BTC and 80 000% (800x) on USD value !
With only ONE TRADE in 2 years...
I don't know how are you guys, but that is far enought for me.... for a whole life maybe. This is a lifechanging profit, even if you are only started with 0.2BTC ! ( for example: if you are started with 0.2BTC now 1.700$, after a cycle that means 1.360.000$ !!! )
GUESSSING where is BTCUSD now:
Yes, just started the first retrace bottom of this cycle!!!!
(This is not financial adwise, I'm just writing what I'm doing now!!!)
~~~~~~~~~~~~~~~~~~~~~~~~~~~~~~~~~~~~~~~~~~~~~~~~~~~~~~~~~~~
3/ Other confirmation tools for this bottom
STOP-loss, Targeting and Helper indicators
~~~~~~~~~~~~~~~~~~~~~~~~~~~~~~~~~~~~~~~~~~~~~~~~~~~~~~~~~~~
NOTE: I will writing free educational content about these indicators, but now I would like to point the confirm sings only.
3/2/ VPVR - the weighted volumes
This is a very popular indicator in the current bullmarket, this means: many people are watching this, and trading this levels as S/R.
You can see: the most occured range is $7.9k . That is the strongest support level.
3/2/ TD Sequential - the tired trend indication
The 9th daily bear sequence inside a bullmarket almost every time indicates main trend continuation.
This indicator is only good for confirm your idea, not the ultimate tool!
The pro traders who are using this are sayin: after the 13th candle after complete a 9th sequence you can prepare for trend reversal. But not necessary wait for that, effective on more TF-s. And now 4H, 6H, 12H, 1D TF are almost equal.
3/3/ FIBONACCI measure - predict retracement levels
Most classic natural price level tool for pre-calculate retrace prices.
At Aug 1st I've wrote and article about that ( BTC will show you: SIR, WHEN MOON? ) and is's still valid now.
FIB 0.616 - 0.5 range is the best retrace level inside a strong trend.
As you see: the absolute calculated bottom is $7.2k of this correction move.
3/4/ Murray's Math - the pointless insane/fear indicator
We could just guessing the exact algoryhm of this (because the original software is licence proteted) but there is a free indicator tool in tradingview called "UCS_Murrey's Math Oscillator_V2" which is almost working similar like the original indicator.
During bullmarket if the value of this indicator showing value under -0.75 : that means pointless fear on the market
Now this indicator showing us -0.95 ... very good!
(If this indicator would bottoming to -1 : there would be no lower at that price, that level would be a blindly instant LONG. We are very close but not necessary waiting for that value.)
3/5/ Classic TA with market structure
I've posted about market structure at Aug.7., and that TA and trendlines are still valid now: BTC is at top & Overbought territory
But freshing to double channeling:
Classic TA is always the best way to find out moves:
* ~41% is the most bigger correction amount during bullmarkets
* double channel structure valid since 14k and 3 months
* 200MA wicking as support
~~~~~~~~~~~~~~~~~~~~~~~~~~~~~~~~~~~~~~~~~~~~~~~~~~~~~~~~~~~
CONCLUSION
~~~~~~~~~~~~~~~~~~~~~~~~~~~~~~~~~~~~~~~~~~~~~~~~~~~~~~~~~~~
Q: Is the current price (~8.3k) the absolute bottom of the current correction?
A: Not sure, but we can define the absolute bottom as 7.2k
Q: It isn't too early to going long?
A: Depends on your timeframe. For me absoluteley not. Half of my cap long with x3 margin from 8.2k, and other half opening another if we will going lower (example: 7.2k)
Q: What is your target with your current trade?
A: I'm opening these positions to reaching at least 800-1000x USD based profit with only one trade. So my target is the end of the bull cycle (~2 years from now). By my calculation $200k-300k bitcoin price for there.
Q: STOP-loss level?
A: under 7k. If we reach the 7.2k, then I'm opening another long with mutch higher margin(for example x5). But always protecting your capital is the first thing need to do! If you are conservative, use only 1.5x leverage.
Q: What if I'm scared about going long now?
A: No problem, you can wait for any divergence on 1H or 4H chart. In that case this article will helping you BTCUSD How to making LOT of MONEY - Hunting Divergence
Q: What is you are wrong?
A: Nothing, I'm just a guy from the internet...this is not financial adwise! I'm just descibing my techniqes and ideas about the actual situations.
If you liked this article:
* FOLLOW ME ON TWITTER
* FOLLOW ME ON TRADINGVIEW
* SUBSCRIBE TO MY FREE NEWSLETTER
And you can support me via this signup link if you are looking for the better bitmex: Bybit registration as better BITMEX .

Bitcoin, Bulls are still running, waiting for re-entryWaiting for price action to meet the blue 1/10th*233 ma on the 1hr chart before re-entry for a long. CCI looks great and we're above the 1hr 100ma. Last time we were above the 1hr 100ma we ran to 12k
If you like my calls, you can see more of them, my positions, and learn more about trading at my discord Verbatim Crypto Calls discord.gg just click the invite link or message me @VErbadoo#0847
Or if you wanna sponsor me use my ref code for Primexbt primexbt.com Great liquidity, great fees and doesn't overload like shitmex

Trend is Dancing on Bitcoin. First UP then DOWNVfi has crossed down on 1hr and severely on 15min. Wave-pm is showing where the trend is going. its gonna compress upward to 10740-10820 and go sideways before being ready to dump. If it doesn't go sideways and breaks into 10.9k then we'll see 11.2k or so for rejection
I'm holding out positions for now, not worth the risk/reward
not until the big short

Bigger picture of where BTC is goingSome people keep asking me where we go, but the thing is as I previously explained, it is all about probability, no one can be sure on any of the time terms (If people really knew to predict every BTC move they would be very rich and famous in doing so), but my probabilities atm are:
Short term? no one can be sure...
we are in a symmetrical triangle as I showed previously... any break below it or above it will determine the short-mid term mood..
mid term? historical phases (last parabolic run, and the first time we hit 1k+ and had a big correction before the explosion) show that we have still a big correction, also the rise of the current parabolic was due to tether manipulation and exciting bots, also i didn't see real volume buying power, sentimental's aren't really that strong, and in fundamentals the technology is way behind so I don't see any institutions nor adaptation in at-least next 2 years... also if we explode with another parabolic move upwards then the crush is going to be much worst then I expect now, so mid term if we wont create ath, then we will see a 1-5.5-8.2k again (1-3 if tether dies, and 5.5 because we need to reset the current parabolic like we did with the previous, or at-least correct it to 0.7 fib' which is +/- 8.2k)... also excitement, and other values of moon boys give me the same vibes as it was when we got to 18k last time, and when we got to 1k for the first time way before that (both had long term corrections which no one believed could happen)...
long term? I can see Bitcoin between 1-10m$ if the technology matures and succeeds, this is the stable zone for Bitcoin where 1sat = 1cent, when BTC replaces all fiat in the world (Or stays above all of them), when only multi billionaires can hold 1 whole BTC, when all BTC cap can hold all gold in the world and so on...
Hopefully this answers your question..
Things can always change, by this is basically the vision which I hope to see..

BTCUSD 8/14/19 Over Sold On 4H RSI!!Bitcoin USD is very over sold on the RSI i am scaled in in a position as the 4 hour RSI got very over sold and will be looking to sell for a bounce in the next few days!

A clear Trendline Break On BitcoinThis is merely a continuation of the previous analysis which is posted at the bottom of this posting, however, this one is of a shorter time frame, the daily. In this analysis, there is a short term trendline in green which has held for 4 months (approximately) and has exhibited 3 touches, on the fourth, the trendline was broken. In the green oval there is the break and the retest of that trendline, but price was rejected there. This isn't enough for me to state completely that the horn top will play out, however, it gives the horn top on the weekly a greater possibility of occurring. For confirmation of the horn top a break and close below 9600 would need to occur on the weekly. A daily candle which opens and closes below 9600 maybe enough confirmation, depending upon the individuals.
Previous Analysis:
Previous Analysis:
Corresponding Analysis:

BTCUSD about to decide if it goes past 10700 towards 11000Granted current uptrend continues and gets past the extended blue parabolic move line and meeting point of the descending line we about roughly 12hours away from a crucial move that may see us move up towards 11000 again. Chances are still there of being met with resistance and rejection that could see us plunge to the 10500-10000 range again.
As always, Trade Safely, Happy Trading.

BTCUSD Speculative move to the upside in 1h, 11700 Resistance!Should we maintain the current steady uptrend on the hourly and 5 minute charts we may re-visit 12000 by the end of the hour provided we break the 11700 sloping resistance line. Happy Trading.

IMPORTANT bull trend support for bitcoin at $11,400 This area I have highlighted is HUGE confluence of support or massive breakdown resistance.
Since bull trend is still intact on higher time frame, I am LOGICALLY leaning 80/20 bull support here because EMOTIONALLY I am leaning 80/20 breakdown. And whoever is trying to accumulate a sh!t ton of btc is doing a great job shaking out the weak hands on this historic move up.
1. Parabolic support since 3150 (tourqouise parabola)
2. Bottom of BLUE VALUE CHANNEL!
3. 4 hour 100 EMA support (purple EMA line)
4. descending trendling of major pennat/disjointed angle breakout with target of $14k

BTCUSD - BEAR FLAG PATTERN?In my opinion bitcoin is in an overall BULLMODE. But we need to get a healthy correction back into the buyzone.
At the moment we create a classic bear pattern with a bear flag. A bear flag is a correction in a downtrend.
For me there a no bullish signs at the moment. But in cryptospace everything is possible.
I will wait for lower prices and buy with cost average.
Please leave a like or a comment!
This is not an investment advice, i just want to share my thoughts and strategy with you.

Bull and Bear W FractalsThis is not comprehensive, but it's something I have noticed for a while. There is a general W shape, and depending on which side of the W base is lower, it seems to indicate an overall trend moving forward.

Bitcoin Timeline ChartedKey events from Bitcoin's history, most of which likely had a significant impact on it's value.

Bitcoin Timeline ChartedKey events in Bitcoin's history, most of which likely had a significant impact on Bitcoin's value over time.

Forever Short BitcoinSure, you may be able to get some small gains upwards, but that next Fibo level will be impossible to break through. Keep in mind, most the analysis you'll see uses extremely short-term charts at the hourly level. I'm still amazed there are still people throwing their money away on this particular crypto while the options for gains are so much better with returns on a percentage level much higher in Litecoin or EOS for example. Just look at the moving averages, RSI, and Stochastic. All are near flashing overbought and that's with this incremental trend up. In brief, I'll short Bitcoin my entire life and feel no guilt on any money I lose in the short-term.

Bitcoin could drop another 34% here's why..Hellow tradingview,
- After almost 1 whole year of trading inside a descending triangle we finally broke out to the downside and hit the 3000$ target with near perfection.
- Now we can see on the chart above Bitcoin could potential form a new descending triangle.
- After a weak correction to the upper side we topped out at 4245$, we formed a bullish pattern and broke out of it. But selling pressure was so high wich resulted in a big drop once again. At this time i am looking for a double bottom around 3150$ more or less.
- I want to point out that the pattern is still not active YET, if we touch the lower trend-line again which is very likely, the pattern becomes active.
- Quick measurement shows us that a target of 2000$ is very possible for Bitcoin
- Pattern becomes invalid if we break above the upper trendline or break below it.
Safe trading!

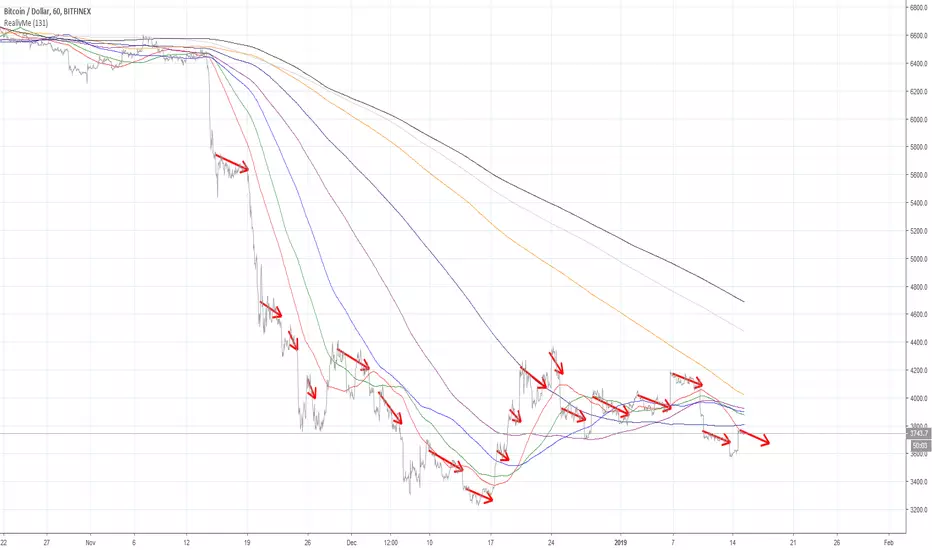
BTC: Elusive "Bottom". Not even sideways yetThis is just a quick idea to share about Bitcoin.
See these telltale arrows?
They tell you the true story of where we are.
Still not impress by $BTC…I charted these lines on 9/6/2018, and Bitcoin is following my analysis to a T where it is ranging in this triangle. Ideally I want to see it break out past $7400 with conviction before I start to believe in a long term bull run. Until then, this very well could be a lower high and we could see Bitcoin break the triangle bearish.
How I plan to trade BTCUSD:
Stack buys around $4800-$5200
Buy on breakout if price breaks above $7400. If BTC breaks $7400 I expect a nice run all the way up to $8500.
About me:
I am a professional trader with over thirteen years of trading experience. I am fortunate enough to have had the opportunity to retire at age thirty, and I now trade for pure amusement. I love the crypto community, and would like to further flourish within it by helping any newcomers learn to trade and invest. If you found this chart helpful, please give it a like and follow me on Twitter.
Thank you,
Mike, the OMEGA Trader
