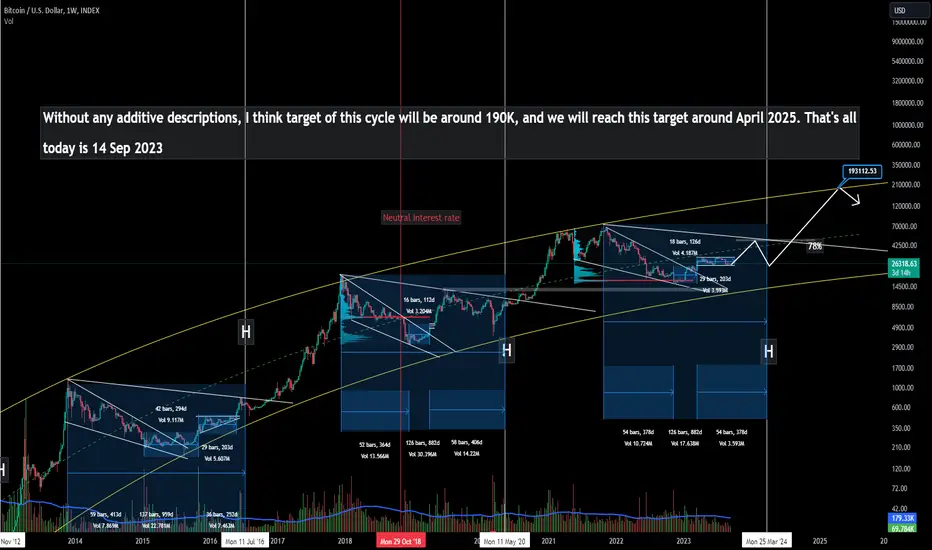
My expectation for Bitcoin for next 2 years Without any additive descriptions, I think target of this cycle will be around 190K, and we will reach this target around April 2025. That's all
Bitcointrend
BITCOIN is bearsh?BITCOIN might be heading towards 31000. First stop is 40000 area before moving towards 38000 area. Wait and see price action at 38000 area. The bias is most probably bearish and might be price move toward 32000.

3 Solid Reasons Of Why Bitcoin#1 With Bitcoin you can confirm every transaction which means
that with a hardware wallet you can transfer Bitcoin
Directly to it without third party confirmation service
--
Such as when you are using a browser wallet.
--
#2 Bitcoin is open source which means that you can send and recieve it
from anywhere around the world without paying license fees.
--
#3 You can store Bitcoin on your hardware wallet which has
device protection which means that you will be able to lock
your hardware wallet with a password of your personal choice.
--
Rocket boost this content to learn more
**Disclaimer:**
The information provided above is for educational and informational purposes only.
--
It does not constitute financial advice, and trading always involves
--
a risk of substantial losses, regardless of the margin levels
--
used. Before engaging in any trading activities, it is crucial to
--
conduct thorough research, consider your financial situation,
--
and, if necessary, consult with a qualified financial advisor. Past
--
performance is not indicative of future results, and market
--
conditions can change rapidly. Trading decisions should be made
--
based on careful analysis and consideration of individual
--
circumstances. The user is solely responsible for any decisions made
--
and should be aware of the inherent risks associated with trading in
--
financial markets.

BITCOIN Weekly Outlook - 22/01/24 Hello everyone,
as I ment in last week idea, I am expecting BTC rather going LOWER then Highier,
prior to FED meeting which is next week.
Since we doesnt have much volatility last week, Im would expect bigger moves to occur later this week, when Market related reports start coming...
To understand further view I would suggest to first check this out:
As right now: I would suggest be very carefull with NEW trade opens , and manage them very carefully since there is potentionall for liquidity swept due to low range last week...
So, everyone who WAS Short before this post or decided to go Short after, should be in favorable position right now. (opening price at time of post is represented by purple dotted line)
Our Liquidity Sellside targets are same as was last week.
BUT what would I suggest to everyone, and doing myself is ↓↓↓↓↓↓
Create STOP LOSS order ABOVE weekend Highs
WHY? , - Have in mind, we are still in Monday PRE-MARKET, if we all of sudden reverse today, before late week news drivers, we can potentionally go to OTE targets from last week. And in that case we would LOSE on our trade... Thats Why we wanna create STOP LOSS order above weekend price BUT under our OPENING price. So even if market reverse, our position still be closed in very small profit but not end in loss!!!
Hopefully, this helps some of you with your perception of market.
If YES, please consider liking or sharing this post, it would mean a lot for me. Thanks
Joe

Bitcoin Structure updateThe price is still in Stage 1. Although internal consolidation looks bullish. Volumes are dried up when price pulls back and expansion when price moves up can be seen. The bullish spreads are also getting wider. Some traders will perceive the internal structure as inverted H&S, while some will see it as Cup and Handle pattern. Reminder - We still need a decisive breakout of the Stage 1 Range or neckline. The next major overhead supply turns out to be around $47,000.

BITCOIN TO GO SHORTBitcoin just broke through the inflection point towards the value area and has reacted with the value area. This could mean that there is a very high possibility of Bitcoin going short for the next months. This means that 2024 could overall be a "short" year for BTC.
So what could this mean for investors concerning Bitcoin ?,
Firstly it means that if price presents opportunities to buy , we could expect short asset holding periods on Bitcoin.
Secondly, this first quarter will be the best time to sell of BTC assets as the prices for selling Bitcoin for the year may currently be at its highest value.
Thirdly, the 4th quarter of the year might be the best time to buy BTC at low and good prices for holdings.
I provide personal BTC investment advices, so if you will want more insights and information on when to buy, hold and sell your Bitcoin assets, kindly DM me here on trading view and i will reach out .
Also if you found this information helpful please do like , share and comment on your thoughts and do follow me for more as well.
Thanks for reading

Bitcoin Bitcoin is currently forming a FLAG & POLE pattern.
Wait till it breaks the descending trendline and retest plus bounce from it.
Max target would be 50000.
Be careful of liquidation candle

BTC → Bitcoin Sell-off at $45,800! Time to Short? Let's Answer.Bitcoin made it to the measured move target at $45,800 which was followed by a massive 11% sell-off in the course of an hour. This is the second major sell-off at these levels in under a month. Is this the opportune time to short?
How do we trade this? 🤔
We have several data points in favor of a short. We've completed a Measured Move, three legs up in a bull trend, two massive sell-offs (8% and 11%) in under a month at the major resistance level of $46,000 and an RSI under its Moving Average. I also have my Bitcoin Lifetime Analysis which describes in far more detail, why we need a massive pullback before we see new all-time highs:
We need to wait for a 4HR candle to close below its 200EMA or a Daily candle to close below its 30EMA. You could argue its reasonable to short now, but we lack confirmation, so the probability of profit is lower at this stage. I prefer more probability in my trades.
💡 Trade Idea 💡
Short Entry: $42,600
🟥 Stop Loss: $46,900
✅ Take Profit: $38,300
⚖️ Risk/Reward Ratio: 1:1
🔑 Key Takeaways 🔑
1. Measured Move Complete!
2. Two Sell-offs near the $45,000 area
3. Three Legs Up in a Bull Channel
4. RSI at 52.00 and below Moving Average, Bias to Short.
5. Wait for Final Sell signal, Short 1:1 Risk/Reward.
💰 Trading Tip 💰
There is over a 60% chance of a measured move after the breakout of a major resistance, normally, a trading range. That means the distance from the trading range resistance, to the top of the breakout, will happen again above the top of the breakout.
⚠️ Risk Warning! ⚠️
Past performance is not necessarily indicative of future results. You are solely responsible for your trades. Trade at your own risk!
Like 👍 and comment if you found this analysis useful!

Will Bitcoin see 65K$Now Bitcoin is near $47K. $47K is the next resistance level for Bitcoin. If it passes this level, I predict that it can arrive at $60K and then FWB:65K in the near future. However, if it shows a reaction to $47K, I predict a correction till $37K. The correction can continue till $32K too in a pessimistic mood.
Anyway, I'm optimistic about Bitcoin's price in the near future because of some news about its ETF. In 2024, I hope it will see high prices.


Bitcoin on december and next year 2024Hello traders, i have very freaky ideas about bitcoinas follow: If bitcoin can not exceed 40000$ for next few weeks we will see a big dump to 10000$. Im writing this to think and consider probability about unthinkable cases that any trader may face just be ready for
everythings.
Big short
Sl:40000
Tp for long term: 10000
Period of time that this analysis stand: 6 weeks most after that if it can not break 40000 or fall bellow 31000 it s going range for long time.
Be profitable.

BTC bitcoin outlook 25-31i will be looking for longs to continue the bullish trend on the higher timeframe if we get confirmation of it at the highlighted SnD.
as always, follow your trading rules and position yourself wisely

$BITCOIN - One Huge Bull Flag and You are Going to Miss outQuite possibly the greatest bull flag pattern you will ever see

Will History Repeat Itself? - Hunting for ARCSThe Bitcoin chart showcased illustrates the characteristic parabolic arcs that in the past heralded significant market turning points. These arcs depict periods during which the price of Bitcoin rose sharply, only to experience equally vigorous corrections. Such patterns raise the question - will the current price movement of Bitcoin conclude with a similar parabolic arc? This visualization aims to direct investors' attention to these potentially key formations, which could act as signposts for predicting future price movements. Recognizing these arcs becomes a "hunt," where traders endeavor to discern potential warning signals before market history repeats itself.

Bitcoin's path to a new all-time-high of 138k USDThis is my forecast of the path that BTC will take to reach its new all time high of 138k USD on 18 May 2025!

Bitcoin Bulls VS Bears 🐂🐻Bitcoin, after a very significant rise, had a dip that in my opinion is healthy for the long term, but nothing alarming for now.
The red line (SMMA) has held the price perfectly on the 4H timeframe since November, which means that for now we continue with a bullish structure.
Therefore, only if a breakout below it happens, I will expect a more significant correction, initially towards the 38K support, but be aware that 35K is a big liquidity level.

Bitcoin Possible Pullback to 43.7Bitcoin near the top of our rising broadening wedge but could pullback before it goes higher.4 Hour shows possible pullback
Thanks for watching

Can Bitcoin Hedge Against a Falling Dollar?Global inflation often signifies a weakening of global currencies. The question of whether Bitcoin can serve as a hedge against a depreciating dollar has gained significant interest among investors.
Or should it still be the Gold?
In this study, we will analyse the top 8 cryptocurrencies to determine which one is a more reliable currency hedge.
Bitcoin & Its Minimum Fluctuation
$5.00 per bitcoin = $25.00
BTIC: $1.00 per bitcoin = $5.00
Code: BTC
Micro Bitcoin & Its Minimum Fluctuation
$5.00 per bitcoin = $0.50
BTIC: $1.00 per bitcoin = $0.10
Code: MBT
Disclaimer:
• What presented here is not a recommendation, please consult your licensed broker.
• Our mission is to create lateral thinking skills for every investor and trader, knowing when to take a calculated risk with market uncertainty and a bolder risk when opportunity arises.
CME Real-time Market Data help identify trading set-ups in real-time and express my market views. If you have futures in your trading portfolio, you can check out on CME Group data plans available that suit your trading needs www.tradingview.com

Bitcoin Falling to $35,000!? The Ascending Wedge Calls for Doom.Bitcoin has fallen out of the 4HR bull channel and failed to break above the Weekly Resistance 3 times. This is a decent short-term sell signal that if your trade is managed properly, the probability of profit is on your side.
How do we trade this?
Bitcoins macro trend is bullish, so we must exercise caution when considering a short. While the trend is a major data point, we must also consider the rest of the picture in front of us. Bitcoin has failed three times to break Weekly Resistance, a reversal signal. We've fallen out of the 4HR bull channel, another signal to sell. There's a gap to minor support which has been tested twice and the RSI is below the Moving Average with room to fall; all data points in favor of a short.
It is reasonable to have a short-term sell bias on this 4HR timeframe but proceed with caution. The first sign of a bull reversal bar closing on or near its high means it's time to exit the trade.
Trade Idea:
Short Entry: $37,630
Stop Loss: $38,270
Take Profit: $36,350
Risk/Reward Ratio: 1:2
Key Takeaways
1. Fell out of Bull Channel, Now in Ascending Wedge.
2. Currently re-testing bull channel support.
3. Gap down to Minor Support at $36,200.
4. RSI at 48.00 below Moving Average, Bias to Short.
5. Short to Minor Support.
You are solely responsible for your trades, trade at your own risk!
If you found this analysis helpful, click the Boost button and let us know what you think in the comment section below!

📈Bitcoin weekly prediction, 40K or 32K?📉 BINANCE:BTCUSDT
COINBASE:BTCUSD
Hello dear traders. If the price of Bitcoin stays above Bollinger midline, Bitcoin can continue the bullish scenario up to the target of 39K-40K.
This week, the price of Bitcoin is in a stabilization trend and has lost its upward momentum at the level of 38 thousand dollars. (in yellow).
The Bitcoin Dominance chart is in a 5-day time frame, and according to the formed pattern, it is expected to decrease to the specified area. On the other side, Dominance Tether (Weekly TF) has hit an important support line, and the probability of its upside has increased.
All in all, in my opinion, until the price of Bitcoin falls below the support of the yellow line, there is a possibility that it will rise to test the level of $40,000. But if the price loses the red support line, then the $32,000 area will be a strong support for Bitcoin in a bearish scenario.
✌💥If you are satisfied with my analytical content, please share my ideas💥✌
✍🐱👤Otherwise, make sure you leave comments and let me know what you think.🐱👤✍
🍾Thank you for your support. I hope you will gain profit by following my analyses.🍾

Bitcoin: One Person's Fear is Another Person's GreedFirst off, what the f*ck?
I believe Bitcoin should correct back to at least the 50% Fib Level -- if not the 38.2% -- so that we can see a healthy rally upwards. Years of trading crypto has taught me that every rally has a near equal correction. But emotions and bias will be the death of your portfolio so here's my unbiased analysis of the world's greatest cryptocurrency:
- Bitcoin is forming an ascending triangle on multiple charts which is a bullish sentiment on its own.
- On-Balance Volume (OBV) shows a steady increase in buying pressure since the start of the recent rally. Layman's terms: buying pressure is outcompeting selling pressure.
- Money Flow Index (MFI) has an inverse slope that favors oversold and is currently relaxing in neutral territory safely away from overbought.
These three indicators lead me to believe that Bitcoin may experience another breakout in the coming weeks and, potentially, without a dip back to $30.5K as I previously forecasted. At risk of stating the obvious, news can shake the markets enough to reverse any trajectory but yesterday's Binance update hardly rattled Bitcoin like it did for altcoins.
It's my personal opinion that the Bitcoin ETF decision is the closest catalyst in determining the next major rally or drop. However, we can't forget about the highly anticipated Bitcoin halving which is expected around April 2024. If the ETF does get rejected, this may provide a very lucrative buying opportunity.
COINBASE:BTCUSD

Will Bitcoin Price Drop to $34,000?BTC needs to close above the $36,800 level for a 4-hour candle to signal a potential move. If it manages to close above $36,800, the target will be $38,500.
However, if it fails to reclaim $36,800, the movement will likely start from the current level ($36,400), initially targeting the $34,200 zone and then potentially dropping to $33,400.
In the previous analysis, we achieved an 8% gain. You can view the analysis in our profile.
NFA.

Bitcoin Continues Consolidating With Maybe A Wick UpBitcoin trying reach the highs as its at 37.5 right now and its consolidating, we could see a higher wick or a pullback and then a wick to upside.Explained in details
Thanks for watching
