Analysis of Bitcoin's Recent Price Movement and Technical PatterBINANCE:BTCUSD
I wanted to provide you with an analysis of the recent price movement of Bitcoin, particularly its drop from the 30k area to the 26k area. This movement has attracted significant attention from investors and traders alike, and I believe it's important to understand the underlying technical factors at play.
Price Movement Overview:
Over the past few weeks, Bitcoin has experienced a notable decline in its price, with it dropping from the 30k area to the 26k area. This represents a decrease of approximately 13% within a relatively short time frame. Such price movements often trigger discussions about potential trends and patterns in the market.
Double Top Pattern:
One prominent technical pattern that has emerged is the formation of a double top pattern on the weekly chart. A double top pattern is a bearish reversal pattern that occurs after a prolonged uptrend. It's characterized by two peaks at roughly the same price level, separated by a dip. In this case, the first peak was around the 30k area, followed by a decline, and then another attempt to reach similar highs before the drop to the 26k area.
Support Level:
Currently, Bitcoin seems to have found support around the 26k area, where it has previously bounced off during its earlier bull run. The concept of support suggests that there is a level at which buying interest outweighs selling pressure, leading to a potential price rebound. Monitoring how Bitcoin reacts at this support level will be crucial in determining the short-term direction of the market.
Implications:
The formation of a double top pattern coupled with the support level around 26k raises interesting possibilities. If Bitcoin fails to gain momentum and breaks below this support, it could signal further downward pressure, potentially leading to a more prolonged correction. On the other hand, if Bitcoin manages to hold its ground and reverses the current trend, it might indicate a continuation of the broader uptrend.
Conclusion:
In conclusion, the recent price movement of Bitcoin from the 30k area to the 26k area has sparked discussions about technical patterns and support levels. The emergence of a double top pattern on the weekly chart suggests potential bearish implications, while the current support level adds an element of uncertainty. Traders and investors will be closely watching how Bitcoin reacts in the coming days to gain insights into its short-term trajectory.
As always, the cryptocurrency market is known for its volatility, and a comprehensive analysis should consider a variety of factors beyond technical patterns. Please feel free to reach out if you have any further questions or require additional analysis.
Disclaimer:
This idea and analysis is my own and is not financial advice
Bitcointrend

BTCUSD Breakout TradeBTCUSD wait for breakout and trade in the direction of breakout.
Manage your risk according to account size!

bitcoin predictionIt's important to carefully observe this trendline.
1. If it falls, go long at 29,200.
2. If it falls further, go long at 27,600.
3. If it rises, go short at 29,850.
4. If it rises further, go short at 32,100.

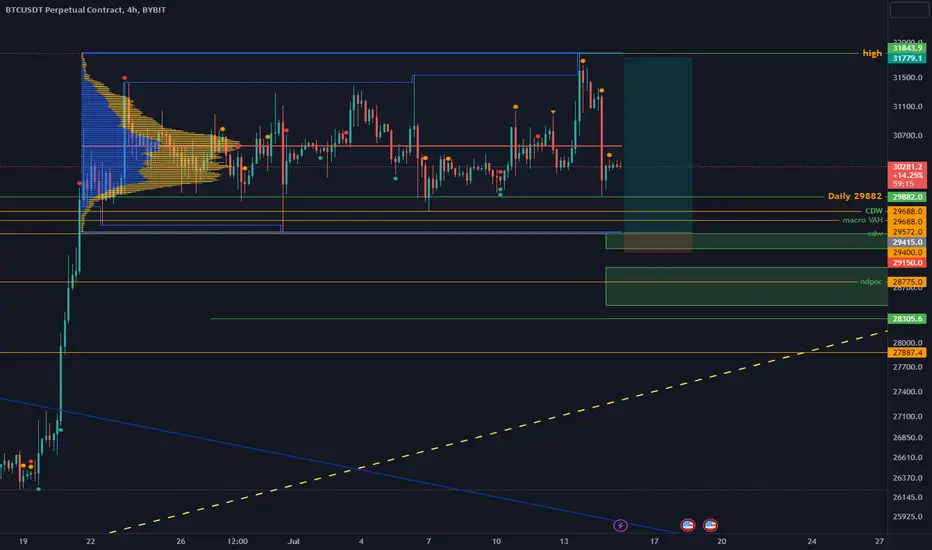
BTC LONG #3 - SHORT TERMHave another setup here, theres a couple of entry points here, one is here on the button of the golden pocket... there is also a chance that we could see a wick down into the bright green area on h1 chart as this is a value area. So scaled positions could work great here. Targets are up at the m15 sell area in confluence with h1 fibb targets. will update in the comments.

BTC Historic & Current ValueIn this idea we'll have a look at the history of BTCUSD on a daily timeframe using value maps based on-chain balanced price and market data. Additionally, we'll take a look at BTCUSD on a daily timeframe using market price value oscillator.
The chart below shows a value map that takes into account the balanced BTC on-chain price and projects that onto a custom value map (grid) which shows both local and market tops/bottoms.
The chart below shows a value map based on pure market data and time which shows two bands. The top band shown in pink/blue shows market tops and the bottom band in yellow and orange showing market bottoms.
Below is both the on-chain value map and the market value map bands together which provides a very clear picture of both historic market cycles and the existing market progress with $32,000 being a key resistance level.
Next we'll have a look at a custom market price value oscillator that is designed to show the best purchase opportunities in green, secondary good purchase opportunities in blue, best shorting opportunities in purple and market tops in red.

A new lost decade of stagflation is comingYou better get used to working hard, because the days of easy magic fairy dust money are long gone after 40 years of mania.
The following scenario is going to make wallstreet very angry and I'm sure a lot of retail investors are going to be forced to give up and start working longer hours to adapt to an expensive already inflated life that just won't lower prices anymore, while at the same time, record high interest rates have already made it much harder for everyone to access bank loans and 0% credit cards.
From Japanese herbivore men to Western Men Going Their Own Way, Japan during the 80s and 90s is the textbook play for the world to follow.
What is usually known as "depevelopment" is actually a 4th stage of population growth/flattening that will surely lead to a global ageing population or demographic and pension crisis in the coming years and decades.
So technically, there won't be any great depression like 1929, and there won't be any hyperinflation either (except for a few failed states in Latinamerica of course),
A recession is not as boring and as predictable, as an eternally long stagflation, which is the most hated but necessary scenario to push foward out of so much debt.

BITCOIN ANALISYS
Price has broken previous daily accumulation, seems like it broke below forming a CHOCH and now im expecting a retrace after distributing below previous daily low
SELL LIMIT @ 29284
✅TP 1 29172
✅TP 2 29045
🚫SL 29405
⏰TIME: 1 DAY
📊R-R: 1-2.5
📍RECOMMENDED RISK: 1.00%

Bitcoin Is Secure:3 Steps To Solve Capital LossAddressing loss of capital in Bitcoin involves managing your investments and risks wisely. While there are no foolproof strategies, here are three steps to help mitigate potential losses:
Diversification: One of the fundamental principles of investing is diversifying your portfolio. Instead of putting all your capital into Bitcoin alone,
consider spreading your investments across different asset classes, such as stocks, bonds, real estate, or other cryptocurrencies.
Diversification helps reduce the impact of a single asset's poor performance on your overall capital. If Bitcoin experiences a significant decline, having other investments can help offset some of the losses.
Risk Management: Develop a clear risk management strategy. Decide on an acceptable percentage of your capital that you are willing to risk on Bitcoin or any other high-volatility investment.
This is often referred to as setting a "stop-loss" level. If the value of your Bitcoin investment reaches that predetermined level, you will sell to minimize further losses.
It's essential to stick to your risk management plan and not let emotions dictate your actions during times of market volatility.
Stay Informed and Avoid FOMO: Stay updated on the latest news and trends in the cryptocurrency market.
Being informed about factors that could affect Bitcoin's price can help you make more educated decisions.
Additionally, avoid falling into the "Fear of Missing Out" (FOMO) trap. FOMO can lead to impulsive decisions, such as buying at the peak of a rally, which increases the risk of losses when the market corrects.
Bonus Tip: Consider using dollar-cost averaging, where you invest a fixed amount of money at regular intervals (e.g., monthly)
instead of making a lump sum investment. This strategy can help mitigate the impact of short-term price fluctuations and potentially improve your overall average entry price.
Remember that investing in Bitcoin or any other cryptocurrency carries inherent risks, and past performance is not indicative of future results.
Only invest capital that you can afford to lose, and always conduct thorough research before making investment decisions.
If you're unsure about investing in cryptocurrencies, consider seeking advice from a financial advisor with expertise in this area.

Bitcoin history and future1W time frame
-
Every vertical dotted lines stand for halving timing, we call them "a cycle" between two lines.
Every cycles have similar trend, we can mark them with three colors as below.
(1) White range stand for Bull high to Bear second low
(2) Red range stand for Bull high to Bear low
(3) Green range stand for Bear low to Next halving
According to halving in 2012 and 2016, we can expect Bitcoin make a second low (below 20000) in near future, the most possible time range is from August '23 to February '24.
Before the second low coming, Bitcoin will likely reach price over 33000, therefore, be careful of being fomo and get ready with patience to buy spot.

New Bull Run Is Gonna Start But Till When?I have split EMA 50/200 Golden Cross and Death Cross in 3D chart.
As we see we have bar/accumulation zone then we have bull run, for many people bull run means ATH but I don't think like this, it is a long term trend.
Trend will start soon even covid black swan couldn't make it death cross so this trend is %100 till now.
From 21.07.2023 our golden cross will start (hope so) and we will forward, first we should move at least %50 upside, correction. Retest for 200 EMA, probably will be somehere 30K then another steps up to upside.
Adoptation, instutions, goverments, metaverse, de-fi 2.0, AI, CBDC count as many things for your long term plans.
Till 2026 we have death cross time period so bull run might finish end of 2025 or early 2026.
So are you still afraid that Bitcoin gonna 10K?
There will many times to scared but not right now, please don't fomo in, don't all in. Crypto is risky asset.
Have a nice day, all of gonna be super rich!

Will Bitcoin Hold 30K And Push To 32K Finally ?Bitcoin been ranging in low 30K for a while and today we broke the bearish structure from 30.1.Could we finally see a new high ?
I still root for 32K before 28.8
Thanks for watching

Bitcoin Holding 30K.Soon To Go To 32.6!!Bitcoin holding 30K over the weekend with Ascending triangle pattern forming on 4H. possible breakout to the upside and then retest above the daily close for continuation to the upside.
Some Alts Looking Insanly Bullish.
Thanks for Watching

bitcoin long setup bitcoin best long from value are low . poc
u can target up to value are high .
hello Traders, here is the full analysis for this pair, let me know in the comment section below if you have any questions, the entry will be taken only if all rules of the strategies will be satisfied. I suggest you keep this pair on your watchlist and see if the rules of your strategy are satisfied. Please also refer to the Important Risk Notice linked below.
Bitcoin. The beginning of the end?Bitcoin. The beginning of the end?
#Bitcoin.
I'm observing a sell-off in the asset. A set of short positions. That doesn't mean we're going to go down in flames. It means we can try to win back a short position, which is what I'm going to do.
My sell entry will be at the marks:
$31,400 - $31,600 as soon as there's a retest of that level.
At the retest I will look for reversal patterns and weakness of the asset. After that I will make a decision to enter the trade.
I wish you a good day, dear colleagues. Let's try to make money for a living)

bitcoin prediction1. 29800 Long
2. 28700 Long
3. 27900 Long
Trade with caution.
Lower the leverage.
The issue can be resolved by purchasing in thirds with a 5x leverage.
Why do we liquidate everything at once when the leverage is over 20x?
Let's receive feedback for me and grow together by learning patiently.

btcusdt - lets to down if you like the idea, please "Like" it. This is the best "Thanks!" for the author 😊 P.S. Always do your own analysis before a trade. Put a stop loss. Fix profits in installments. Withdraw profits in fiat and please yourself and your friends.

1 Week Bitcoin Triangle & Trajectory This Is 1 Week Bitcoin Triangle & Trajectory ^.^ Let Me Know What You Think ^.^

3 Month Bitcoin Triangle & Trajectory 3 Month Bitcoin Triangle & Trajectory ^.^ Let Me Know What Yall Think ^.^


bitcoin prediction- I said I would take a short position if B rebounds near 31,000.
- Currently, B has rebounded more than expected due to the expansion flat,
and now only a drop towards Z remains.
- There is a possibility that Z could drop to 28,850,
which is 161.8% of the length of W.
My perspective remains the same.

Bitcoin Giving Us Daily Reversal PatternBitcoin Printed An 8H Reversal Pattern Yesterday And Daily reversal pattern Today.The signs are there for a huge reversal. Is it Real or Jebait ?
Thanks for watching

bitcoin prediction-The final Z-wave could be near 28855, which is 161.8% of the length of the W-wave.
-The current decline could occur as quickly as today or take up to 5 days to unfold.
-Taking into account the possibility of a B rebound up to around 31k,
one could consider holding back and potentially shorting near that level.

bitcoin prediction- There is a high probability that 'c' will decline around 31420,
which is the same length as 'a' in a 1:1 ratio.
- I will take a short position near 31420.
