GBPUSD | Perspective for the new week | Follow-UpIt has been over 300pips plunge in our direction since my last publication on this pair (see link below for reference purposes) and it appears we are in the middle of a correction phase that might incite a further risk in decline for the Pound in the coming week!
It is obvious that the British pound rallied a bit during the course of last week trading session but relinquished some of the gains during the latter part of the week and the rapid spread of the Delta plus covid strain in Britain has a high possibility of threatening the already delayed economic reopening, which may further incite fear of buying the Pound.
Tendency: Downtrend (Bearish)
Structure: Breakdown | Supply & Demand | Trendline
Observation: i. A significant Breakdown of both the Bullish trendline and Key level @ $1.40000 on the 16th of June 2021 buttress a clamour for Bearish tendencies in the coming week.
ii. I also noticed that the Bullish tendencies that began last week appear not to have the strength to push the price further after citing multiple rejections of Trendline/Key level @ $1.40000 on the 23rd/24th of June 2021.
iii. Should price try to climb early in the new week, I have identified a niche for selling opportunity around $1.39740/1.41000 with confirmation below Key level @ $1.40000.
iv. A Further plunge below $1.38000 (breakdown/retest) might welcome addition to the existing position.
v. CAUTION: Considering the overall Bullish perspective on this pair, it is advisable that we remain extremely patient should the price remain above Key level... Trade consciously! 😊
Trading plan: SELL confirmation with a minimum potential profit of 300 pips.
Risk/Reward : 1:4
Potential Duration: 5 to 10days
NB: This speculation might be considered to make individual decisions on the lower timeframe.
Watch this space for updates as price action is been monitored.
Risk Disclaimer:
Margin trading in the foreign exchange market (including commodity trading, CFDs, stocks etc.) has a high risk and is not suitable for all investors. The content of this speculation (including all data) is organized and published by me for the sole purpose of education and assistance in making independent investment decisions. All information herein is for your reference only and I take no responsibility.
You are hereby advised to carefully consider your investment experience, financial situation, investment objective, risk tolerance level, and consult your independent financial adviser as to the suitability of your situation prior to making any investment.
I do not guarantee its accuracy and is not liable for any loss or damage which may result directly or indirectly from such content or the receipt of any instruction or notification therewith.
Past performance is not necessarily indicative of future results.
Breakdown


Wyckoff consolidation seems to have failedWithout a huge push ASAP we’ve failed the testing in late Phase D. Where it is now seems like a classic place to retest for a continuation to the downside because of the break and failure to bounce at $39,000

$GME To $194?Shares of GameStop have broken short-term support and have yet to test the 50%. I am anticipating deterioration this week before a bounce off of the support trend line and the 50%. Good Luck!


EURJPY | Perspective for the new weekWe were unable to open a Bearish position in my last publication on this pair as the price continued to find a higher level ( see link below for reference purposes) but the current structure transposing into a Head & Shoulder - a strong reversal pattern suggests that the bears might lead to further decrease in price in the meantime.
Tendency: Downtrend (Bearish)
Structure: Reversal pattern (H & S) | Supply & Demand
Observation: i. It is obvious that the price has continued to climb high for the Euro since the beginning of the year 2021 and it appears to be at a juncture where we might consider the beginning of a temporary correction after observing the appearance of a Head & Shoulder pattern.
ii. Head & Shoulder: A baseline with three peaks; the outside two are close in height and the middle is highest describes a specific formation that predicts a bullish-to-bearish trend reversal.
iii. The later part of last week witnessed price breaking down Y132.800, a level which held price "Supported" (Demand zone) in the last 17days with clues suggesting a risk of further decline in the nearest future.
iv. In this regard, I have identified a niche for selling opportunity around Y133.400/133.000 should the price climb up early in the new week.
v. Below Key level II @ Y132.800 might be a level for conscious trading as price running below the Neckline gives succour for Bearish momentum... Trade consciously! 😊
Trading plan: SELL confirmation with a minimum potential profit of 100 pips.
Risk/Reward : 1:3
Potential Duration: 3 to 7 days
NB: This speculation might be considered to make individual decisions on the lower timeframe.
Watch this space for updates as price action is been monitored.
Risk Disclaimer:
Margin trading in the foreign exchange market (including commodity trading, CFDs, stocks etc.) has a high risk and is not suitable for all investors. The content of this speculation (including all data) is organized and published by me for the sole purpose of education and assistance in making independent investment decisions. All information herein is for your reference only and I take no responsibility.
You are hereby advised to carefully consider your investment experience, financial situation, investment objective, risk tolerance level, and consult your independent financial adviser as to the suitability of your situation prior to making any investment.
I do not guarantee its accuracy and is not liable for any loss or damage which may result directly or indirectly from such content or the receipt of any instruction or notification therewith.
Past performance is not necessarily indicative of future results.

EURUSD | Perspective for the new week | Follow-upWe are yet to find an avenue for Bearish confirmation since my last publication on this pair as the price continues to find a higher high (see link below for reference purposes). Continuous rejection of the $1.22500 level since mid-May 2021 is a clue pointing at the possibility of a bearish momentum building up at this juncture in the market.
The prospect of positive clues on Federal Reserve monetary policy and weakness in the euro appears to be restoring some confidence back for the Greenback in the coming week(s) as I am looking forward to a Breakdown/Retest of Neckline which is also a Key level @ $1.21200 for confirmation.
Tendency: Downtrend (Bearish)
Structure: Breakdown | Supply & Demand | Trendline
Observation: i. The line drawn under pivot lows is a visual representation of the prevailing direction and speed of price action in the last couple of months.
ii. We have witnessed a sharp rise in the value of the Euro since the beginning of April 2021 and the multiple rejections at the $1.22500 area reveal a decline in Bullish momentum as Sellers appear to be on the verge of dictating the direction of price action in the nearest future.
iii. Breakdown of Trendline on the 3rd of June followed by a sharp rejection of same during last week trading session anticipates a change in direction.
iv. In this regard, I shall be looking forward to a Breakdown/Retest of Neckline (Key level I) @ $1.21200 for confirmations in the coming week.
v. Further plunge below Key level II @ $1.19500 might welcome addition to the existing position... Trade consciously! :)
Trading plan: SELL confirmation with a minimum potential profit of 250 pips.
Risk/Reward : 1:6
Potential Duration: 5 to 10days
NB: This speculation might be considered to make individual decisions on the lower timeframe.
Watch this space for updates as price action is been monitored.
Risk Disclaimer:
Margin trading in the foreign exchange market (including commodity trading, CFDs, stocks etc.) has a high risk and is not suitable for all investors. The content of this speculation (including all data) is organized and published by me for the sole purpose of education and assistance in making independent investment decisions. All information herein is for your reference only and I take no responsibility.
You are hereby advised to carefully consider your investment experience, financial situation, investment objective, risk tolerance level, and consult your independent financial adviser as to the suitability of your situation prior to making any investment.
I do not guarantee its accuracy and is not liable for any loss or damage which may result directly or indirectly from such content or the receipt of any instruction or notification therewith.
Past performance is not necessarily indicative of future results.


BTC-USD(Bearish Pennant Breakdown)After a brief consolidation in the last two weeks, BTC opened this week with negative sentiments. BTC formed a Doji candlestick on the weekly TF which depicts that market participants are currently in a state of indecision. At the time of writing, BTC is already down by more than 7% on the weekly basis.
On the downside, BTC is trying to sustain above its 50-WEMA which is placed at $33.4K, however, if we get a decisive closing below this level, the next significant support is present at $30K as 0.618 Fibonacci retracement level is present here, followed by the next major support at $27.7K
On the higher side, BTC is not able to close above its 0.50 Fib retracement level, present at $37K on the weekly basis, however, if we get a breakout from this level, the next resistance is placed at $40K followed by $43K.
On the Daily TF, BTC has already given a breakdown from its bearish pennant formation and broke its ascending trendline support, along with a death crossover, which depicts selling pressure is most likely to continue in the coming sessions. Daily RSI has also broken its ascending trendline which also signals bearish sentiments.

Channel pattern in BTCUSD: move towards $33k, or towards $38k ?Market in the last 24hrs
BTCUSD remained in consolidation. Trading volume has spiked up lately.
Today’s Trend analysis
BTCUSD is likely to move in the channel pattern in the immediate short term.
Price volatility remained significantly low at approximately 0.85%, with the day's range between $35532.17 — $36808.30.
Price at the time of publishing: $36106.72
BTC's market cap: $675.64 Billion
Out of 11 Oscillator indicators, 9 are neutral, and 1 each on BUY and SELL side.
Out of 15 Moving average indicators, 13 are giving a BUY signal, and 1 is neutral.
Indicator summary is giving a 'SELL' signal on BTCUSD .
Volumes have spiked up in the past 24 hours.
----------------------------------------------------------------------------------------
The analysis is based on signals from 26 technical indicators, out of which 15 are moving averages and the remaining 11 are oscillators. These indicator values are calculated using 4Hr candles.
Note: Above analysis would hold true if we do not encounter a sudden jump in trade volume .
----------------------------------------------------------------------------------------
Any feedback and suggestions would help in further improving the analysis!

Symmetrical TriangleIf BTC fall it will fall, if BTC won't fall it should
NOTE: Tread at your own risk // just sharing my ideas

BTC possible Breakdown to support between 20k and 30kThis is not a financial advice.
Stochastic thoughts.
Good luck!

BTCUSD 4h. Symmetrical Triangle - Breakdown. Target 24KHi everyone,
Thank you for considering reading my idea.
This is a separate update from my previous idea. But now, we are breaking down the symmetrical triangle. The target of this pattern is at 24K.
There is a possibility that this is maybe fakeout just like what we had 2 days ago. Though, if it's not, we may need hold support at 29-31K, our last support before breaking to our target at 24K.
Like this idea and follow me for more analysis like this.
Cheers,
Juvs

EURUSD: Weekly Forecast 20210606EURUSD had a breakdown as it broke below the bottom of a 2-month rising channel.
The price managed to recover some losses on Friday amid weaker than expected NFP but stayed resisted right at a neckline at 1.2170.
EURUSD is now expected to stay in a ranging mode and since the price is now at a high coupled with a breakdown, we are expecting more downward movement in the coming week.
This week, we will look for selling opportunities around 1.2170 and targeting 1.20, the equilibrium level of the current range.

symmetrical trianglemore likely bearish as it falls from up. also, RSI is showing already overbought :) but it should move with BTC

highly probable for BTC to dip again-RSI trending down
-fell under the 200 hourly MA
-broke down from a flag formation


GBP/JPY in a triangel, H4 near a sharp moveHi again Guys. I'm here with an interesting idea about GBP/JPY.
The chart shows everything very clearly.
In daily timeframe we are in an uptrend, but in H4 we have the triangel and this can indicate a weakening or temporary reversal of trend.
Only if the price breakdown the 153.500 it going to be a downtrend in H4,
Also the price can continue its bullish trend only if cross over the 154.800
You can enter a trade after breaking the numbers we told after a nice pullback of course.
Which do you think will happen, 1 or 2 ?
Thanks for your attention! :)

GOLD: Channel breakdown. The hunt continues!So. Gold breaks the ascending channel to the top, strengthening its troend movement. The strongest bear hunt is underway. The instrument at the moment breaks through the resistance of 1906.800 and will most likely continue its movement. I assume either a consolidation at the level or a correction to the 1906.8 level after a small long movement with further growth to the important target - 1960.0

GBP USD Analysis fGBPUSD is currently bullish, its at a swing low retracement point, we're expecting a swing high for the market to take out the previous highs and push higher, the market could further push down base on the fundamentals and whats going on in the market right now, but for now, lets wait for price action

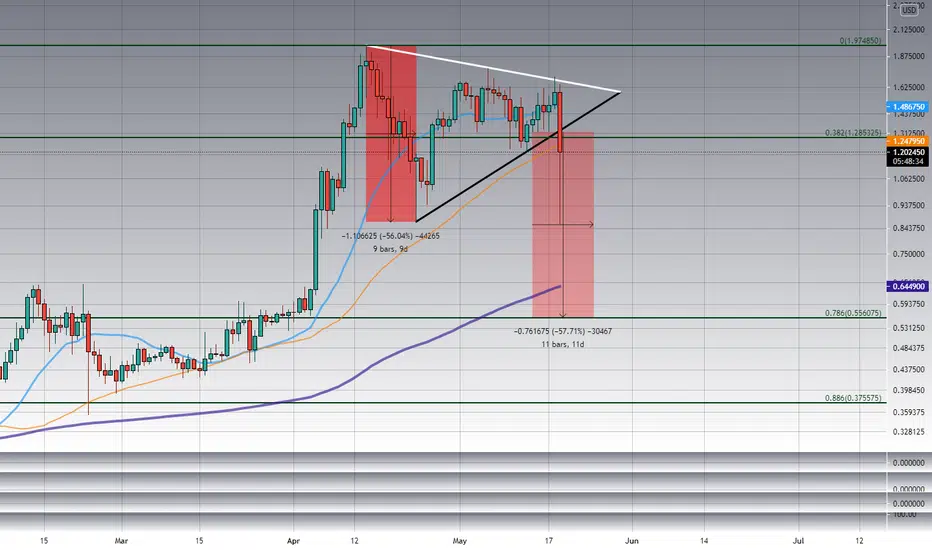
XRP Triangle Breakdown More Downside to ComeXRP is below the 55 day Moving Average and has broken down out of a triangle pattern. The measure move of this triangle pattern will take us down to the 200 day moving average near the 0.786 retracement.