BITCOIN 1st 1W MACD Bullish Cross in 7 months!Bitcoin (BTCUSD) is ahead of completing this week a Bullish Cross on its 1W MACD, which will be the first one after 7 months (since October 14 2024).
This is a major technical bullish development as since the very first one (Sep 26 2022) right before the November 21 2022 Bear Cycle bottom, it has always kick-started the Bullish Legs of this 2.5-year Channel Up.
In addition to that, this was accompanied by an Ichimoku Bullish Cross, where the Conversion Line (green) crossed above the Base Line (black). Considering also that exactly 4 weeks ago BTC found Support and rebounded on the 1W MA50 (blue trend-line), we can safely confirm a Bottom there and call for the minimum +100.73% rise, similar to the first Bullish Leg of this Channel Up. We remain consistent to our $150000 Target.
So do you think this 1W MACD Bullish Cross is the final confirmation we need for the new Bullish Leg? Feel free to let us know in the comments section below!
-------------------------------------------------------------------------------
** Please LIKE 👍, FOLLOW ✅, SHARE 🙌 and COMMENT ✍ if you enjoy this idea! Also share your ideas and charts in the comments section below! This is best way to keep it relevant, support us, keep the content here free and allow the idea to reach as many people as possible. **
-------------------------------------------------------------------------------
💸💸💸💸💸💸
👇 👇 👇 👇 👇 👇
BTC-D

BTC (Post Weekly Close Update)BTC has seen a weekly close above the 93700 support, suggesting bullish strength and likely continuation if this level holds on the weekly. We remain bullish as long as 93700 is maintained; a drop below it would be the first SOW on the HTF, potentially targeting 89K–90K, and possibly 1D OB at 83K–85K. Technically, this remains a LH until the 99500 SH is convincingly reclaimed, ideally on a weekly close.
On the daily, however, we’ve observed the first SOW, closing below the SH at 95K after a rejection from the 1D supply zone, refined into MTF HOBs, where whales initially sold off aggressively. This isn’t alarming, but it warrants attention. With the SPX at resistance, the DXY at support, USDT.D closing the weekly well above the SL at 5.03, and TOTAL at resistance, these are signs of caution, in my view, despite the series of bullish news we’ve seen. That said, with the HTF remaining bullish, we’ll focus on exploiting LTF and MTF moves. The FOMC meeting on Wednesday could certainly bring volatility in the markets, particularly as BVOL24H and BVOL7D, as mentioned in the last update, are at support.👀
To further examine the weakness, note the contrast between the two horizontal ranges (grey boxes). The first range saw a BO followed by impulsive PA, smashing through the 90K key level. In contrast, the second range produced a BO but encountered an HTF supply, resulting in a notably weaker bounce compared to the first BO from the lower range. This could potentially manifest as a deviation if the price closes below the RL, making the 8D HOB at 89K–90K our next target.
On the LTF/ MTF, we’ve also seen a break below the TL, with the other resistance TL being respected, indicating further weakness. Although we haven’t yet seen HTF weakness, I believe a scalp-sized short from the 11H OB, refined into a 2H HOB at 95500 SH, makes sense with a tight invalidation, or from the MTF level around 97500, if provided. If the daily closes above 95500 again, I might consider a scalp long into the 1D supply for a potential DT or even the 100K psychological level.

Watching for 88.5-89KMorning folks,
So, upside spike has happened and our 3-Drive + butterfly patterns are done. Although we haven't got continuation to 98K area that also was on a table.
Now short-term sentiment has changed. Recent data shows that the Fed doesn't need to hurry up with rate cut, yields turns up, so BTC also could follow the common tendency with deeper retracement.
This is the reason why we do not consider any longs today. As a nearest area that might be reached we consider 88.5-89K support.
So, for bulls it is nothing to do. If you're intraday trader, you could consider bearish positions from predefined Fib levels on the picture. 3-Drive hasn't reached its target yet, so 92.5-93K area still could be reached...

BITCOIN → Correction to the risk zone. Rise or fall?BINANCE:BTCUSDT has updated its local maximum to 97,900, the market structure is quite positive, but still depends on the fundamental background and the behavior of the S&P 500.
The fundamental reasons that influenced the growth are the improvement in the tariff situation in the US and relations with China. Bitcoin's growth strengthened as the SP500 index rose, with which it has a fairly high correlation. In the second half of this week, the price broke out of the two-week consolidation, breaking through the resistance level of 95,500 and updating the local maximum. A correction is forming within the local upward channel.
95,000 is the liquidity and risk zone. That is, if the bulls hold their defense above 95K during the retest, Bitcoin will continue to grow in the short and medium term. Otherwise, a break of 95K could trigger a drop to 92K-88K.
Resistance levels: 97,425, 99,475
Support levels: 95,500, 92,000
All eyes are on the 95.5K support level, below which a huge liquidity pool has formed. Growth may be influenced by a retest (false breakout of support) and an imbalance of forces in the market. But we need to be careful, as the market will react to economic data. BUT! A return of prices to the selling zone (below 95000 - 95500) and the inability to continue growth could trigger a correction and liquidation.
Best regards, R. Linda!

Bitcoin Price Action Analysis – Bearish Correction Toward DemandHello Guys!
Let's analyze btc!
Rising Trendline Break: The bullish structure has broken down as the price failed to hold above the key support region around $96,000–$96,200.
Targeted Demand Zone: The highlighted purple box between $94,200 and $94,700 represents a demand zone that has previously shown strong buyer interest. The current structure suggests Bitcoin may revisit this zone for a potential bounce.
Bearish Momentum: A large arrow indicates the directional bias toward the downside, aligning with the correction and market sentiment.
Fake RSI Divergence: The RSI panel indicates a “Fake Divergence” pattern, which may have misled early bulls. RSI has since dropped and currently hovers in the neutral zone, with no strong bullish signals yet.
_____________________________
Conclusion:
Unless a strong bounce occurs around current levels, Bitcoin looks poised to correct further toward the $94,200–$94,700 demand zone. Traders should watch for reactionary price action and bullish reversal patterns before considering long entries.

BTC/USDT – Weekly Chart Analysis (Long-Term View)BTC/USDT Chart Pattern: Multi-Year Cup and Handle Formation
The chart shows a textbook “cup and handle” formation, a highly reliable bullish continuation pattern. This pattern has played out over several years (2021-2025), indicating long-term accumulation and a breakout attempt.
Cup Phase:
Extended from mid-2021 to early 2024.
Formed a deep and rounded base, often indicating institutional accumulation.
The rounded lows reflect a gradual sentiment recovery from the 2022-2023 bear market.
Handle Phase:
A short-term consolidation after moving above the $70,000-$74,000 resistance area.
Price action pulled back marginally after hitting $110,000, forming higher lows near $85,000.
The structure resembles a bull flag or pennant, which is usually seen before the next upward move.
Key Support and Resistance Areas:
Key Support $70,000–$74,000. Previous resistance turned into support
Psychological Support $85,000 Local Retracement Low
Immediate Resistance $100,000–$110,000 Near ATH, selling pressure area
Long-term Target $130,000+ Measured move from cup pattern
Volume: Volume was high during the breakout from late 2024 to early 2025, which validates the breakout from the cup resistance area.
If BTC breaks above $100,000–$110,000 with strong volumes, we can expect continuation towards:
$130,000 (short-term target)
$150,000–$180,000 (extension based on pattern symmetry)
Bearish Risks:
Failure to hold $85,000 could lead to a retest of the $70K support area.
Sustained breakdown below $70K would invalidate the bullish pattern, but this seems unlikely given the strong fundamentals and macro structure.
If you found this analysis helpful, hit the Like button and share your thoughts or questions in the comments below. Your feedback matters!
Thanks for your support!
DYOR. NFA

btc . april recap . may outlookMAY instantly starts with a SHORT SQUEEZE
- out of pwRange
- into cwRange + 1 step higher
- all good, all bullish - but a price drop on HTF would open great opportunities for SHORT + LONG, while keeping bullish momentum
02.04.2025 . SHORT IDEA
- after trading out of range, start trading the/within new range
- approaching cmHigh towards 2pm Berlin time
- ladder in for possible SFP
- give yourself a little wiggle room for the SL, if price breaks +2% and approaches the next SFP level, a short entry higher towards friday close has a better R:R
entry. 97368
tp1 . 950908
tp2 . 94095
tp3 . 85113
LONG IDEA
- wait and see where the price find its support
- possibility that we keep STRONG BULL momentum, if price stays within cwVA
- on the way there, find percentage levels for daily +1.5% trades

Bitcoin Buy Opportunity: Last Chance To Buy Below $100,000Bitcoin isn't trading at $78,800 nor $80,000 nor even $85,000 but still, even a small retrace is good to buy; even a small retrace is better to buy and enter a new trade than when prices are moving up.
A strong support range consisting from the lows of December 2024, January and February 2025 can be seen mapped on the chart. The lows on these date produced a support range between $89,250 and $94,250.
Bitcoin is now not trading within this range but if it does go there let me be the one to tell you that this would be an amazing entry zone and buy opportunity. This is marked green on the chart.
The truth is that when Bitcoin goes bullish it never looks back, it grows and grows and grows but, since we are set for the 2025 bull market and several new All-Time Highs, any retraces should be bought strong because there might not be another chance like this available.
Whenever the market goes red, that's the time to buy strong, go LONG and prepare for the continuation of the bullish trend.
Whenever the market turns green, we just let it grow and secure small portions of profits when resistance is hit. Rinse and repeat.
Right now Bitcoin is red but it won't be red for too long. See the trade-idea below to understand how Bitcoin will behave around this resistance zone:
It is the inverse image of the February drop. It will range a few days around this zone and then produce a very strong advance. This is your last chance to accumulate below 100K while Bitcoin is still low.
Once Bitcoin moves above 100K, 90K is gone. Just like $75,000, it is gone for this entire cycle. Just like $80,000, you cannot buy at $80,000 anymore. The same for $85,000 or anything below 90K.
This is the last chance to buy Bitcoin below $100,000 before the continuation of the bullish trend. This opportunity can remain open for a few more hours just as it can last a few days. But it won't be available for too long. Make your decision now, Crypto is going up.
Thanks a lot for your continued support.
Namaste.

BTC Roadmap — May 2025🚨 BTC Roadmap — May 2025
Here’s the timeline you’ll want to pin and come back to.
⸻
🔴 May 4–6
Low volume. No major moves expected.
BTC goes DOWN and BTC dominance starts trending down, but it’s not the moment to jump in yet. Patience.
🟢 May 7–9: ALT PUMPS
BTC Volume increases!
BTC UP
This is the first major altcoin opportunity.
🔴 May 10–13: SELL SIGNAL
This is your exit window.
1D SELL confirmed. Prepare for cooling.
BTC Volume drops.
⚪️ May 15–17: May USDT.D will go UP!
USDT dominance reaches a local bottom - BTC HUGE DUMP .
BTC Volume rises again → BIG MOVE up after 17th.
🟢 May 17–20: BTC and ALT PUMPS
Perfect LONG entry zone.
🔴 May 21–23: USDT HIGH — market will go UP faster!
USDT.D peaks. BTC and altcoins prepare for breakout.
BTC Volume high.
💸 Dollar weakens → Risky assets explode (BTC, alts, growth)
⸻
NOT FINANCIAL ADVICE

2 options but both are bullish!CRYPTOCAP:BTC is consolidating but wants to make a next leg next week. Or we break out out of the falling wedge or after some more consolidation in the ascending wedge.
either way bullish!!!

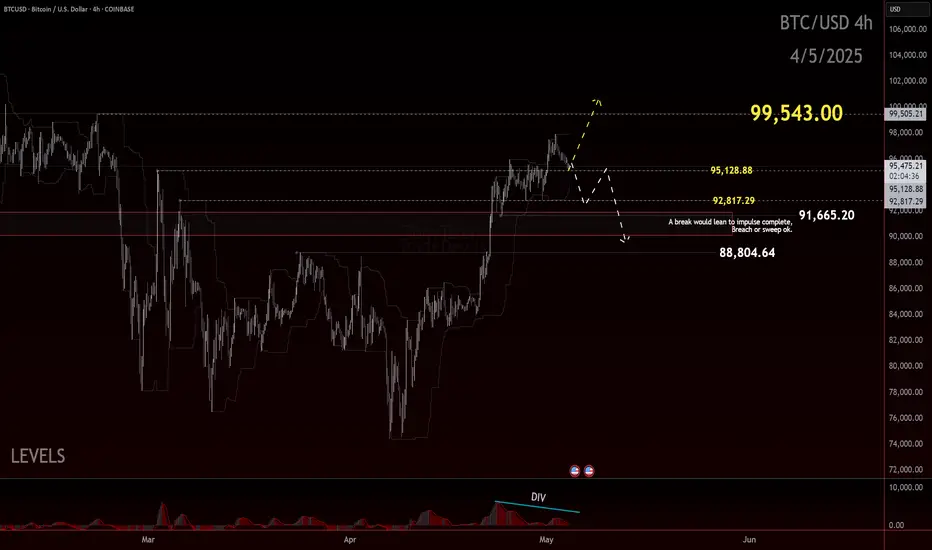
BTC: Balancing on the EdgeBitcoin held the $90.5K level and managed to flip prior resistance into support—an encouraging development, especially given how close price was hovering to the so-called danger zone. That flip marked a technical win for bulls, signaling potential strength in the short-term structure.
However, we’re not entirely out of the woods just yet.
While price is holding above support and showing some resilience, we’re still trading uncomfortably close to the edge of the recent consolidation zone. For now, $91.5K stands as the ideal level to hold.
The concern? If price starts slipping back below this newly established support, especially with conviction, that could be a signal of deeper retracement on the table. The bullish narrative would weaken significantly if we revisit and fail to defend those levels, potentially opening the door for a more sustained correction.
So, while the short-term structure remains cautiously optimistic, this isn’t the time for complacency. The market’s still in a precarious spot, and clarity will only come with either continued strength—or a confirmed break below support.
Eyes on $91.5K for now. Hold that, and the momentum favors the bulls. Lose it, and the deeper pullback scenario comes back into play.
Trade Safe, Trade Clarity.
Bitcoin Technical Analysis: Bearish Continuation with $95,200 TP
Looking at the Bitcoin/TetherUS chart from TradingView dated May 3, 2025, I can see a clear short-term bearish trend forming with several notable technical patterns.
The price is currently around $96,158.01, showing a decline of -0.17% with a volume drop of -0.75%. Let me correct my analysis for a short position:
KEY Technical Observations
- A descending channel has formed after rejection from the $97,200 resistance level
- Price is breaking down from a consolidation area around $96,327-$96,419
- The green shaded area indicates a projected downward movement targeting $95,349.80
- Consecutive red candles with increasing body size suggest accelerating bearish momentum
Trading Opportunity - SHORT POSITION
This setup presents a bearish continuation pattern with the following take-profit targets:
- TP1: $95,800 (initial target within the projection)
- TP2: $95,350 (projected bottom as indicated by the green zone)
- TP3: $95,200 (key horizontal support line)
Entry point for shorts would be on any retest of the $96,327 resistance (previous support now turned resistance).
Creative Strategy: The Emerald Descent
The green projection zone appears to be forecasting a controlled drop toward the $95,200-$95,350 area. This well-defined bearish channel presents an opportunity to ride the momentum down to these targets.
Set a stop loss above $96,600 to protect against unexpected upside movements.
The declining volume (-0.75%) suggests this move is a continuation rather than a panic sell, making it a more predictable technical play rather than an emotional reaction.

Bitcoin: First Leg Of Wave 5 To 109K.Bitcoin has lingered around the 95K resistance area over the previous week. In my opinion this is a sub wave iii completion (5 mini waves can be counted within the bullish breakout leg). This implies there is a greater probability of a retrace or sub wave iv (see wave count on chart). The retrace can go as low as the 90K support without overlapping sub wave i which would keep the bullish impulse in play. Also there is enough evidence here to suggest this structure is likely the first wave of the broader Wave 5 which can see a test of the 109K high over the coming months.
The current high (see arrow) shows signs of potential reversal at a location where such a pattern can be expected. The question is, when will it retrace and how far? It is anyone's guess. This is where you have to have the ability to adjust as the market provides new information. Until then the best we can do is assess loose probabilities and wait to see how the market aligns or not.
The adjustment process is two fold: evaluating support/resistance levels and assessing the RISK associated with a given scenario. For example, the illustration on the chart shows a retrace back to 90K, this or some variation of this scenario may or may not unfold. The key is to have levels identified in advance and then WAITING to see how the market behaves at such levels. Does it confirm our idea or not? In the case of Bitcoin now, the 95K area resistance is sticking and a reversal pattern has appeared which adheres to the retrace scenario, but how far it retraces is up to Bitcoin. We have to wait and see what type of bullish reversals appear and where they appear before RISK can be assessed for a swing trade on this time frame.
Markets that linger around levels can be very hard to trade if you are the type that forces trades or assert opinions. Slow grinds are especially tough to sit through which is why I always suggest evaluating smaller time frames while keeping this bigger picture in mind. There are plenty of smaller opportunities to capitalize on if you can recognize the support/resistance levels and trend structure on the smaller time frames without losing site of the bigger picture.
On this time frame for swing trades, I am not interested in the short side. I prefer to wait for the retrace (wave iv) measure to see how far it goes, WAIT for the reversal confirmation, then quantify the RISK from that point. IF this scenario appears, I would be anticipating a retest of the 100K resistance and expecting a greater chance of a breakout to a higher high (low to mid 100ks)? This can take at least two weeks to play out in my opinion. And if this scenario does not play out, then adjust to the whatever new information the market is presenting.
Thank you for considering my analysis and perspective.

Bitcoin Analysis (4H)Bitcoin has lost its trendline and appears to have accumulated significant sell orders near the top.
The zone between $96K and $100K could act as the main supply area, potentially pushing the price down to at least $88K.
Targets are clearly marked on the chart.
A daily candle closing above the invalidation level would invalidate this outlook.
Do not enter the position without capital management and stop setting
Comment if you have any questions
thank you

MSTR (Strategy) coming up to $395, the smaller resistance levelNASDAQ:MSTR has rebounded from the bottom fairly fast compared to other stocks and indexes. It's even performed better than Bitcoin itself. However it should be hitting heavy resistance now near 395-400 and above is only heavier resistance. It's time for a pullback and a breather for MSTR. Target is the Point of Control near $350, before going higher. However we could turn bullish again before reaching $350
I personally know someone who played with fire by buying MSTR options calls while it was dropping before, meaning he was trying to catch a falling knife and got burnt finally. He lost nearly $500,000 because of it. So I don't mess with options personally, however I will margin trade with stocks and trade futures, forex and leverage trade cryptocurrencies.

"Bitcoin Analysis" (Update)Here's what I can gather from the chart right now:
The Minor Resistance zone has been strongly broken to the upside; we haven't seen good pullbacks to this level yet.
On the other hand, below the broken zone, there's a price gap toward the FVG, as indicated by the arrow.
Also, the pullback to the breakout level at 0.382 has not been completed, and no patterns have formed in that area!
So? When we analyze all the breakout factors, we see a very high chance of a correction.
Now, this correction could start from the confirmation level at 96,364, or with an overextension, it could happen from the 98k zone.
Stay Awesome , CobraVanguard

BTC breaks out - Can it sustain the bullish momentum?Over the past week, Bitcoin (BTC) has shown notable strength, forming an ascending triangle pattern, a typically bullish structure that often resolves to the upside. True to form, BTC has now broken out above the triangle's resistance, pushing higher with strong momentum.
-------------------------------
Price target ascending triangle
This breakout sets a technical price target above $98,000, suggesting there’s still significant upside potential if the pattern plays out fully. However, the rally is now approaching a critical test.
-------------------------------
Golden Pocket + POC
BTC is currently moving into a zone of strong resistance, both the Golden Pocket Fibonacci retracement level and the Point of Control (POC) from recent months converge in this area. These technical levels often act as magnets for price and can serve as significant barriers, potentially leading to a pullback or consolidation.
-------------------------------
Stochastic RSI
Adding to the caution, the daily Stochastic RSI remains in overbought territory, where it has lingered for an extended period. While this doesn’t guarantee an immediate reversal, it does suggest that a corrective move could be on the horizon.
-------------------------------
Conclusion
Still, there's a chance BTC could first push toward the psychologically significant $100K level before any major retracement occurs. Traders should keep a close eye on how BTC behaves around this key resistance area, confirmation or rejection here will likely shape the next major move.
-------------------------------
Thanks for your support.
- Make sure to follow me so you don't miss out on the next analysis!
- Drop a like and leave a comment!


BTC can move slingshot? - When 87k?BTC as mentioned, have a slingshot move as mentioned above and shall come to the SVP 95,010, where can move up again

BTCUSDwhat a long on btcusd 100% correct prediction on my previous analysis. this time i see a strong manipulation unless strong break above 9700 then good pull back to enter long, or strong retest back to 7500 to get the range retest on weekly ( bos ) to enter long, with good confirmation.
as i have draw the line with a,b,c do your own anaylysis for any good decisio. let me know what you all think, leave a comment below. give it a like if you see my work is good.

BTC Outlook May 2025CRYPTO:BTCUSD
Bitcoin Nears Major Resistance – What Comes Next?
As of this writing, Bitcoin is trading around $96,000, climbing steadily as it approaches what I believe is a critical resistance zone between $98,000 and $102,000. This area has the potential to act as a major turning point.
If Bitcoin can break through and hold above the $102,000 level, I believe there's a strong chance we see continued momentum pushing the price toward $120,000 or even higher. However, if Bitcoin is rejected at this resistance zone, it could mark the beginning of a retracement, with the next major support area appearing around the $71,000 level.
This zone of resistance is, in my view, one of the most important to watch in the current cycle. Whether Bitcoin can establish new support above it—or get turned away—could shape the trajectory for the rest of the year.
Previous Bitcoin Outlook
Disclaimer: The views expressed in this article are my personal opinions and should not be considered financial or investment advice. Trading cryptocurrencies involves significant risk, and you should always do your own research and consult with a financial advisor before making investment decisions.

Ava-Bullish Setup Forming higher lows. Break above resistance may trigger strong upside.
BINANCE:AVAUSDT

BUY BTCUSD ScalpI am buying BTCUSD 96000, lets try this for a short scalp. This is my personal bias, practice at your own. No any financial advise just for learning purpose.
