BTCUSD: Reclaimed 100k after 3 months! Next wave to $190k.Bitcoin has turned overbought on its 1D technical outlook (RSI = 73.178, MACD = 2904.000, ADX = 30.769) as it reclaimed the $100,000 marke after exactly 3 months. This is a very structured bullish pattern that consists of a Bullish Wave that peaks and leads to a Megaphone consolidation, which in turn starts the next Bullish Wave. Both waves so far have been around +16.30%. As the 8H MA50 perfectly held Tuesday's low, the pattern has already started the new Bullish Wave, which technically aims for yet another +16.30% rally (TP = 109,000).
## If you like our free content follow our profile to get more daily ideas. ##
## Comments and likes are greatly appreciated. ##
Btc-e

$BTC Trump Pump $100k Target HitTRUMP PUMP IS BACK 🔥
$100k target hit ✅
Another massive rip for CRYPTOCAP:BTC closing within the golden zone 🏆
Need some consistent PA in here or a rip and close above the .786 fib.
200DMA (now sitting at $90,861) is still my base case as mentioned in my original analysis several weeks ago.
IF this is the start of the PARABOLA, and you have some dry powder, a retest of ATH ~109k and then correction to .786 ~$101k would be your entry, with a SL just below the .618 ~$93k
Exciting to watch either way it goes!
This is why you always prepare for both scenarios 🤓

BITCOIN - Important Breakout (BoS)Hello Traders !
On Monday 5 May, The BTC reached the support level (92800 - 93500).
The price broke the higher high (Break of Structure).
So, I expect a new bullish move🚀
_______________
TARGET: 104000🎯

BTC NEW UPDATE (4H)This analysis is an update of the analysis you see in the "Related publications" section
Bitcoin has not yet reached our zone, but it has formed a correction of the same degree as the previous ones and has also created a support area. The diametric pattern could potentially shift into a symmetrical one, and Bitcoin may even reach the 100K–105K zone.
We should keep a close eye on the 100K level for now, as it also serves as a psychological resistance.
For risk management, please don't forget stop loss and capital management
Comment if you have any questions
Thank You

Bitcoin Mid Term Game Plan - BTC PLANBitcoin just broke a key resistance level with strength.
I expect a new all-time high soon, likely the summer top.
Summer markets are usually weak for risk assets and strong for gold. Seasonality matters, keep that in mind.
I expect risk markets to sell off until mid-July to early August. I’ll start buying once we break structure again.
The plan:
Wait for BTC to hit $110K
Look for a reversal from that level
Start aggressively shorting alts, beginning with ETH and memecoins
Hold shorts until late July / early August
Close positions and shift back to buying

BTC/USD: Get Ready for another Bullrun ! (READ THE CAPTION)By analyzing the #Bitcoin chart on the weekly timeframe, we can see that the price is currently trading around $95,000. Soon, we should expect Bitcoin to enter the key supply zone between $99,500 and $109,500, where we’ll closely watch for the market's reaction.
Bitcoin continues to show strong demand, and we may witness another bullish spike in the short term. All previous assumptions from the last analysis remain valid.
Please support me with your likes and comments to motivate me to share more analysis with you and share your opinion about the possible trend of this chart with me !
Best Regards , Arman Shaban

KAS – Long Spot Trade Setup (Structural Recovery in Play)KAS is beginning to show early signs of reversal, reclaiming the 20-day SMA after forming a double bottom near the $0.087 zone. This signals a potential shift in momentum and offers a favorable risk-reward opportunity.
🔹 Entry Zone:
$0.087 – $0.094
🎯 Take Profit Targets:
🥇 $0.108 – $0.120
🥈 $0.133 – $0.154
🛑 Stop Loss:
Just below $0.080

"Bitcoin Analysis" (Update)The price has reached the 0.78 Fibonacci level, and as you can see, there is a low probability that this level will be broken. I expect that, from a technical perspective, the price will form a double top here and then decline to the Fibonacci levels. After reaching the support levels, I anticipate a strong push to GETTEX:98K . Additionally, the tensions from the India-Pakistan conflict could drive the price downward.
Stay Awesome , CobraVanguard

This Low Cap Alt will 20-50x (CULT DAO)This crypto cycle has been brutal for alts. There have been massive shakeouts over and over, a relentless onslaught of rug pulls and scams, and the "Pump.fun" casino on Solana that’s drained billions of retail liquidity and transferred it to the few.
The few always seem to win, and the many always seem to lose. Today, if you’re reading this, it might all change.
CULT DAO could easily 20-50x from now until October 2025. Let’s take a look at the MACD divergence.
### Technical Divergence
For 750 days, this bullish divergence has been forming on the histogram MACD. Every new low on price has formed a higher low on the MACD.
Let’s take a look at a case study of what happens when we get this form of divergence.
I traded this exact same pattern in 2022 that resulted in a nearly 425% move. The play function doesn’t work because they rebranded, and that ticker is no longer valid, but you can scroll to the bottom in my comments on that TA and see the move. I’ll post it under this as well.
As you can see, we got that 425% move. Currently, CULT DAO is showing exactly the same histogram divergence.
Here are some examples of zigzag impulses on low-cap alts. You tend not to get 5 waves; instead, you get this zigzag pattern. This is what I predict CULT DAO will do since it’s only a 5 million market cap.
We can also see in the chart that the 0.618 time Fibonacci level hits at the end of October 2025, which is exactly where I think the altcoin market will top. Check out previous TA on that.
This is only scratching the surface of what is to come for CULT DAO. I have presented to you the technical reason why a big move is stirring and why, at the apex of these divergences, the stars align, and you have the catalyst present itself, and boom—the explosive move comes all at once, and it will be extremely volatile because of its low market cap.
### Let’s Start with the Tokenomics
Every time someone sells or buys CULT DAO on Uniswap, there is a 0.40% tax that goes to a treasury. The top 50 stakers get to pass proposals that fund projects/investments. The idea is to remove the centralized component of funding a project.
121 projects have been funded over the last three years with 3 million dollars.
- Total CULT Funded: 479,751,081,214 CULT
- Total ETH Funded: 1,573 ETH
- Proposals Funded: 121
- Total USD Funded: $3,289,596
- Total ETH Burned: 303 ETH
Allocating these funds has been a learning process over the last three years, but every failure has been necessary in preparing the DAO for what’s to come next.
### The Big Catalyst
The creator of CULT DAO has been working on a blockchain that will function on a custom gas token—that’s right, and that custom token will be CULT DAO. You heard correctly.
Every transaction, every deployment on the blockchain will require the CULT DAO token as gas to execute. The implications are massive. There are multiple dApps that are currently being constructed on the Modulus blockchain.
A privacy-first zkEVM blockchain like Modulus means a scalable, Ethereum-compatible blockchain that prioritizes user privacy through zero-knowledge proofs, allowing optional private transactions while maintaining decentralization.
Modulus is a privacy-first zkEVM blockchain and is scheduled to release this year between April and August 2025. I hope now you’re starting to see the picture.
### CULT DAO and ETH Liquidity Pools
So, why does the price of CULT go down if there is currently very little volume? Well, CULT DAO and ETH liquidity pools are tied together, so if the ETH price goes down, so does CULT. In turn, if ETH goes up, so does CULT.
You can see that CULT is nearly at a 1:1 ratio with ETH for now, coming in at a 0.91 ratio.
In other words, if my thesis is correct about ETH and it goes to 15,000 dollars, the price of CULT would be as follows:
- ETH at $10,000:
CULT Price: $0.000005008 (4x increase).
Market Cap: $21.38M (4x increase).
- ETH at $15,000:
CULT Price: $0.000007512 (6x increase).
Market Cap: $32.08M (6x increase).
That’s right—if nobody even bought CULT, not one dollar, the base liquidity increase of ETH would bring the market cap to possibly 32 million, in other words, if you were thinking of buying ETH, why don’t you just buy CULT DAO?
You can buy ETH now; from this price, 15,000 is 7x, or you can buy CULT DAO, get 6x plus whatever extra volume is coming in. It seems like a logical play, really.
Everything you’ve seen so far is why I believe this MACD histogram divergence has been forming for 750 days. As I said, the stars will align at the apex, and the explosion will come.
### Unruggable and No Whales Controlling Supply
As you can see from the bubble map, the largest wallet that is not an exchange has a cluster total of 0.7%. The rest of the clusters you see in the image are basically exchange wallets, which are the red and dark green circles mostly.
Liquidity is also locked for over 200 years.
- Burned Supply = 1.29664T
- Circulating Supply (including staked) = 4.27T
- Staked Supply = 1.07599T
- Remaining Tradable Supply (excluding burned and staked) = 4.27T - 1.29664T - 1.07599T ≈ 1.89737T
So, no whales, and it’s not possible to rug because liquidity is locked.
### Modulus Blockchain Liquidity Injection
The average liquidity injection for DAOs in ZK would be anything from 200,000 to 10 million. Let’s assume it’s a $1M injection that is split 50/50 between CULT and ETH, a common practice for Uniswap-style pools.
- CULT Amount in Pool: At the current price of $0.000001252, $500,000 buys ~399.36B CULT ($500,000 ÷ $0.000001252).
It would increase the price to a 10 million market cap overnight.
### Conclusion
- Liquidity is locked for 200 years
- No whales
- Not possible to rug
- Mainnet launching this year
- ETH pools tied to CULT
- MACD histogram divergence
The target I have for CULT is just based on Fibonacci levels. Honestly, it’s unpredictable what will happen, how high it will go, or the impact the Modulus chain will have. 120 million is my low-end estimate; the macro Fibonacci is much higher.
The last extension puts it at a 1.4 billion market cap and 266x from where we are now.
This is where you want to be for the upcoming alt season—right here, down 98% with this massive divergence and all these factors that come into play. Just the mainnet launch and ETH going to 10,000 basically sends this to a 30-50 million market cap.
Cult DAO and Satoshi Nakamoto share a common ethos of decentralization and anti-centralization. We need to embrace this notion and bring back the power to the many. If CULT DAO hits 1.4 billion dollars, the treasury funds would be in the millions; we fund our own future.
moduluszk.io
cultdao.io
cultdao.io
coinmarketcap.com

Crypto update for 2025.05.08A quick little technical crypto update for 2025.05.08.
Let us know what you think.
CRYPTO:BTCUSD
CRYPTO:BCHUSD
CRYPTO:ETHUSD
CRYPTO:XRPUSD
CRYPTO:DOGEUSD
CRYPTO:DOTUSD
CRYPTO:TRXUSD
Let us know what you think in the comments below.
Thank you.
77.3% of retail investor accounts lose money when trading CFDs with this provider. You should consider whether you understand how CFDs work and whether you can afford to take the high risk of losing your money. Past performance is not necessarily indicative of future results. The value of investments may fall as well as rise and the investor may not get back the amount initially invested. This content is not intended for nor applicable to residents of the UK. Cryptocurrency CFDs and spread bets are restricted in the UK for all retail clients.

Bitcoin’s Make-or-Break Moment: Eyes on $70KBitcoin price almost reached the $74k support area, which is critical for the bull run continuation.
This zone has acted as a strong resistance in the past, and a clean bounce from here could signal renewed strength and confidence in the market.
However, if this support fails to hold and BTC closes the weekly candle below the $70k level, it would likely mark the end of the current bull phase and signal the beginning of a distribution phase or even the early stages of a new bear market.
That doesn’t necessarily mean Bitcoin will crash straight to $50k — corrections are rarely that linear. But it would drastically reduce the chances of seeing new all-time highs in this cycle.
The next rally, if it happens, would probably be more muted and shorter-lived.
Hopefully BTC will manage to avoid this scenario and hold above the support area.
On the positive side, if BTC holds above $70k and we see strong demand stepping in, it could set the stage for a healthy bounce and continuation of the uptrend.
Still I expect that BTC will test 70k level and if we see strong buying pressure on that level we can expect some recovery.

Bitcoin's Blueprint: Channel Breakout Sets Stage for $104K Push
Looking at the Bitcoin/TetherUS 1D chart from May 6, 2025, we're witnessing a critical technical setup that suggests significant upside potential.
The price is currently at $94,758 , having established a solid foundation after the April recovery. This technical analysis reveals a powerful bullish scenario developing:
Master Pattern: Ascending Channel Continuation
Bitcoin has formed a textbook ascending channel (yellow boundaries) since the February-April bottoming pattern. After testing the lower boundary in April at approximately $74,508, price has rebounded sharply and is now consolidating in a rectangular accumulation zone (purple box).
Key Technical Elements:
- Diagonal Support Break : Price has successfully broken above the descending trendline (gray) that had capped gains since early 2025
- Channel Position : Currently trading in the lower half of the ascending channel, suggesting significant upside room
- Volume Confirmation : The 10.61K volume with positive price action (+0.03%) indicates healthy accumulation
Projected Movement Pattern
The blue arrows map out the anticipated price movement:
1. Current consolidation within the purple box (accumulation phase)
2. Initial thrust to upper channel boundary (~$100K)
3. Minor pullback to establish higher support
4. Final push toward the target of $104k
Strategic Insight: "The Channel Magnet Effect"
Bitcoin's price action demonstrates the magnetic pull of the upper channel boundary after confirmed breaks of diagonal resistance. The purple consolidation zone serves as the launchpad for this measured move.
This pattern is particularly significant as it mirrors Bitcoin's historical tendency to build momentum through rectangular consolidations before channel expansions.
Traders should watch for a convincing break above $98,000 as confirmation of this bullish scenario, with potential for acceleration once psychological resistance at $100,000 is breached.
For risk management, the lower boundary of the purple box provides a clear invalidation point for this bullish thesis.

SELL BTC - $99,400 BTC has arrived as forecasted into its next resistance zone. That should be abundantly clear from 150 colored lines I have on my super straight forward chart. ( sike ) I could go into great detail as to why I lean toward this is another local high, but why? I never do that. Just check out the results. We'll see how it goes. Comments and DM's always welcome Happy Trading. GO Murry, GO Gann, GO Elliot GO Kumar.


U scared, I'm eyeing $100k by May.What beautiful price action.
We are going higher.
disagree if you want.
But you should probably hedge that viewpoint, with a bullish bet.
BALLA JI!
WE WILL WIN.

Bitcoin to $134,000As bitcoin still bullish and staying above 20MA on weekly, Im expecting more upside movement for that, to reach the important resistance line we have at $134,000

BTC NEXT MOVE?🚀 Bitcoin (BTC) Market Update
We are expecting a small dip in Bitcoin's price, potentially down to the 89,000–90,000 USD zone. From that level, we anticipate a strong rally toward 101,000 USD, as highlighted in the chart.
📈 This move could also lead Bitcoin toward making a new all-time high!
Stay patient and follow the setup carefully.

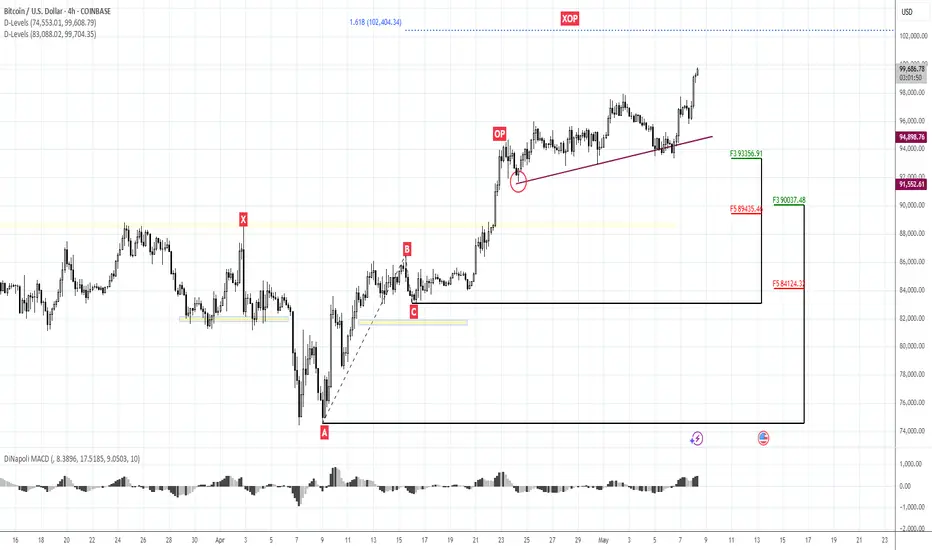
102.5K nearest upside target. 110K is the next oneMorning folks,
So, the pullback to 88-89K area that we discussed last time has not happened. Market turns to direct upside continuation. Now it has no big barriers ahead, which means that 110K is the major target for now.
On Intraday charts we have another one - 102.5K which is the nearest one. We consider no shorts by far. For long entry you could use any deep that you would like to. We suggest that 97.50-98K area is quite suitable for this. Deeper retracement will look suspicious.
BTCUSD Analysis (1W)Current Price: $103,252.95
Trend: Strong (28.05%)
Volatility: High (115,000)
Volume: 106.35K (weekly)
Supports: $100,000, $90,000
Resistances: $110,000, $120,000
Ichimoku: Bullish cloud, price above
Smart Trend: Buy signal (9.21)
📅 Since 2023, Bitcoin has maintained a clear uptrend. At this price, there could be a push towards $110,000 in the short term.
⚠️ Disclaimer: This is not financial advice. Trade at your own risk.
#BTC #Crypto #Trading
SmartTrend Indicator @tradingbauhaus

OTHERS - BTCOTHERS / BTC 🌊
2017 ALTSEASON 1
2021 ALTSEASON 2
2025 ALTSEASON 3
altcoins run will be there sooner or later

MOCHI 1000XETH is ready for next upside move, but you can earn only ~15x.
With $MOCHI you can make 1000x with same chart.
1.6 FIB worked well with bitcoin in previous cycle. same may work with ETH

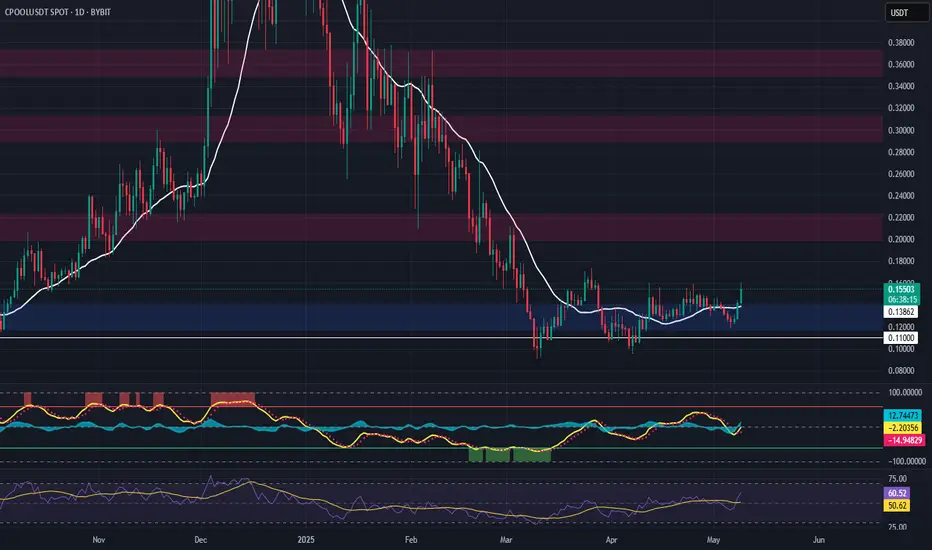
CPOOL (Clearpool) – Momentum Reversal Trade SetupCPOOL is flashing signs of a potential early trend reversal, supported by a strong bounce off a key support zone around $0.140. Price action suggests a reclaim of market structure, positioning this trade for a momentum shift with healthy upside targets.
🔹 Entry Zone:
Around $0.140 (support level)
🎯 Take Profit Targets:
🥇 $0.20 – $0.22
🥈 $0.29 – $0.31
🥉 $0.35 – $0.37
🛑 Stop Loss:
Daily close under $0.11
INJ - Long Trade Setup (Medium-Term Reversal Opportunity)INJ (Injective) has completed a deep liquidity sweep and is now reclaiming key technical levels, including the 21-day EMA and a critical horizontal support zone around $11. This sets the stage for a potential medium-term move higher if the structure confirms.
🔹 Entry Zone:
Around $11
🎯 Take Profit Targets:
🥇 $13 – $14
🥈 $17 – $18
🛑 Stop Loss:
Daily close below $8.50
