Litecoin LTCUSD Completing Final Leg Down Before LaunchAs you can see Litecoin is forming a very similar pattern. I think the rest of March will be corrective. Litecoin will likely come down and bounce off the trend line which coincidental also is a major support level. April will be slightly bullish, May and June will be majorly bullish which I believe Bitcoin will also fly up to 140k as well in this time. I believe Litecoin will outperform the majority of the market. Major hyperinflation will begin this summer which will be very positive for crypto. Many cryptos will die in this hyperinflation period. Only some will survive. Dollar is going to crash. Get ready for a wild ride into 2026. People calling for a bear market are ill informed and will kick themselves for selling. This is the beginning of the biggest run in some cryptos, we've ever seen. Buckle up. Good luck. Not financial advice.
Btc-e

Check support near the M-Signal indicator on the 1D chart
Hello, traders.
If you "Follow", you can always get new information quickly.
Please click "Boost" as well.
Have a nice day today.
-------------------------------------
(BTCUSDT 1M chart)
-
(1W chart)
Indicators indicating lows on the 1M chart and 1W chart, i.e. BW(0), DOM(-60) indicators, are not created.
Therefore, caution is required when trading as it can fall at any time.
This movement is likely to occur until the trend line corresponding to the trend line (1) on the 1M chart is created as a solid line.
-
(1D chart)
There are several trend lines drawn, but the important thing to consider is whether there is support near the section marked with a circle.
Among them, the section that must be broken to create a trend is 89294.25 and 73499.86.
Therefore, the key is whether the price can be maintained near the M-Signal indicator on the 1D chart and rise above 89294.25.
Therefore, the next volatility period is from around April 14th to 17th, and we need to check whether the price can be maintained above the M-Signal indicator on the 1W chart.
If it fails to rise, there is a possibility of falling again to around 78595.86 and 73499.86.
The important thing to consider is whether there is support near the M-Signal indicator on the 1D chart.
-
(30m chart)
The following applies to all time frame charts.
Trading strategies can be created based on whether there is support near the HA-Low and HA-High indicators.
Here, we refer to the movements of the Trend Cloud and StochRSI indicators.
Currently, the HA-High indicator has risen above it and the Trend Cloud indicator is thick, so it can be interpreted that the upward trend is likely to continue.
However, since the StochRSI indicator has fallen in the overbought zone, the upward trend may be limited.
Therefore, it can be interpreted that the support near the M-Signal indicator on the 1D chart is important.
If it continues to rise further, it is expected to touch the M-Signal indicator on the 1W chart.
If it rises or moves sideways, the Trend Cloud indicator will eventually become thinner.
If the Trend Cloud indicator shows resistance while being thin, the possibility of a decline increases, so at that time, you should refer to the various indicators that are generated and respond according to whether there is support near those indicators.
-
If you predict the movement in advance and proceed with the transaction, you may be subject to psychological pressure and may proceed with the wrong transaction, so you should always be careful.
In the HA-Low ~ HA-High indicator section, a trading strategy in the sideways or box section is required.
If it falls below the HA-Low indicator or rises above the HA-High indicator, a trading strategy in the trend is required.
The current example chart is a 30m chart, so this chart requires a trading strategy in the trend.
Therefore, if it shows support above the HA-High indicator, you can create a trading strategy and proceed with the transaction.
Since it is currently located near the M-Signal indicator of the 1D chart, whether there is support near this area is the first trading strategy period.
-
For reference, HA-Low, HA-High indicators are indicators created to create trading strategies, and M-Signal indicators on 1M, 1W, and 1D charts are indicators created to identify trends.
-
Thank you for reading to the end.
I hope you have a successful trade.
--------------------------------------------------
- Here is an explanation of the big picture.
I used TradingView's INDEX chart to check the entire range of BTC.
I rewrote the previous chart to update it while touching the Fibonacci ratio range of 1.902 (101875.70) ~ 2 (106275.10).
(Previous BTCUSD 12M chart)
Looking at the big picture, it seems to have been maintaining an upward trend following a pattern since 2015.
That is, it is a pattern that maintains a 3-year uptrend and faces a 1-year downtrend.
Accordingly, the uptrend is expected to continue until 2025.
-
(Current BTCUSD 12M chart)
Based on the currently written Fibonacci ratio, it is displayed up to 3.618 (178910.15).
It is expected that it will not fall again below the Fibonacci ratio of 0.618 (44234.54).
(BTCUSDT 12M chart)
Based on the BTCUSDT chart, I think it is around 42283.58.
-
I will explain it again with the BTCUSD chart.
The Fibonacci ratio ranges marked in the green boxes, 1.902 (101875.70) ~ 2 (106275.10) and 3 (151166.97) ~ 3.14 (157451.83), are expected to be important support and resistance ranges.
In other words, it seems likely that they will act as volume profile ranges.
Therefore, in order to break through these ranges upward, I think the point to watch is whether they can receive support and rise near the Fibonacci ratios of 1.618 (89126.41) and 2.618 (134018.28).
Therefore, the maximum rising range in 2025 is expected to be the 3 (151166.97) ~ 3.14 (157451.83) range.
In order to do that, we need to see if it is supported and rises near 2.618 (134018.28).
If it falls after the bull market in 2025, we don't know how far it will fall, but based on the previous decline, we expect it to fall by about -60% to -70%.
Therefore, if it starts to fall near the Fibonacci ratio 3.14 (157451.83), it seems likely that it will fall to around Fibonacci 0.618 (44234.54).
I will explain more details when the bear market starts.
------------------------------------------------------

BTC - Key support retest and potential short squeeze in play!Over the last several trading sessions, Bitcoin (BTC) has experienced a notable pullback, retracing nearly 10% from its recent highs. This correction brought the price down below the previously established support level at $76.7K, a critical area that had previously acted as a base during prior consolidations. At first glance, this breakdown appeared to signal a potential shift in market structure, potentially opening the door to deeper downside movement. However, price action suggests there may be more nuance to this move.
Despite the intraday dip below $76.7K, Bitcoin managed to recover into the close, with the daily candle finishing with its body above the prior wick at that level. This forms what’s known as a Swing Failure Pattern (SFP), a bullish reversal signal that occurs when price breaks below a key low (or above a key high) only to reclaim it by the candle close. This type of setup often traps breakout traders on the wrong side of the move and can lead to a sharp reversal as positions unwind.
Today’s price action adds further interest to this setup. Bitcoin dipped again to retest the $76.7K level, which not only lines up with the previous wick low but also coincides with the golden pocket of the Fibonacci retracement zone, typically measured from the recent local low to the high of the previous move. This 0.618–0.65 Fibonacci range is often viewed as a high-probability area for reversals or continuation moves, particularly in trending markets.
The confluence between the golden pocket and the psychological $76.7K level strengthens the idea that this zone could serve as a reliable support in the short term. If BTC can continue to hold above this area, we may be witnessing the formation of a local bottom, which could lead to a relief rally or short squeeze in the coming days.
SFP :
Leave a like and comment :)
Follow for more content.

$BTC consequences of the Trump 90 days tariff pauseCan It Last? Is This a Trend Reversal?
Today, #Bitcoin surged over +8%, but surprisingly, #Tesla outperformed with a massive +20%—almost as much as $FARTCOIN! 🤯
History is being written, and we’ll remember this day… but is this truly the end of the consolidation phase?
What to Watch:
📈 Price Action: Bitcoin must break above the descending trendline (in green) and close a daily candle above it to flip resistance into support. The price to watch is $84.5k. Closing under 80k would invalidate this pump.
📊 RSI: Currently in mid-range—could swing either way.
🔁 MACD: Was turning bearish. We need a clear bullish crossover to confirm a trend continuation.
Conclusion:
With all the recent global tensions, many investors are feeling a sense of relief, especially as the trade war appears paused until September. This gives markets some breathing room to recover.
However, it’s not all clear skies yet:
Bitcoin is still stuck inside the descending bearish channel.
The recession risk hasn't gone away.
Trump may have been pressured to offer good news to avoid a full-blown market crash.
🕵️♂️ Let’s see how the weekly candle closes after this sharp move to the upside.

BTCUSD: Attacking the 2025 Resistance looking for huge breakout!Bitcoin turned neutral on both its 1D (RSI = 47.243, MACD = -1813.400, ADX = 31.557) and 1W (RSI = 45.530) technical outlooks following the 90-day tariff pause. Technically it is going after the LH top of the Falling Wedge from its ATH and the 1D MA50, which has been the main Resistance since February 4th 2025. There is a key Bullish Divergence on the 1D RSI too, being on HL as opposed to the LL of the Falling Wedge. A breakout above the Wedge typically sets a technical target on the 2.0 Fibonacci extension, which falls just under the ATH Resistance Zone. Be ready to go long if the breakout takes place (TP = 106,000).
## If you like our free content follow our profile to get more daily ideas. ##
## Comments and likes are greatly appreciated. ##

HOW IS CRYPTO SHAPING UP?Trump and tariffs have a firm grip on the economic world as of late, so where does that leave the crypto market?
TOTAL has a clear structure since the beginning of the bull market in 2023, in the last 3 days TOTAL has wicked into the bullish trendline support but sits within a bearish trend channel. This level also coincides with the bullish orderblock that started the leg up post US election so a very strong level of support here.
Do I think this is the end and the bottom is in? The chart would make a very good case for it however I believe that the Geo-politics outweigh Technical Analysis currently, at least in the short term. Everyone is watching for the latest news release/Trump announcement and all the time that is going on the market is very reactionary with less passive orders and more reactionary news based market orders. That taken into account in the short term this is a game of musical chairs with massive volatility swings and liquidations left right and center, a traders dream.
I'm very interested in how the FED will react to this, once we start getting emergency or early interest rate cuts that for me is when BTC will take the next step up and will flip to an investor/buy and hold environment, whether that's from here, lower or higher I'm not sure but but BTC needs a risk-on environment to thrive and Trump is doing his best to force J Powells hand.

Will BTC emerge from the resistance zone on top?BTC bounced off an important support zone at $74,154 - $77,050 and we are currently seeing a very strong upward movement at the 10% level. It is also clear that the price drop created a higher low and the upward impulse gave a higher high, which is positive in the short term for continued growth.
However, you need to be careful here because the BTC price has entered a strong resistance zone from $81,900 to $83,900, only breaking out of this zone on top will open the way towards $89,000.
It is worth paying attention to the RSI indicator, which confirms the dynamic movement, but considering the 4H interval, there is still room for the price to overcome the zone on top.

Bitcoin Eyes $81,500 Resistance Following Trump's Tariff Pause. 🚨 **Market Update** 🚨
President Donald Trump has announced a 90-day pause on the full effect of new tariffs for certain countries, and the markets are reacting strongly! 📈 Both the stock and crypto markets are surging as a result.
Right now, **Bitcoin** is testing the $81,500 resistance level on the 1-hour timeframe. 💥 Our trading strategy: let it break the resistance and sustain above it, then look for a solid entry on the pullback.
Stay tuned and trade wisely! 🚀💰

BTC UPDATE: Flash Crash? Or Bullish Retest?🚀 Hey Traders! 👋
If you’re enjoying this analysis, smash that 👍 and hit Follow for high-accuracy trade setups that actually deliver! 💹🔥
📉 BTC just dropped nearly $10K in a single day, sliding from $84K to $74K amidst growing tariff tensions and broader market turmoil.
But here’s the bullish twist—this dump might just be a healthy retest.
BTC recently broke out of a strong inverse head & shoulders pattern, and what we’re seeing now looks like a classic neckline retest.
📌 Key Support: $72K
As long as BTC holds above this level, there’s no reason to panic. Once the dust settles from this bloody Monday, momentum could shift back to the upside.
🟢 This could be a golden accumulation zone—low risk, high potential reward.
❌ Invalidation Level: Weekly close below $72K
💬 What’s Your Take?
Will BTC bounce from this level, or is there more downside ahead? Drop your analysis and predictions below—let’s navigate this together and secure those gains! 💰🔥🚀

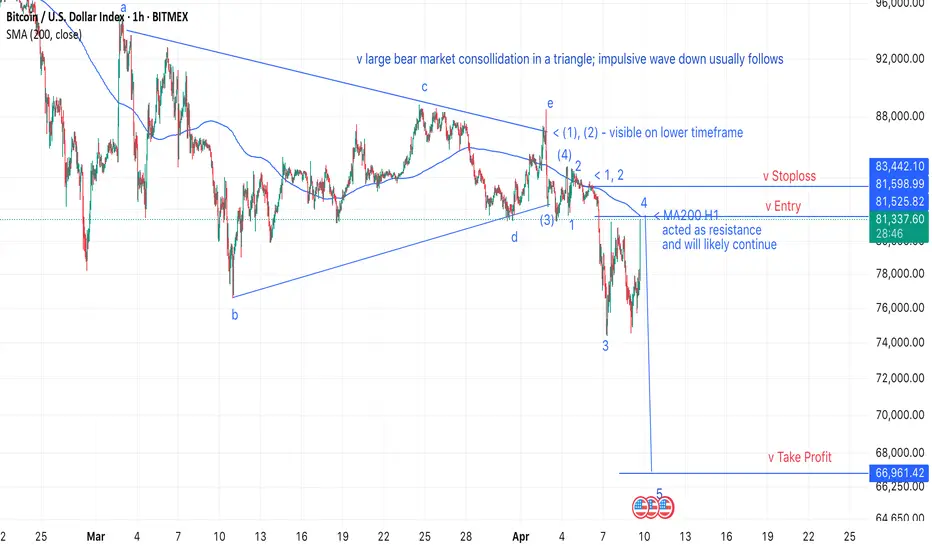
[BTC short] Entry: 81.5k, SL: 83.5k, TP: 67kThe backdrop is my prediction of a 2008-style crash, with Bitcoin (BTC) dropping to $26k (see related ideas).
During the crash, I’ll aim to capitalize on short-term moves, targeting clear patterns with high reward-to-risk ratios.
Following a prolonged consolidation—resembling a triangle—an impulsive wave down has begun to form. I now expect the 200-hour moving average (MA200 H1) to act as resistance, pushing the price to a new low and trade accordingly.
BTC | BEARISH Cycle Begins | $71KThere are a few tell signs that BTC has entered the bearish market.
If the price fails to maintain closing daily candles ABOVE the 70k area, there is a likelihood for a nasty Head and Shoulders pattern to form.
A key point to watch are the Bollinger Bands, which gives you an indication of the next possible zone to watch.
_____________________
BINANCE:BTCUSDT

LINK Long Spot Trade Setup – Major Support TestLINK has retraced sharply and is now sitting at a critical support zone ($10.00–$11.00), historically a strong base for reversals. This offers a solid risk/reward opportunity for a potential bounce and test of upper resistance zones.
📌 Trade Setup:
Entry Zone: $10.00 – $11.00
Take Profit Targets:
🥇 $17.00 – $17.70
🥈 $21.70 – $22.40
Stop Loss: Around $8.80


Long idea on $PEPEAfter completing its full growth, this altcoin has formed a larger-scale correction, and now I believe there will only be a technical rebound within the broader correction.

Thanks to STUPID TRUMP the downward trend continuesDo you agree with me that Trump is a narcissistic and crazy man who has decided to destroy the world economy, or is he discrediting powerful people and just lying

HelenP. I Bitcoin may rebound from resistance zone and fall moreHi folks today I'm prepared for you Bitcoin analytics. After a strong rejection from the second resistance zone between 86700 and 87900 points, Bitcoin lost its bullish momentum. The price attempted to hold within the range but failed to break above the trend line, which has consistently acted as dynamic resistance. This trend line marked the turning point once again, pushing BTC down with increased selling pressure. The price then sharply declined, breaking below the first resistance zone between 78200 and 79500, which is now acting as resistance. This level was previously tested multiple times, making it a key barrier. After breaching this zone, the price dropped even lower and reached the 77000 area, where it found temporary support and began a minor bounce. Currently, Bitcoin is trading just below the resistance zone and remains under the trend line. Sellers are still in control, and the recent bounce looks weak compared to the prior impulse down. Given the rejection from resistance, the position relative to the trend line, and continued bearish pressure, I expect BTC to resume its decline toward 70000 points, which is also my goal. If you like my analytics you may support me with your like/comment ❤️

BITCOIN Can a USD sell-off save the Cycle?Bitcoin (BTCUSD) is hanging on its 1W MA50 (blue trend-line) amidst the market chaos and especially following last night's stronger 104% trade tariffs to China from the U.S.
This is a simple yet powerful classic chart, displaying Bitcoin against the U.S. Dollar Index (DXY, black trend-line). This shows the long-term negatively correlated pattern they follow on their Cycles.
Every time DXY entered an aggressive sell-off in the final year of the 4-year Cycle, Bitcoin started its final parabolic rally of its Bull Cycle. This time the DXY peaked exactly at the start of the year (2025) and is on a selling sequence up until today but due to the ongoing Trade War, BTC not only didn't rise but is on a correction too.
Can an even stronger DXY sell-off save the day and complete the 4-year Cycle with a final rally? Feel free to let us know in the comments section below!
-------------------------------------------------------------------------------
** Please LIKE 👍, FOLLOW ✅, SHARE 🙌 and COMMENT ✍ if you enjoy this idea! Also share your ideas and charts in the comments section below! This is best way to keep it relevant, support us, keep the content here free and allow the idea to reach as many people as possible. **
-------------------------------------------------------------------------------
💸💸💸💸💸💸
👇 👇 👇 👇 👇 👇

WHY XAUUSD IS BULLISH ?? DETAILED TECHNICAL AND FUNDAMENTALSXAUUSD is currently showing strong signs of bullish continuation after completing a successful retest of the previous breakout zone near the $2,920–$2,950 region. Price action has respected this support beautifully and is now pushing back above $3,040, confirming the bullish structure. This retest and bounce pattern suggests that the market is preparing for a fresh leg higher, with my immediate target set at $3,100. The current structure is aligned with higher highs and higher lows, and momentum is shifting back in favor of buyers.
Technically, the move is clean. The bullish impulse from February to late March created a strong upside leg, followed by a healthy correction into a well-defined demand zone. This demand zone held firm, and the current reaction is supported by increasing volume and bullish candlestick formation on the 12H chart. The inverse head-and-shoulders structure around $2,930 gives this setup even more weight, with a clear breakout above the neckline indicating potential continuation toward higher time frame targets.
From a fundamental perspective, gold remains supported by ongoing geopolitical tensions, increased demand from central banks, and continued inflationary pressure globally. As the market anticipates this week's U.S. CPI data, investors are hedging against uncertainty, which is driving flows into safe-haven assets like gold. The recent pullback in the US dollar index and bond yields is also contributing to upside pressure on XAUUSD, further confirming the bullish outlook.
With both the technical setup and macro drivers favoring upside, I'm looking for continuation toward $3,100 and potentially beyond in the short to mid-term. This area also aligns with the next psychological resistance and projected extension level. As long as price holds above $3,000, any dips should be viewed as fresh buying opportunities. This setup offers an excellent risk-reward ratio for traders looking to capitalize on gold’s ongoing bullish momentum.

ADAUSDT → Correction to the liquidity zone before the fall ↓BINANCE:ADAUSDT is in a bear market, under pressure. An exit from consolidation and a pullback with the aim of retesting the resistance (liquidity zone) before further decline is formed
The fundamental background for cryptocurrencies is extremely negative. Bitcoin on yesterday's manipulation related to the 90-day tariff break, which was later denied by the White House began to form “helicopters” and high volatility. As the market calms down, the price returns to the selling zone, which creates pressure for Cardano as well.
Technically, a false breakdown of 0.5 fibo is formed and the price is consolidating near the local support at 0.5800. The breakdown and consolidation of the price below 0.58 will provoke the continuation of the fall. A retest of the previously broken consolidation support at 0.6300 is possible.
Resistance levels: 0.63, 0.6661
Support levels: 0.581, 0.5092, 0.4564
The market structure is exclusively bearish. A False breakout of resistance or breakdown of 0.581 will provoke a further fall, but the level of 0.5092, if broken, will finally drive the coin into the zone of emptiness, which may lead the price to fall to 0.45- 0.42.
Regards R. Linda!

USDCAD IS DRROPPING. DETAILED TECHNICAL AND FUNDAMENTALSUSDCAD is currently trading around 1.4200 after a clean retest of a previously broken support zone, which has now turned into a strong resistance level. Price action is confirming the bearish structure as we see a gradual yet consistent drop from the highs of 1.4540. With the rejection seen from the supply zone and recent lower high formation, momentum is shifting further in favor of the sellers. I am now targeting 1.3800 for the next key level, aligning with both technical confluence and fundamental sentiment.
Technically, the structure is clear: we had a failed breakout above 1.4450, followed by a decisive bearish engulfing move. The market then completed a textbook retest at the 1.4340–1.4450 supply zone before resuming the downside move. The current formation on the 12H chart shows a lower low and lower high sequence intact, signaling a trend continuation to the downside. The highlighted zones also provide ideal reward-to-risk setups for continuation traders.
From a fundamental perspective, the Canadian dollar is gaining strength due to rising oil prices, with WTI crude now climbing back above the $85 mark. This directly supports the loonie given Canada’s oil-export-driven economy. Meanwhile, US economic uncertainty around upcoming CPI data and shifting Fed rate cut expectations continue to weigh on the dollar’s upside momentum. Additionally, recent risk-on sentiment in global markets is pushing flows into commodity-linked currencies like CAD.
With technicals and fundamentals aligning, I remain firmly bearish on USDCAD. As long as price remains below the 1.4340 resistance, I’m looking for continuation toward the major demand zone near 1.3830–1.3800. This setup offers a clean 1:3+ risk-to-reward profile, and I will be scaling in further on bearish confirmations as the market progresses.

XAUUSD/GOLD Possible Move 09.04.2025📊 Market Context
After a sharp selloff from the $3,160 region to sub-$2,980 levels, the market is now in recovery/consolidation mode.
Market currently hovers around $3,010 after bouncing from below $2,980, indicating buyer interest.
📏 Fibonacci + Support Confluence Zones
Price may pull back and give a buy-the-dip opportunity.
✅ Buy Zone 1 – $2,993–2,997
Reason: Retest of strong horizontal support, Fibonacci .5% area.
Signal to Enter Long: Bullish engulfing / hammer on M5/M15 + RSI divergence.
Target: $3,010 (first), $3,020+ (extended).
🔁 Retest Logic
Wait for price to retest any of these zones on low volume → watch for bullish candle close.
⚠️ Important Notes
Avoid entering mid-range trades at $3,010–$3,015 without pullback confirmation.
Aggressive buys can be scalped on momentum breakouts of $3,020 only if volume supports.
Always monitor for news or sudden volume spikes which can invalidate pullback zones.
Follow, comment, like and join for more like analysis.

WHY EURUSD IS BULLISH ?? DETAILED ANALYSISEURUSD has officially broken out of a clean bullish pennant pattern on the 4H chart, confirming the bullish momentum that has been building over the past week. After a sharp rally, price consolidated within a contracting range, forming the classic pennant shape. With the breakout now confirmed and price currently trading at 1.106, I’m anticipating a continuation toward the projected target at 1.143 — offering a potential 300+ pip gain in this move.
Technically, the breakout is supported by increasing bullish volume, strong impulse candles, and a clear structure of higher lows. The pennant served as a healthy consolidation zone, allowing buyers to regain control before the next leg up. Price has respected support at 1.096 and is now printing bullish continuation signals with momentum indicators pointing north.
Fundamentally, today’s market sentiment favors EUR strength, especially as the US dollar comes under pressure due to rising expectations of Federal Reserve rate cuts later in the year. Inflation data in the eurozone remains sticky, supporting the ECB’s cautious stance on monetary easing. Meanwhile, weaker US labor market data and softening retail figures are weighing on dollar demand.
With both technicals and fundamentals aligned, I’m expecting further upside on EURUSD. The structure is solid, the breakout is clean, and sentiment supports continued bullish flow. I’ll be holding my bias firmly bullish unless the price falls back below 1.096, which would invalidate the setup. For now, all eyes are on 1.120 short term and eventually 1.143 as the full pennant projection completes.

Bitcoin At $250,000 In 2025: Bull-Market Entry (Buy) Zone ActiveBitcoin's 2025 bull-market buy-zone is still active. Actually, Bitcoin is at a great price right now. We are aiming for a target of $250,000 for this cycle. We are looking at the bottom right now, literally. Any buy below $90,000 is extremely good and below $80,000 a dream come-true. This will be obvious in just a matter of weeks.
How are you feeling today?
I hope the start of the weekend is treating you good.
This is a friendly reminder, Bitcoin has been sideways for months. When Bitcoin drops, it drops but, currently, there are no new lows.
Bitcoin peaked in December 2024 and produced a double-top in January 2025. A small retrace and that's it; the accumulation phase is ongoing and the buy-zone active.
There are many signals that support a correction bottom being in. We looked at these already so you will have to trust me. Leverage is possible on this setup. Leverage for a long-term trade. This is the best possible scenario and the best type of trade.
No complexities. No calculators. No fees. No interest, just buy and hold.
Wait patiently... It will be a very strong rise and the Altcoins will grow even more than Bitcoin. The entire Cryptocurrency market will produce maximum growth.
This post is intended to alert of you a great entry-timing. Great prices as well but timing right now is great. We might have to wait a bit longer, it won't move right away, but with this price you can't go wrong.
I am wishing you tons of profits in 2025 and financial success.
Thank you for reading.
If you are new, feel free to follow.
Master Ananda for you (formerly Alan Santana).
Namaste.
