Bitcoin Just Blasted Through $100K – Why $108K & $115K Are Next!
Summary
Bitcoin has staged a clear turnaround after holding support near $76K in April and reclaiming critical dynamic resistances at $89.3K and $96.7K. On May 8, BTC printed a powerful rally candle that peaked at $102.7K, signaling a potential shift from range-bound chop back into an up-trend. This piece unpacks the price structure, macro drivers, and key levels, and lays out the scenarios for the next leg higher or a corrective pullback.
Macro & Sentiment Backdrop
Macro liquidity ebb & flow: Recent dovish commentary from the Fed reduced forward rate-hike risk, restoring confidence in risk assets.
Regulatory clarity: transparent guidelines in major markets continue to draw fresh institutional capital.
Network health: On-chain metrics such as rising active addresses and declining exchange inflows reinforce supply scarcity narratives.
Chart Structure & Technical Evolution
Declining volatility and volume contraction characterized the consolidation phase.
Dynamic Resistance Breaks
R1 (~$89.3K) & R2 (~$96.7K) (grey/green labels) had capped rallies in mid-April and late-April.
The decisive May 8 candle surged through both, converting them into short-term support pivots.
Current Momentum
A long green daily bar with above-average volume implies genuine buying demand (not a thin-market spike).
Price now trades above $100K, a major psychological and technical threshold.
Key Levels & Zones
Level Type Significance
$108K Static Supply Prior swing high; first major profit‐taking zone
$102.7K Recent Peak Near‐term resistance; tag of psychological $100K
$96.7K Dynamic R2 → Support Ideal retest area for dip buyers
$89.3K Dynamic R1 → Support Secondary support if $96.7K fails
$76K–$78K April Range Support Invalidation zone for bullish thesis
Bullish vs. Bearish Scenarios
Bullish Path
Retest & Hold: A pullback into $96.7K–$100K on lighter volume that finds support would validate the breakout.
Accelerate Toward $108K: A sustained move above $102.7K with daily closes above $104K clears the way to challenge the $108K supply zone and beyond.
Bearish Risk
Rejection at $102.7K: Failure to close convincingly above peak time resistance could trigger profit-taking and a swift drop to $96.7K.
Breakdown Below $89.3K: A daily close back under the first support zone would re-trap bullish participants, risking a deeper pullback into the April range near $76K–$78K.
Is $108K or $115K Next? No one knows
Follow the momentum and Trend
Btc-e

If Ethereum behaves like $BTCIf Ethereum behaves like CRYPTOCAP:BTC , which after breaking through the downward channel continued to grow without a rollback, then soon we will see our Favorite Ether at $2500.
The altcoin season will come after the growth of Ether, but there will not be enough Liquidity for everyone!
Projects that are alive, working, and earning will grow.
Projects should have realized - It's time to take responsibility and independently ensure the Liquidity of their Tokens at the expense of income from the Business Model, and not live at the expense of VCs with a printing press.
#RateXAI #RAA token

BTCUSDBTCUSDT entry for long in 5 min timeframe setup
TP and SL are mention
Follow the Risk Management

btc . tue . recapApproaching the cmLow during 2/4pm (utc+2) on tuesday, brought the tiny SFP liquidity and and a NO LOOK BACK push upwards. The SHORT wasn't taken as the the bounce showed no weakness
The intraday LONG turned out to be a runner.
entry . 93454
tp1 . 94854 . +1.5%
- this seems a 'too early tp', correct but: thought as an intraday . securing the daily minimum: PROFIT TAKEN
tp2 . 100477 . +7.5%
tp3 . 103626 . +10.8%
The long entry is now at average 94863 . ish prv tp1
- I was waiting for lower, to add LONG position size
But upon not seeing follow through and strong bounces on lower TFs, I went with a 30% of original trade size addition during wednesday 8/10pm.
Now it's 10:30am, we've just pushed another 1h leg higher. I'll ride this to my next TPs, bigger reactions at this point I see only at higher prices.
This thing is BULLISH
(always hungry for good SHORT trades, but paytient for reactions)

BTC/USD 1D chart ReviewHello everyone, let's look at the 1D BTC chart for USD, in this situation we can see how the price came out of a strong downward trend, which gave a strong upward movement for the price. Going further, let's check the places of potential target for the price:
T1 = 96592 $
T2 = 101878 $
Т3 = 109442 $
Let's go to Stop-Loss now in case of further declines on the market:
SL1 = 92363 $
SL2 = 89028 $
SL3 = 83498 $
SL4 = 79350 $
Looking at the RSI indicator, we can see that despite a small price change, the indicator strongly reacted what potentially can give energy to further price increases in the coming weeks.

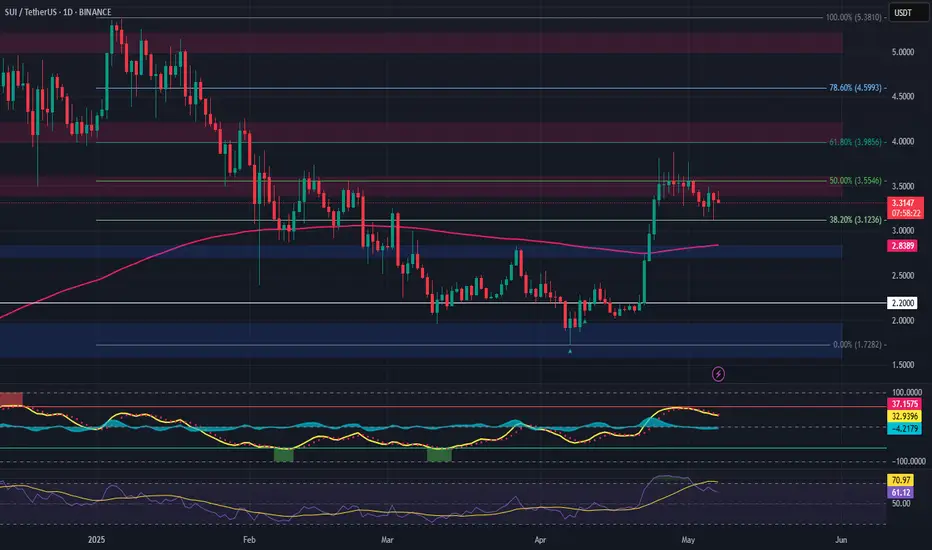
SUI – Long Trade Setup After Trend ReversalSUI has broken out of its downtrend, hitting all prior upside targets and now pulling back toward a key support area and the 200-day EMA, potentially forming a higher low—an ideal spot for re-entry.
🔹 Entry Zone:
Around $2.80
🎯 Take Profit Targets:
🥇 $3.40 – $3.60
🥈 $4.00 – $4.20
🥉 $5.00 – $5.20
🛑 Stop Loss:
Daily close below $2.20
📌 Strategy Notes:
Look for bullish confirmation (e.g., wick rejections, bullish engulfing candle) near $2.80
Structure remains intact as long as price holds above $2.20
EMA retests often precede strong continuation if trend strength remains
ADA (Cardano) – Long Spot Trade Setup at SupportCardano has pulled back to a key support zone around $0.66, providing a potential entry opportunity for a long spot position as the broader structure attempts to hold.
🔹 Entry Zone:
$0.66
🎯 Take Profit Targets:
🥇 $0.80 – $0.84
🥈 $0.98 – $1.02
🛑 Stop Loss:
Just below $0.59 (to protect against deeper breakdowns)

Bitcoin (BTCUSD) – Bullish Continuation SetupBitcoin is showing strong bullish structure on the daily timeframe, having broken out of a key range and now approaching a potential retest zone.
Price is currently hovering around 96,990, and we’re anticipating a possible retracement into the demand zone between 91,856 – 88,533. This area aligns with a previous consolidation and breakout range, offering a high-probability buy zone if price reacts with bullish intent.
📌 Key Technical Highlights:
Break of structure confirms bullish bias
Demand zone identified between 91.8K – 88.5K
Anticipating a retracement for continuation
Bullish targets toward 100K+
We’ll be watching lower timeframes for confirmation (engulfing candles, bullish BOS, or SFPs) before entering long.

Bitcoin Analysis - 7 MayThe price continues to move within the range of $91,700 - $100,400.
In approximately 3 hours, the FED will announce its interest rate decision.
The expectation is for it to remain unchanged.
If it remains unchanged;
there could be a horizontal consolidation between 94,990 – 97,500.
If a breakout occurs, the upward movement will accelerate; otherwise, there could be a pullback to the 91,781 – 94,990 levels.
If the interest rate is reduced;
the psychological resistance at 100,400 USDT may be tested, and if surpassed, the target of 109,605 (ATH) comes into play.
If the interest rate is increased;
the supports at 94,990 USDT and below could be tested quickly.
The levels of 91,781 and 85,085 USDT become potential targets.
With stronger selling, the support zone at the 2024 ATH level of 73,776 USDT may come into play.

Bitcoin is Overbought, but $100,000 Target is Still at HandFenzoFx—Bitcoin is overbought at $97,000, a signal indicated by the Stochastic Oscillator. The price is expected to consolidate before the uptrend resumes. In this scenario, a dip toward $93,565 may provide a favorable entry point into the bull market.
Watch this level, followed by $91,720, for bullish signals such as candlestick patterns.
>>> Prop Trading
>>> No Deposit Bonus
>>> %100 Deposit Bonus
>>> Forex Analysis Contest
All at FenzoFx Decentralized Forex Broker

EURAUD DETAILED ANALYSIS BULLISH OR BEARISHEURAUD is currently trading around 1.75600, forming a classic falling wedge pattern on the 12-hour timeframe. This structure typically signals a bullish reversal, and with price compressing near the wedge’s apex, the likelihood of a breakout to the upside increases significantly. Momentum is slowing on the downside, while buyers are beginning to show signs of re-entering the market, suggesting the pair is gearing up for a potential bullish surge toward the 1.85600 level.
Fundamentally, the euro is holding firm amid persistent inflation data from the eurozone, increasing speculation that the ECB might remain hawkish longer than expected. On the other hand, the Australian dollar is facing pressure due to softer commodity demand and cautious rhetoric from the RBA. This divergence in central bank outlooks favors euro strength in the near term. Today's minor beat on euro PMI data and lackluster performance in Aussie retail sales reinforces the strength of this directional bias.
Technically, this falling wedge is forming after a strong bullish impulsive leg, which adds further credibility to the reversal setup. Buyers have successfully defended the 1.7500 psychological zone, and a breakout above the wedge resistance could trigger a sharp rally. A move above 1.7600 would likely act as confirmation for bulls, opening the door for a measured move toward the 1.85600 target area.
As long as price holds above the 1.7400 region, this remains a high-probability bullish setup with a strong risk-reward profile. Traders will be closely watching for volume increase and price rejection candles at resistance to confirm the breakout. This is a prime example of a technical and fundamental confluence setup that professional traders look for when positioning for medium-term swing trades.

EURJPY BULLISH OR BEARISH DETAILED ANALYSIS ??EURJPY is currently trading around 162.800 and showing clear bullish momentum after a clean bounce off a strong support zone. Price has been consolidating above a well-established demand area, and today's candle confirms renewed buyer interest. The reaction from this level highlights a potential shift back to the upside, with 169.000 marked as the next significant target. The rejection wicks and structure suggest accumulation, with the market gearing up for a bullish continuation.
From a fundamental perspective, the euro is gaining strength on the back of better-than-expected economic data across the eurozone, while the Japanese yen continues to face broad pressure due to the Bank of Japan's dovish stance. The BOJ remains committed to ultra-loose monetary policy, which puts the yen at a disadvantage against stronger currencies like the euro, especially when inflation expectations in Europe remain sticky.
Technically, EURJPY has respected this support zone multiple times, creating a solid base of demand. Each test has been met with higher lows, reinforcing the bullish bias. The price action is forming a classic support-retest continuation pattern, and if this structure holds, we could see a swift move toward 169.000. Volume and momentum indicators are also beginning to align in favor of the bulls.
Looking forward, as long as price holds above the 162.200 area, the path of least resistance remains upward. Traders will be watching for continuation signals and breakouts of minor resistance zones to confirm the move. This setup offers a favorable risk-reward structure, and with market sentiment tilting toward euro strength, EURJPY has the potential to deliver solid gains in the coming sessions.

BITCOIN Mirror fractal from the past calls for massive rally!Bitcoin (BTCUSD) appears to be repeating almost the exact same price action as mid-late 2020 as it has broken above the Pivot trend-line that separates the recent distribution from the 2nd Accumulation phase and has successfully re-tested it while the MA50 (blue trend-line) is holding as Support.
If the latter continues to hold, then it might fuel a massive rally similar to October 2020 - April 2021. As you can see both fractals started of with a 1st Accumulation Phase (blue Rectangle) being supported always by their respective MA200 (orange trend-line), which led to the eventual Distribution Phase (red Arc). Even their RSI sequences are identical.
Is this another pattern supporting that BTC will reach at least $150k next? Feel free to let us know in the comments section below!
-------------------------------------------------------------------------------
** Please LIKE 👍, FOLLOW ✅, SHARE 🙌 and COMMENT ✍ if you enjoy this idea! Also share your ideas and charts in the comments section below! This is best way to keep it relevant, support us, keep the content here free and allow the idea to reach as many people as possible. **
-------------------------------------------------------------------------------
💸💸💸💸💸💸
👇 👇 👇 👇 👇 👇

Bitcoin Still Stuck in Resistance – Eyes on CME Gaps & USDT.D%Bitcoin ( BINANCE:BTCUSDT ) touched $92,830(first target) and started to rise as I expected in the previous idea . Overall, Bitcoin has been moving in a range for about 12 days .
Note : In general, trading in a range market is more difficult than in a trending market . If your performance in a range market is not good, it is better not to trade until the trend is clear (this is just a suggestion).
Bitcoin is currently trading at a Heavy Resistance zone($95,950-$88,500) and has failed to break through it, and it seems like Bitcoin needs more momentum to break through this zone. Do you think Bitcoin will finally break through the Heavy Resistance zone($95,950-$88,500)?
In terms of Elliott Wave theory , it appears that Bitcoin has completed a five-wave impulsive and we should expect Corrective waves .
The analytical conditions of the Bitcoin chart have been a bit ambiguous in the past few days, so it's better to take a look at the USDT.D% ( CRYPTOCAP:USDT.D ) chart to increase the accuracy of Bitcoin analysis .
USDT.D% failed to break the Support zone(5.13%-4.95%) after several attacks. It currently appears to be forming an Ascending Broadening Wedge Pattern . It appears that USDT.D% needs to complete this pattern to break the support zone, and if this pattern fails , we should expect further increases =Bitcoin crash .
I expect Bitcoin to decline to the Support zone($92,910-$91,414) , 21_SMA(Weekly) and Cumulative Long Liquidation Leverage($93,359-$92,296) and probably fill the CME Gap($92,525-$91,415) this time and then start to rise and prepare to break the Heavy Resistance zone($95,950-$88,500) and fill the CME Gap($97,680-$96,455) .
Cumulative Short Liquidation Leverage: $98,989-$97,924
Note: If Bitcoin breaks below the Support zone($92,910-$91,414), we should expect further declines.
Please respect each other's ideas and express them politely if you agree or disagree.
Bitcoin Analyze (BTCUSDT), 1-hour time frame.
Be sure to follow the updated ideas.
Do not forget to put a Stop loss for your positions (For every position you want to open).
Please follow your strategy and updates; this is just my Idea, and I will gladly see your ideas in this post.
Please do not forget the ✅' like '✅ button 🙏😊 & Share it with your friends; thanks, and Trade safe.

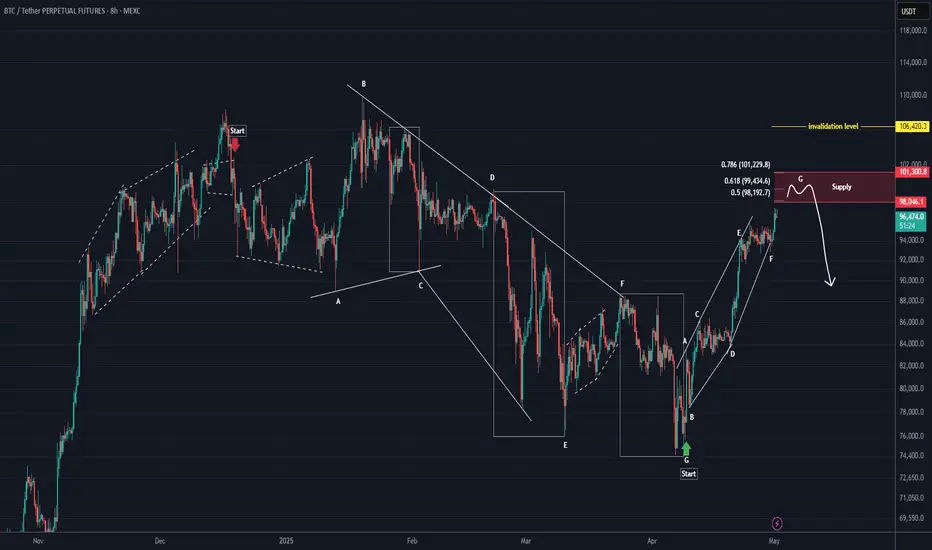
BTC New Update (8H)This analysis is an update of the analysis you see in the "Related publications" section
In the previous scenario, we considered that Bitcoin was in a diametric where wave E had extended. However, after reviewing the charts and analyzing various scenarios, we decided to revise the wave count as shown in this update, since wave E of the previous diametric scenario became overly extended.
You can see the complete wave count of the chart in this update. The correction in Bitcoin started from the point where we placed the red arrow on the chart. This correction was a diametric and ended where the green arrow is placed.
From the point where the green arrow is shown on the chart, Bitcoin's bullish wave has started, which is either wave A or W.
According to this scenario, the expected rejection zone should be between 98K and 103K.
The lowest-risk area for price rejection is the red box.
A daily candle close above the invalidation level will invalidate this analysis.
Let’s see what happens.
For risk management, please don't forget stop loss and capital management
Comment if you have any questions
Thank You
BTC - Will history repeat itself?In this description, I will compare the current price action of BTC with the market behavior seen in 2021. Both cycles share notable similarities in their structure.
-------------------------------
2021 bullmarket
During the 2021 bull market, BTC displayed classic topping price action. The chart showed slightly higher highs and higher lows, eventually forming a bearish Head & Shoulders pattern. This signaled a shift in momentum, and BTC subsequently broke down, confirming the bearish outlook.
At the lows later in 2021, Bitcoin’s price action became more corrective, with slightly lower lows and lower highs-often an early indication of a potential trend reversal. That reversal materialized as BTC launched into a strong impulse move to the upside, rallying all the way to the key Golden Pocket Fibonacci level before experiencing a modest retracement.
Following this healthy pullback, BTC gathered enough strength to break through resistance and surge to a new all-time high (ATH), which ultimately marked the peak of that bull cycle.
-------------------------------
This bullmarket
In the current bull market, BTC formed a classic double top pattern, echoing similar setups from previous cycles. After reaching highs near $110k BTC experienced a significant correction, dropping to around $74k. At this level, the price action turned corrective, with a series of slightly lower lows and lower highs-reminiscent of the consolidation seen at the 2021 market bottom.
During this consolidation, BTC established three notable lows, forming a potential base for a reversal. Following this corrective phase, BTC surged upward in a strong impulse move, reaching the critical Golden Pocket-the 61.8% to 65% Fibonacci retracement zone, which is widely regarded as a key area for potential reversals or continuation of trends.
Currently, BTC is consolidating near this Golden Pocket. Traders are watching closely to see if the price will face rejection here, as it did in 2021, or if it can break above and sustain a new uptrend. The outcome at this level will likely determine whether the next major move is a continuation to new highs or a deeper retracement.
-------------------------------
Conclusion
When comparing the corrections following the 2021 and 2025 peaks, the similarities are striking. Both cycles feature a bottom formed through a similar pattern, followed by a strong move up to the Golden Pocket Fibonacci level. The key question now is whether BTC will experience another corrective pullback before making a renewed attempt at the all-time high, or if it will break through resistance and continue its upward momentum. Only time will tell which path the market will choose.
-------------------------------
Thanks for your support.
- Make sure to follow me so you don't miss out on the next analysis!
- Drop a like and leave a comment!

BTC is suggesting a potential bearish reversalBitcoin (BTC) is currently exhibiting a head and shoulders pattern near the $96K– GETTEX:97K resistance zone, suggesting a potential bearish reversal. This pattern, characterized by three peaks—the middle being the highest—indicates that the upward trend may be weakening .
The Federal Open Market Committee (FOMC) meeting on May 7, 2025, is a pivotal event for BTC. While the consensus anticipates that the Fed will maintain current interest rates, the market is keenly awaiting Chair Jerome Powell's remarks for hints of future monetary policy directions. A dovish tone could bolster BTC prices, whereas a hawkish stance might exert downward pressure .
Technical analysis reveals that BTC has been trading within a range of $93,399.86 to $97,625.81 over the past 24 hours, with the current price around $96,362. The Relative Strength Index (RSI) stands at 58, suggesting that BTC is approaching overbought territory but hasn't crossed it yet .
A significant support level lies around $88,700, where substantial liquidity could trigger a price rebound if tested. However, if the head and shoulders pattern confirms a breakdown, BTC might retest lower support levels, potentially around $78,000 .
Actionable Insight: Traders should closely monitor the neckline of the head and shoulders pattern and the outcome of the FOMC meeting. A break below the neckline with increased volume could signal a bearish trend, while a dovish Fed stance might invalidate the pattern, leading to bullish momentum.
More Analysis and Trading Ideas on SorooshX

Bitcoin 2nd Entry? Is It Possible? Can I Do 20X Now?Can I still do Bitcoin with leverage? Absolutely but...
Where were you when the prices were low?
Where were you when Bitcoin traded below 80K, 90K?
Leveraged is for experts only so I would say no and yes.
No you cannot use leverage if you want to use leverage now that prices are going up. It means you have no plan and regardless if the action keeps going for long that no plan strategy will result in a big loss later down the road.
If you do decide to use leverage after the bottom is far away ($75,000 remember?), in that case you should use a maximum of 2-3X.
Yes you can use leverage if you can I don't need to tell you so. If I have to tell you so then it means that you are better off buying some Altcoins spot. Why? Because you can get the same growth potential but without the risk, anxiety and stress.
Why would you like to use leverage now?
You are thinking of making money, lots of it and fast. You are using greed to decide.
If that's the case, no! Go back to scratch and start from zero.
It is better to earn 100% very slow than lose everything thinking of making money fast.
Imagine you have a $5,000 capital and you want to open some positions using lev. You are thinking low risk, the market is already up and several days green. Tomorrow there is some political event and shakeouts can happen out of the blue. You might think you did it good, entered with low risk but as soon as there is advance you decide to buy more and your leverage increase. As prices rise you buy more and so your risk continues to increase. Then just a strong sudden shakeout and your whole stack is gone.
The intentions were nice, you wanted to make money now that Bitcoin is going up but you didn't plan and you ignored the market 100% when prices were low. Accept the loss and move on.
Now, instead of a leveraged position use $5,000 to do some spot trades. The market is bullish, the Altcoins are bullish and ready to grow next. It should be easy to pick 3-5 top pairs and double-up in a couple months.
Say it takes three months for a 200% profits, quite do-able with the Altcoins with current market conditions; now you have a capital of $15,000. Now you can use $5,000 to try leverage as much as you want but only after a correction hits and support is in, that's the time to go LONG.
And then you have $10,000 left. $5,000 is your initial layout and $5,000 is profits to enjoy with wife, your husband, your friends, your siblings or all by yourself, all alone. Whatever you do is up to you.
It is better to earn 200% slow, than to risk losing everything because greed is eating away at your soul.
Just let it go. It is never worth it to lose your hard earned cash for a dream that never turns up. Just let it go, you are better off reading and studying, you are better off saving that money rather than giving it up.
Either way, you will learn. If you engage the market long-term, accept your mistakes, eventually, you will be on the right side. Read, study, practice and meditate.
Money is easy when you develop the right mindset.
It is all in your mind.
Namaste.

Breakout confirmation: A daily close above $98K with strong vol📋 Trade Plan
Long bias remains valid above $93.5K.
Breakout confirmation: A daily close above GETTEX:98K with strong volume targets the $102.5K level.
Pullback Buy Zone: $93.5K–$94.5K if price respects support.
Caution: Overbought oscillators combined with resistance suggest a short-term pullback risk before continuation.
🟢 Long bias intact above $93.5K
🔴 Avoid fresh longs here. Wait for either breakout above GETTEX:98K or dip to support
🎯 Target: $102.5K on breakout
🛑 Invalidation: Close below $93.5K

Bitcoin Moving Averages: Back To BasicsBitcoin today is trading safely above the long-term SMA200 moving average on the daily timeframe. This is a major signal. The break above this level happened 22-April with a huge green candle. This event marks the confirmation of the next major advance. While Bitcoin was trading below SMA200 daily, black line on the chart, there was still space for doubt. Once the action moved above this indicator, the bullish bias is confirmed.
Bitcoin is also trading daily above EMA8/13/21 & 34 which are moving averages to gauge the short-term potential of an asset.
Then we have EMA55 and EMA89 which is used to measure mid-term potential. Once Bitcoin trades above EMA55 daily, we can say that mid-term growth potential is now active. 1-3 months. Once the action moves above EMA89, this potential is fully confirmed.
Finally, I track also EMA233 and EMA377, very long-term and Bitcoin trades above these as well. These are in the same range as SMA200.
Bitcoin is ultra-bullish right now and set to produce additional growth.
Remember that the MACD and RSI are also flashing bullish signals across all timeframes. Also basic.
All the technicals are 100% bullish.
Thanks a lot for your continued support.
Bitcoin (and the Altcoins) is going up.
P.S. The green action today allows for volatility tomorrow without hurting any of the bullish technicals. So bullish it is impossible to miss. The fifth consecutive week green.
Namaste.

Bitcoin Short-Term Support Zone, Buy Zone & Extreme Danger ZoneBitcoin is now trading within its main long-term 100K-200K beyond entry and buy zone. These prices are listed green on the chart.
The support zone is above $91,000 and the extreme danger zone (which won't be tested—Bitcoin is safe and strong) is $89,250.
If Bitcoin trades below $95,000 this is a major opportunity to buy and even to open LONG (lev.) positions. Any trading above $90,000 is ultra-bullish.
If Bitcoin trades at $89,250 or higher market conditions remain extremely good but this is a rare opportunity. It is likely we will not be able to enjoy these prices again but if it happens, make sure to make the best of it.
Any trading below $95,000 is a super strong buy.
Any trading above $95,000 confirms the continuation of the bullish move.
Bitcoin is neutral while the Fed decision is in. When the Fed publishes its decision, there will be some volatility followed by growth.
» Late May 2025 the entire Cryptocurrency market will be ultra-bullish. Repeat, ultra-bullish this very same month.
» Whatever you do, buy and hold and accumulate like it is the end of the world. This is truly the last chance. You've been warned.
Thanks a lot for your continued support.
You deserve the best and you are Gold!
Namaste.

Gold XAUUSD Move 06.05.2025🔹 BUY-1: 3350–3355 Zone
Conditions to Enter:
Support must hold at the 3350–3355 zone.
Wait for a clear bullish M15 candle close above the support area to confirm strength.
Rationale:
This zone overlaps with a Fresh Demand Zone identified on your chart.
Entry here takes advantage of potential accumulation and demand absorption.
It's an early entry with a tighter stop loss (just below 3346–3350).
Ideal Setup:
Stop Loss: Below 3346.
Target: Near 3380–3400 zone or higher depending on momentum.
🔹 BUY-2: 3380–3385 Zone
Conditions to Enter:
Price must break above the 3380–3385 resistance zone.
Wait for a successful retest and bullish confirmation (engulfing/imbalance/M15 close above).
Rationale:
This is the breakout and retest trade mentioned on the chart.
Entering after confirmation reduces risk of a fakeout.
Aligns with institutional breakout behaviors.
Ideal Setup:
Stop Loss: Below the retest candle or previous structure (~3370 area).
Target: 3410–3430+ depending on R/R and momentum continuation.
Kindly show your support by follow, comment and share.

ETH (Ethereum)–High-Risk, High-Reward Setup Near Fair Value GapEthereum is showing early bullish signals within a broader downtrend, and a pullback toward the $1,700 zone—where it meets the underside fair value gap and 21-day moving average—may set the stage for a higher low and potential trend reversal.
🔹 Entry Zone:
$1,700
🎯 Take Profit Levels:
🥇 $2,000
🥈 $2,200
🥉 $2,400
🛑 Stop Loss:
$1,550 (below structure and invalidation point)
