Do you think I'm joking ???I might be wrong and this might never happen, but it might come true From a technical perspective!!!
Give me some energy !!
✨We spend hours finding potential opportunities and writing useful ideas, we would be happy if you support us.
Best regards CobraVanguard.💚
_ _ _ _ __ _ _ _ _ _ _ _ _ _ _ _ _ _ _ _ _ _ _ _ _ _ _ _ _ _ _ _
✅Thank you, and for more ideas, hit ❤️Like❤️ and 🌟Follow🌟!
⚠️Things can change...
The markets are always changing and even with all these signals, the market changes tend to be strong and fast!!
Btc-e
BTC looking for retesting the support inorder to go higher. BTC looking for retesting the support inorder to go higher.
In worst case, the price can break above the 96000 range and take the resistance and come down towards lower lows
if the price is first moving towards 93000 range today or tomorrow, then btc has officially become a strong candidate for long entrys.

It is yours to take...Back in 2024 after the early August low Bitcoin produced three weeks green. There was first a small bounce, a higher low followed by three weeks candles closing green. Today is the same. After these three weeks one last red week and then the start of major advance. Bitcoin grew from a low of $52,500 to a high of $110,000.
The rise started with the three white soldiers signal again today is the same, what will you do?
It was a rise of more than 100% and yet still not the bull market year based on the halving and past history.
Bitcoin launched 2009 four years later the first major bull market and All-Time High, we all know the story in 2013. MtGox and the rest. It continues and exactly four years later we get a new All-Time High, major growth and Bitcoin goes mainstream, everybody knows about Bitcoin now and it is 2017. It doesn't stop, it continues.
Then the market crashes the end is near and people start to quit, none of those are like me who continue to post, to publish, to fight, to persist and to win. In 2021 the story is not new already old, Bitcoin hits a new All-Time High, exactly four years later and four years after 2021 is 2025... We are already in late April and no bullish action this year, are we late?
If the August low marks the start of the current advance a new All-Time High can happen in August 2025 but no, too soon, right now there are too many Altcoins.
In November 2024 Bitcoin broke above $80,000 for the first time in its history and this is the biggest development in years from a bullish perspective. So we can take November as the starting date. If we calculate one year then the next All-Time High can happen in November 2025 are we late?
Any buy below $100,000 is still a bargain we are not late at all. The next All-Time High can happen in August, in November, in December 2025 or even in Mach 2026 that doesn't matter at all, really. What truly matters right now is to buy and hold and go LONG do you agree?
That's it. This is the opportunity that your life will change.
It is right in front of you right now, it is yours to take.
Buy Bitcoin and hold.
You will be happy with the results.
Namaste.

Would BTC ever touch 100k?This is 12H and based on pure pattern, Normally this pattern is made bullish where it would touch up, but while the market is moving, its shaking both the shorts and up-s liquidity, which means BTC would try to defy the pattern by rolling it dowm, remember when this type is made on big coins, it takes and falls down, however its based pure on PA

Is Bitcoin Overextended? Here's My Trade Plan If BTC Retraces!Bitcoin Daily Chart Analysis 📝
🚀 Current Market Structure:
The daily BTC/USDT chart clearly shows a strong bullish trend, with price action recently making a significant upward move. The current candles are consolidating near the highs, suggesting a potential overextension after a parabolic rally. This often precedes a corrective phase, as buyers may take profits and new participants wait for a more favorable entry.
🔍 Wyckoff Perspective:
Your approach aligns with the Wyckoff Method, specifically looking for a retracement to the 50% level of the current swing. This would place the ideal entry zone around the $93,071 area, as marked on your chart. According to Wyckoff, after such a retrace, we should watch for an accumulation range—a period of sideways movement where smart money absorbs supply. The key signal to watch for is a "spring" (a false breakdown below the range), followed by a strong bullish breakout, confirming demand dominance.
🌐 Fundamental Backdrop:
Fundamentally, Bitcoin remains supported by several macro factors:
Institutional adoption continues, with ETFs and large funds increasing exposure.
The recent halving event has reduced new supply, historically a bullish catalyst.
Regulatory clarity in major markets (e.g., US, EU) is improving, reducing uncertainty. However, risks remain from potential regulatory crackdowns, macroeconomic headwinds (such as interest rate hikes), and geopolitical tensions.
💬 Sentiment & Analyst Consensus:
Market sentiment is currently optimistic, with the Crypto Fear & Greed Index hovering in the "Greed" zone. Many analysts are calling for a healthy correction before the next leg up, echoing your expectation of a retrace. Some prominent voices suggest that a pullback to the $92,000–$94,000 range would be constructive, allowing for reaccumulation and a more sustainable rally.
📈 Technical Triggers to Watch:
Retrace to 50% Level: Monitor for price action around $93,071–$94,593.
Accumulation Range: Look for a period of low volatility and tight range after the retrace.
Spring & Breakout: A false breakdown below the range, quickly reclaimed, followed by a strong bullish candle, would be the classic Wyckoff entry trigger.
⚠️ Disclaimer
This analysis is for informational purposes only and does not constitute financial advice. Cryptocurrency markets are highly volatile and risky. Always conduct your own research and consult with a professional before making investment decisions.

BTCUSD Sell Setup by KechFx📉 BTCUSD Sell Setup by KechFx
This script represents a clear short (sell) opportunity on the BTC/USD pair based on technical analysis.
🔹 Entry Zone: 95.200
🔺 Stop Loss: 95.563
✅ Take Profit: 93.699
📌 The setup is based on a strong rejection from a key resistance level, confirmed by price action and candle patterns, suggesting a high-probability move to the downside.
Use this script to visualize the trade idea directly on your chart and stay aligned with the potential bearish momentum.

BTC Forming Bullish Pattern and Testing Red Resistance Zone 🚨 CRYPTOCAP:BTC Forming Bullish Pattern and Testing Red Resistance Zone 🚨
CRYPTOCAP:BTC has formed a bullish pattern and is currently testing a significant red resistance zone. A breakout above this level could confirm the bullish trend and signal further upward movement.
📈 Technical Overview:
Pattern: Bullish
Resistance Zone: Red area currently being tested.

BTC Correction Likely Before ATHBTCUSDT technical analysis update
BTC price could drop to the GETTEX:89K –$91K range before moving higher. There's a CME futures gap at $90.7K, which may act like a magnet. BTC has strong support around $90K and may see a small pullback before reaching a new all-time high.

SOL Trade Setup – Structure Shift & Higher Low FormationSolana (SOL) has shown significant strength after deviating below range lows and tagging $95, quickly recovering and reclaiming key support, indicating a bullish structural shift. We’re now watching for a retrace into the $120 zone, which could confirm a higher low and set up a strong medium-term long entry.
🔹 Entry Zone:
Around $120
🎯 Take Profit Targets:
🥇 $162
🥈 $187
🥉 $213
🛑 Stop Loss:
Daily close below $110

RNDR Trade Setup – Double Bottom & Support ReclaimRender (RNDR) has shown strong resilience by forming a double bottom and reclaiming the key $4 level, signaling potential strength. We’re now watching for a sweep into downside liquidity (sub-$4 wick), with a daily close still holding above $4—this would confirm a strong long opportunity.
🔹 Entry Zone:
$3.50 to $4.00
🎯 Take Profit Targets:
🥇 $5.64
🥈 $6.70
🛑 Stop Loss:
Daily close below $3.00

BTC/USDT 1H Chart Analysis: Breakout Incoming?Hey traders! Let’s dive into this juicy BTCUSDT 1-hour chart. Bitcoin is teasing us with some serious action!
We’ve got a textbook symmetrical triangle pattern forming, with price consolidating tightly between converging trendlines. This is a classic setup for a big move — Bitcoin is coiling up like a spring, ready to explode!
The chart shows multiple phases of consolidation , with the latest triangle pushing BTC toward a critical decision point near the weekly high of $95,773.15 and the monthly high of $95,119.06.
The price is currently hovering around $95,000, testing resistance. A breakout above the upper trendline could send BTC soaring past $96,600, potentially targeting $97,200 or higher!
On the flip side, a rejection here might see it dip toward the daily low of $92,839.27 or even the lower trendline for support.
Key Levels to Watch:
Resistance: $95,773.15 (weekly high)
Support: $92,839.27 (daily low)
Breakout Target: $97,200+
Breakdown Target: $92,800
✉ What do you think — bullish breakout or bearish?
Drop your thoughts below!

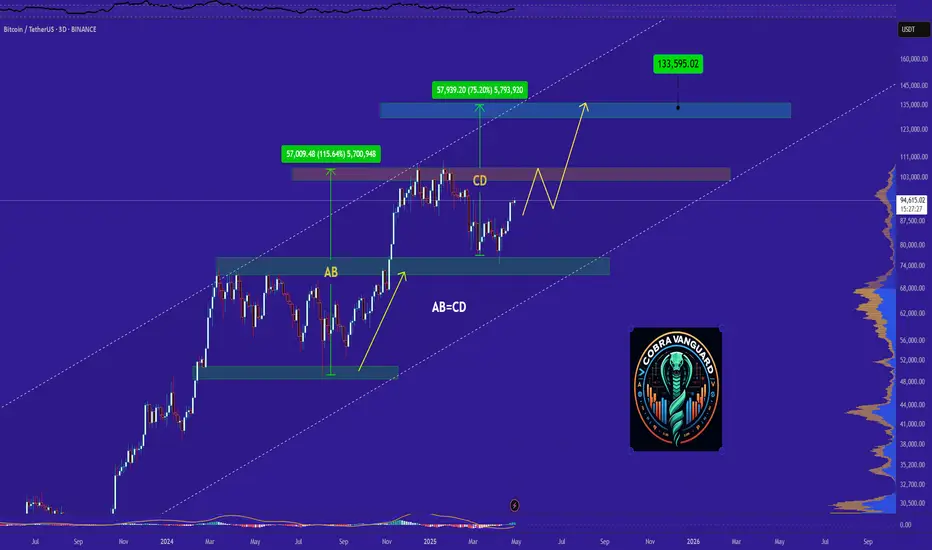
Say hello to the $110k Bitcoin !The BTC will increase $15K and reach to the top of the wedge in the coming weeks .
Give me some energy !!
✨We spend hours finding potential opportunities and writing useful ideas, we would be happy if you support us.
Best regards CobraVanguard.💚
_ _ _ _ __ _ _ _ _ _ _ _ _ _ _ _ _ _ _ _ _ _ _ _ _ _ _ _ _ _ _ _
✅Thank you, and for more ideas, hit ❤️Like❤️ and 🌟Follow🌟!
⚠️Things can change...
The markets are always changing and even with all these signals, the market changes tend to be strong and fast!!

Last Dump On BTC Be SURE TO BUY ITHi im here again we will see a last dump on btc to 89-90k be sure to buy it and don't miss the chance

Bitcoin - follow the trend until it breaks Bitcoin - follow the trend until it breaks
best Long is after Sl hunt of a range

BITCOIN Why is this rally surprising you?Bitcoin (BTCUSD) has completed 3 straight green weeks, with an impressive last 1W candle closing and started the new one right where it left. This rise shouldn't be surprising to most as it has fulfilled all the conditions that initiated all major rallies since the November 2022 Bear market bottom.
The first week of April rebounded strongly on the 1W MA50 (blue trend-line), which as mentioned numerous times on our channel, has been this Bull Cycle's main Support and kickstarted the Q4 2023 and Q4 2024 rallies.
At the same time, the 1W RSI broke last week above its MA, which has been the final confirmation of those Bullish Legs. With the 1W Bollinger Bands (BB) still ranged, the top trend-line is expected to rise aggressively as BTC's uptrend accelerates, something that resembles October 2023 and October 2024.
Throughout this Bull Cycle, those rallies have lasted around the same time, the longest being 14 weeks. As a result, the latest the current Bullish Leg tops should be on the week of July 14 2025 and a +92% rise as February - March 2024 should deliver a test of the Higher Highs trend-line around $140000.
Do you think that's the most probable scenario? Feel free to let us know in the comments section below!
-------------------------------------------------------------------------------
** Please LIKE 👍, FOLLOW ✅, SHARE 🙌 and COMMENT ✍ if you enjoy this idea! Also share your ideas and charts in the comments section below! This is best way to keep it relevant, support us, keep the content here free and allow the idea to reach as many people as possible. **
-------------------------------------------------------------------------------
💸💸💸💸💸💸
👇 👇 👇 👇 👇 👇

GBPJPY DETAILED TECHNICAL AND FUNDAMENTALSGBPJPY is currently trading around the 191.00 zone, and price action is forming a classic bullish flag pattern on the 4H chart. This follows a strong impulse leg, suggesting a potential continuation to the upside. The consolidation is tight and healthy, showing market participants are preparing for a breakout. My upside target stands at 193.000, which aligns with the descending trendline resistance.
From a fundamental perspective, the British Pound remains supported by recent hawkish signals from the Bank of England, which is facing persistent inflation pressures. Meanwhile, the Japanese Yen continues to weaken across the board due to the Bank of Japan’s ultra-loose monetary stance and its defense of yield curve control, which makes it less attractive in a high-interest environment.
Technically, this setup aligns with key momentum indicators and market structure. If price breaks above the flag pattern with volume confirmation, we can expect buyers to take control, pushing price toward the 193.000 resistance zone. This level also coincides with a key liquidity area where prior sellers may be trapped.
Overall, GBPJPY continues to offer a solid bullish bias in the short term. The pair is fundamentally and technically aligned for a push higher. Breakout traders should monitor closely as the price approaches the upper trendline of the flag. This is one of the most watched JPY pairs right now—momentum is building.

LINKUSDT → Consolidation. One step away from a rally?BINANCE:LINKUSDT entered a consolidation phase after breaking out of a downward channel. This is a fairly positive sign that buyers are building up momentum ahead of a possible breakout of resistance.
Exit from the downward price channel, distribution, and transition of the market to a consolidation phase: 15.275 - 14.400. Bitcoin is forming positive dynamics, which supports altcoins. The local alt season may continue if Bitcoin continues to grow after breaking through 95K. If LINK breaks through the resistance level of 15.275, this move could trigger further growth
Resistance levels: 15.275, 15.942
Support levels: 14.400, 14.266
At the moment, the mood of altcoins depends on Bitcoin, as it is receiving support amid positive fundamental data in the US and the global economy. However, for LINK, the focus is on the current consolidation. If the resistance level is not broken on the first attempt, it may happen during the next retest. Before that, the price may test the consolidation support with a false breakdown, which could create an imbalance in favor of buyers, only increasing the chances of growth and a breakout of resistance, provided, of course, that the overall bullish trend continues.
Best regards, R. Linda!


btc . tue . recap plan to LONG came to fruition
LONG note:
as i found wOpen heavily BULLISH - i was eager to get in early and equaly positioned:
cw0.5 . 94.200
to
cw0 . 92781
entry: 93.975
this left me with not the nicest entry . not all orders were filled . should have favoured increasing order size . one never really knows until it happens . but happy
DAY TRADE note:
a day trade of nysOpen SFP . 95.400 (to ride down for our LONG IDEA)
LONG SUPPORT will show during the day . NICE! . but not taken . it supported our search for LONG though
recap
wOpen . ASIA . LONG
nysOpen . SFP to 5.30pm . LONG
tueOpen . ASIA take profit . rotation to cw0.5 . (LONG in favour)
nysOpen . idealy tp1 : SFP . possibly rotation . (look out for SHORT and LONG)

Bitcoin Analysis Anticipated Bullish Rebound Toward $95,000! This 15-minute Bitcoin (BTC/USD) recent price action around key support and resistance zones. After a sharp dip to the lower green support area (~$92,500), the price is showing signs of a bullish reversal. The forecasted trajectory (highlighted in yellow) anticipates a corrective move before resuming an upward climb toward the $95,000 resistance target. Previous consolidation phases and a breakdown from a rising wedge pattern are also noted, suggesting a technical recovery is underway. Traders are watching for confirmation of this bullish setup.

BTC/USDT Technical Analysis. Current Price: ~$94,600
BTC has cleanly broken above the descending trendline resistance, a structure that capped price since mid-February.
This breakout was accompanied by a surge in volume and momentum — a strong bullish sign.
Golden Cross Area
A key technical confluence occurred where the 50-day MA (red) and the 200-day MA (green) were tested simultaneously, marked by the blue circle.
Price moved sharply upward after reclaiming both MAs, suggesting increased buying confidence — a textbook golden cross behavior, even if not a perfect cross yet.
Support & Resistance Flip
Previous resistance at the GETTEX:92K —$93K zone (highlighted in yellow) has now become support.
As long as BTC holds this zone, it suggests healthy consolidation and potential for a continued move up.
Trend Indicators:
50-Day MA (Red): Now curving upward — short-term bullish momentum is building.
200-Day MA (Green): Flattening and starting to rise, showing early signs of a shift in long-term trend direction.
The price is currently above both MAs, which is a key bullish condition.
Key Levels to Watch:
Immediate Resistance: $96,000–$97,500
Major Psychological Barrier: $100,000
Support Zone: $91,500–$92,500
Stronger Support (if broken): $84,000–$85,000 near the MAs
If the price continues to hold above the breakout zone and consolidates well, the next upside target will be $ 100 K.
Failing to hold the GETTEX:92K zone could invite a pullback toward the MAs around $85K — a zone where bulls may step in again.
Final Thoughts:
BTC is showing signs of renewed bullish momentum after breaking key resistance and reclaiming critical MAs. However, confirmation through consolidation and volume is essential to sustain higher levels.
Structure remains bullish unless we see a breakdown below ~$85K with volume.
DYOR. NFA. Stay sharp.

BTC PlanContext:
🔵 Open Interest is slightly increasing → healthy position building (likely shorts).
🔵 Top Traders Ratio is decreasing → top traders are positioning short.
🔵 CVD Spot & Futures are declining → no real spot buying support behind the price.
🔵 Funding Rate is neutral → no immediate short squeeze risk.
🔵 Optical Liquidity Map shows a cluster of short liquidations slightly above current price → possible liquidity grab.
Technical Structure:
🔵 Bounce on the Reload Zone (61.8%-78.6%) → normal technical reaction.
🔵 Possible Liquidity Grab just above 95k to clear weak shorts.
🔵 After the grab, expecting a strong rejection to the downside, targeting the CME Gap around 91–92k.
Scenario:
📈 Small upside move to grab liquidity around 95.5k–96k.
📉 Then bearish continuation toward the CME Gap (~91–92k).
Invalidation:
🚫 If strong spot buying steps in and price holds above 96k with strong volume → scenario invalidated.
✅ Otherwise, bearish continuation remains the main probability (70%–75%).

ETHBTC x ETH.DETHBTC x ETH.D
Ethereum bitcoin pair and ethereum dominance will gain upward momentum with the reaction it receives from the major support line in 2019
The better Ethereum is, the better Altcoins will be.
