Bearish reversal?The Bitcoin (BTC/USD) is reacting off the pivot and could drop to the 1st support.
Pivot: 94,852.52
1st Support: 88,147.57
1st Resistance: 106.444.58
Risk Warning:
Trading Forex and CFDs carries a high level of risk to your capital and you should only trade with money you can afford to lose. Trading Forex and CFDs may not be suitable for all investors, so please ensure that you fully understand the risks involved and seek independent advice if necessary.
Disclaimer:
The above opinions given constitute general market commentary, and do not constitute the opinion or advice of IC Markets or any form of personal or investment advice.
Any opinions, news, research, analyses, prices, other information, or links to third-party sites contained on this website are provided on an "as-is" basis, are intended only to be informative, is not an advice nor a recommendation, nor research, or a record of our trading prices, or an offer of, or solicitation for a transaction in any financial instrument and thus should not be treated as such. The information provided does not involve any specific investment objectives, financial situation and needs of any specific person who may receive it. Please be aware, that past performance is not a reliable indicator of future performance and/or results. Past Performance or Forward-looking scenarios based upon the reasonable beliefs of the third-party provider are not a guarantee of future performance. Actual results may differ materially from those anticipated in forward-looking or past performance statements. IC Markets makes no representation or warranty and assumes no liability as to the accuracy or completeness of the information provided, nor any loss arising from any investment based on a recommendation, forecast or any information supplied by any third-party.
BTC

$SPX Sell in May, Go Away, $5k, Dead Cat to $5.3k, $4.8k by EOMAlrighty. My forecast is as follows. I made a video explaining just a quick thought and here's the video in a written version for the most part. Basically, I'm a pattern chart trader and I spend the majority of my days looking for specific candlestick patterns that match candle for candle. I cannot find anything remotely close to today's Price Action besides October 2001. I have been and will continue to be doubted and that's okay. I am not here for anyone except myself and anyone that wants to gain a fresh unbiased perspective. People have called me a Permabear but that only pertains to my personality, which is that of a realist. I do not believe investing for the next 20-50 Years will work for everyone. You'd have to do it well and continuously contribute even during the down days. Either way. This is the analog I will be following. Fib is Extended way beyond Blow Off Top measurements imo. The market gained 50% in One Year and Three Months. I'd like to think that the uncertainty being priced in will cause these Deeper Fib Retracements. We already crashed down to the 1.61 GOLDEN POCKET from above and now bounce back to Secon Golden Pocket at 2.61. Based on the past behavior, now we move back to 2.0 for a move to the original extension of the 1.00 Fib. If we lose this, we start moving back to the 1.27 near $4.74k on SPX where I will then be looking for one final dead cat to $5300 by mid August, Every July dip being grabbed up ... Final Sell in August for an End of Year Crash to Mark 2025 as one of the worst years ever in Life as far as the Market goes. Good Luck everyone. Tips always welcome.

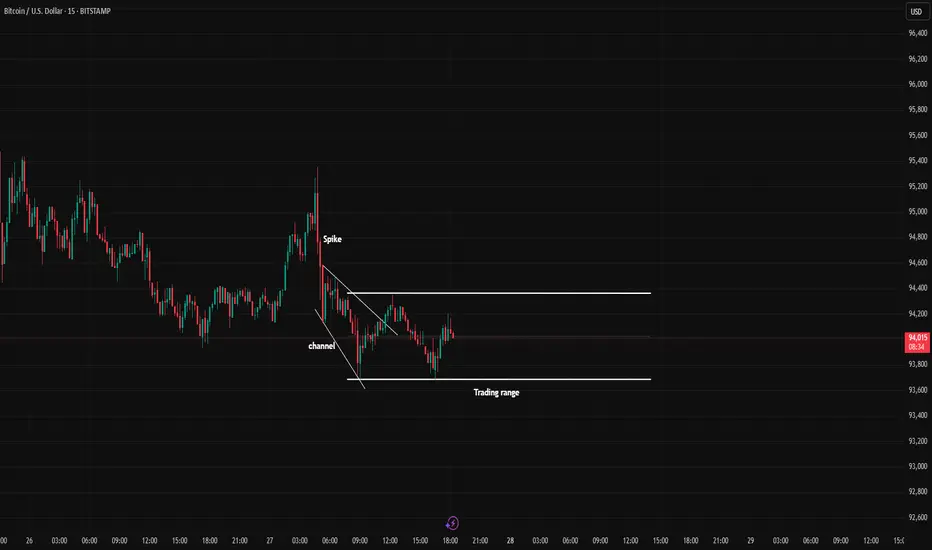
BTC cycleIn the 5-minute timeframe, you can sell at the top of the trading range and buy at the bottom of the trading range (by observing reversal candles and patterns).
Alternatively, you can wait for a breakout and enter in the direction of the breakout.
Be mindful of fake breakouts
Bitcoin Weekly, Bullish Continuation ConfirmedDid you know... Look what is happening right now on this chart, it is an amazing and incredible development you are going to love it and you are going to love me for showing it to you. It confirms everything I've been saying for the past few months.
The week closes today within three hours and this is the first time that Bitcoin closes green three consecutive weeks in the year 2025.
Three green (bullish-positive) sessions is a classic bullish signal called the three white soldiers in candlestick reading parlance. In normal terms, based on simple fact straight in your face TA, it is the first time this event happens in 2025 period. Why it didn't happen before and that's because the market was bearish. Why it is happening now it is because the market is no longer bearish and turned bullish.
Three green candles with Bitcoin moving higher but that's not all, the third candle which is the current candle is about to close full green and the biggest candle of 2025. When a strong big candle appears it only confirms what comes next.
Now, you can allow for retraces, whatever... The week has seven days. Next week the whales can trick you with a small retrace followed by huge growth. But the whales are not stupid, they cannot take the risk of selling tons and people buying everything when prices are low.
Think long-term.
Bitcoin is set to grow above $150,000 in the coming months. So, any buying below $100,000 is a super discount, below $95,000 it is just too good to pass up. So no, nobody is ready to sell we are ready for growth.
The signal is in. The fact that the market remains green while the Altcoins grow confirms that Bitcoin will produce a bullish continuation as the next major move, going up, for sure.
What will you do? Will you follow will you trust?
Will you go the other way and support the people that are saying that Bitcoin will crash when Bitcoin has been growing since November 2022?
Bitcoin is going up.
The correction is over.
The bottom is in.
It will be a massive rise lasting more than 6 months.
Are you ready for the strongest bullish action you've seen in your life?
I am.
Thanks a lot for your continued support.
Namaste.

BITCOIN → Consolidation or reversal? Why is $ 95000 important?BINANCE:BTCUSD held up quite strongly during the tariff war and largely weathered the storm, while the stock market and indices were in free fall. The improvement in the fundamental situation has once again heightened interest in the asset among traders and investors.
Earlier, I pointed out that against the backdrop of falling markets (due to Trump's policies and tariff wars), Bitcoin is holding up fairly well. It cannot be compared to gold, which maintains its status as a safe haven, but overall it has stayed out of the 73K risk zone.
Countries are continuing negotiations in the US, which generally points to an improvement in the trade situation, but all attention remains on relations between China and the US, and a resolution may be close.
Technically, on the daily/weekly timeframe, the price has broken through the trend resistance and the asset has moved from the sell zone to the buy zone, which in general only increases interest in the flagship. Bitcoin is stuck in the 95K-92K range. A false breakout of resistance provokes a correction, and now we need to monitor the price and see where the correction will stop. This will show us important support that could become the basis for consolidation.
Resistance levels: 95K, 100K, 102.5K
Support levels: 93.5, 92.9, 92, 91K
To break through 95K and continue growing, Bitcoin must form consolidation. There is none at the moment, and a correction and halt may indicate the approximate boundaries of consolidation. However, the focus is on 95 - 93.5 - 92K. If the price manages to stay within the local boundaries and continues to storm the 95K resistance, we will have a chance for a breakthrough and continued growth to 100K. Otherwise, Bitcoin may form a deeper correction, for example to 91-88K
Best regards, R. Linda!

GBPJPY NEXT WEEK BULLISH OR BEARISH ??GBPJPY is setting up for a major breakout on the weekly timeframe. After weeks of consolidation under a clear descending trendline, price action is now approaching a decisive point where a bullish breakout could trigger a strong rally. With the current price holding firm at 191.00 and clear resistance overhead, a successful breakout could open the doors for a powerful bullish wave targeting 205.000 and beyond.
Fundamentally, the yen remains weak due to continued Bank of Japan dovishness and ongoing yield curve control policies. Meanwhile, the British pound is finding strength as the Bank of England maintains a relatively hawkish stance with the possibility of delaying rate cuts compared to other major central banks. This fundamental divergence between GBP and JPY heavily favors bullish momentum for GBPJPY.
Technically, the pair has formed a solid base of support and is squeezing toward the apex of a descending triangle. If the breakout confirms with strong bullish volume, GBPJPY could enter a fresh bullish cycle, offering a great risk-reward setup for medium to long-term traders aiming for the 205.000 area.
Overall, GBPJPY remains one of the hottest pairs on watch right now with excellent bullish potential. Traders should watch for a clean breakout above the trendline with strong candlestick confirmation to ride the wave higher. Staying patient and disciplined around this breakout zone could deliver highly profitable results.

HEIUSDT Falling Wedge Pattern Targets 150%-160% Gains!HEIUSDT is currently forming a strong falling wedge pattern, a classic bullish reversal signal. The price has been consolidating within this wedge for some time, and we are now starting to see a breakout attempt with good supporting volume. This setup is gaining attention among investors who are looking for promising opportunities in the altcoin market.
Volume has notably increased, suggesting strong buying pressure is building up. Historically, falling wedges often lead to explosive upward moves once a breakout is confirmed. In this case, the projected gain is around 150% to 160%, which makes HEIUSDT a very interesting pair to watch in the coming days and weeks.
Many traders are keeping a close eye on HEIUSDT due to the solid technical pattern and growing market interest. If momentum continues and broader crypto sentiment remains positive, this breakout could lead to substantial price appreciation. Risk management is key, but the potential reward here looks highly attractive.
✅ Show your support by hitting the like button and
✅ Leaving a comment below! (What is You opinion about this Coin)
Your feedback and engagement keep me inspired to share more insightful market analysis with you!

#BTC #BTCUSD #BTCUSDT #BITCOIN #Wyckoff #Analysis #Eddy#BTC #BTCUSD #BTCUSDT #BITCOIN #Wyckoff #Analysis #Eddy
This analysis is based on the analytical style of the Wyckoff Distribution Structure of Schematics 1 and 2.
I have outlined for you the important parts of the Wyckoff style on the one-hour timeframe.
Currently, we are in Phase C of the Wyckoff Distribution Structure.
We have to wait for the completion of this phase and the start of Phase D of the Wyckoff Distribution Structure.
When will this structure be fully confirmed? When the Bitcoin price falls to the 91800 support and gathers the final spring when this support is broken for the fall, we will enter a short position by getting the necessary confirmations based on our style and strategy.
💬 Note: It is not exactly clear whether the market maker will act based on Schematic 1 or 2, so the best entry point for short positions will be the 91800 support break. If, based on the schematic 1, the Bitcoin price UTAD and test formed, high-risk traders who are willing to trade in the opposite direction can enter a short position by getting confirmation in the time frames below 15 minutes.
Where will the targets be? The first target is 62000 and the second target can be 46000 dollars.
When can you safely close the position and enter a reverse trade, that is, long or buy? When a Wyckoff accumulation structure is formed at one of the targets.
The responsibility for the trade is yours and I have no responsibility for your failure to comply with the risk and capital management.
Good luck and be profitable.
I also invite you to review and view my latest analysis on Bitcoin via the link below:
For altcoins, follow my analysis on the Total 3 chart.
My analysis of the Total 3 chart:

Say hello to the $110k Bitcoin !Say hello to the $110k Bitcoin !
Chart is speaking itself...
Give me some energy !!
✨We spend hours finding potential opportunities and writing useful ideas, we would be happy if you support us.
Best regards CobraVanguard.💚
_ _ _ _ __ _ _ _ _ _ _ _ _ _ _ _ _ _ _ _ _ _ _ _ _ _ _ _ _ _ _ _
✅Thank you, and for more ideas, hit ❤️Like❤️ and 🌟Follow🌟!
⚠️Things can change...
The markets are always changing and even with all these signals, the market changes tend to be strong and fast!!

#BTC #BTCUSD #BTCUSDT #BITCOIN #Update #Analysis #Eddy#BTC #BTCUSD #BTCUSDT #BITCOIN #Update #Analysis #Eddy
I have identified the important support and resistance areas of the weekly timeframe for you.
I have identified the important resistance prices for the start of the decline with the red line and the important support prices for the start of the growth with the green line.
This analysis is based on a combination of different styles, including the volume style with the ict style.
Based on your strategy and style, get the necessary confirmations for this analysis to enter the trade.
Don't forget about risk and capital management.
The responsibility for the transaction is yours and I have no responsibility for your failure to comply with your risk and capital management.
💬 Note: An important analysis will be presented on the lower timeframe on Bitcoin soon, which, based on the chart and explanations sent in that analysis, you can hunt for Bitcoin's decline by getting confirmation, pay attention to the current chart and consider important liquidity, including the Decision and Extreme areas.
Be successful and profitable.
For altcoins, proceed according to my analysis on the Total 3 chart.
My analysis of the Total 3 chart:
You can also view and review my previous analyses on my TradingView page.
Please don't forget to like and follow, your support encourages me to continue on my path and provide more analysis and updates.

Bitcoin's next targets are 140K and 250K !This analysis is an update of the analysis you see in the "Related publications" section
Are Bitcoin's mid-term targets still valid?
First of all, please review the previous analysis
In our last analysis, we mentioned that if there was any drop, it would likely be towards the resistance line that had been broken, and we identified the pullback zone around the 77K channel.
Now, based on the available data, the pullback has been successful, and Bitcoin's target is to move toward the 130-140K range. A 3D pattern has formed, and the third drive could complete within this range, after which Bitcoin may enter a corrective phase.
But what about the second target | 250K?
Why are we considering this target? There are several reasons:
First, the bullish wave in gold was preventing capital from flowing into cryptocurrencies, especially Bitcoin. Now, gold is reaching the end of its bullish wave, which could lead to significant liquidity flowing into crypto and Bitcoin.
Second, Bitcoin's channel structure remains very bullish. If substantial liquidity enters the market, not only could the 250K target be achieved, but Bitcoin might even reach higher levels.

BITCOIN - Price can exit from wedge and rise to $100K levelHi guys, this is my overview for BTCUSDT, feel free to check it and write your feedback in comments👊
Some days ago price reached resistance line of triangle and then, in a short time, declined to $80300 level.
Price broke $92000 level and then some time traded inside triangle, where it reached this level again and then corrected.
Later BTC exited from triangle and entered to wedge, where it first declined below $80300 level, but later turned back.
Then it continued to move up inside wegde, where it later made correction to support line and then rose to $92000 level.
Soon, price broke this level and even reached resistance line of wegde, after which it corrected and continues to rise.
Possibly, price can bounce up from support area to $100K, thereby exiting from wedge pattern.
If this post is useful to you, you can support me with like/boost and advice in comments❤️

Bitcoin Trading and Investment Strategy (April 2025)Bitcoin (BTC) is trading around the mid-$90,000s after rebounding ~25% in April, with market sentiment shifting to greed. BTC’s dominance is high (~64%) as capital concentrates in Bitcoin over altcoins. On-chain data shows large holders (“whales”) aggressively accumulating, even as short-term traders turn optimistic. Below is an actionable strategy.
BTC broke out of a multi-month falling wedge pattern, signaling a potential bullish reversal. On the 1H/4H charts, momentum is bullish: a textbook double-bottom formed on the daily with a neckline around $87,600 was breached, confirming upside targets near $100,600.
A bull pennant consolidation is visible on the 1H after the sharp rally, hinting at another leg up (measured move target ≈ $100,900 on breakout). Short-term EMAs (20/50) on 1H/4H have turned upward and are stacked bullishly, aligning with the daily 50 and 200 EMAs which have flipped into support. The Relative Strength Index (RSI) is in bullish territory without extreme overbought readings, leaving room for further upside. Volume has been steady to rising on upward moves, indicating buyers remain in control.
Immediate support lies at the breakout zone of GETTEX:87K –$90K (prior resistance now turned support). This area includes the daily double-bottom neckline (~$87.6K) and coincides with the top of the earlier consolidation range. Bulls want to see this zone hold on any pullback. Below that, secondary support is around $84K and roughly the 4H 200 EMA area.
Resistance is clustered at $94K–$95K (recent local high region). A 4H close above $95K with strong volume would likely trigger momentum buyers. Beyond there, $100K is a major psychological level and the short-term target from multiple patterns – importantly, a dense cluster of short seller liquidation levels sits around $100K, making it a “liquidity magnet” for market makers. Expect heavy order flow and possible volatility as BTC approaches six figures. Above $100K, minor resistance could appear near ~$102K (projected wedge target), then prior ATH ~$108K–$109K.
For longs, scale out profits in layers as BTC advances. First TP around $100K – just before the round number – to avoid slippage if a wave of selling hits there. If momentum is very strong, hold a portion for a possible extension to $102K–$105K (wedge target zone). A stretch goal for bulls would be the $108–$110K area (all-time high region), but tighten stops well before this level as profit-taking is expected near ATH.
If BTC falls back under the GETTEX:87K neckline after having broken out, it would negate the double-bottom breakout and likely accelerate downward. Thus, stop-losses for longs can be placed just below GETTEX:87K (e.g. $86K) to cap risk.
The breakout from the wedge/base was accompanied by a surge in volume, confirming institutional participation. Volume has not dried up on this rally – a positive sign that the trend could sustain. Overall, the daily chart structure sets the stage for a potential run back to five-figure territory (100K+), provided key support levels are defended.
Any dips into the high-$80Ks are buy-the-dip opportunities as long as BTC quickly reclaims $90K. Below GETTEX:87K , the next critical support is $80K–$84K. $84K was highlighted as a crucial level – failure to hold 84K during the last pullback would have signaled capitulation. It held then, so watch it on any retest.
Stop Loss:
Short-Term: 5–10% below entry ($90,000 for $92,500 entry).
Mid-Term: 10–15% below entry ($85,000 for $91,000 entry).
Long-Term: Monitor support ($80,000) but hold unless fundamentals deteriorate.
Position Sizing:
Short-Term: 1–2% of portfolio per trade.
Mid-Term: 5% of portfolio.
Long-Term: Up to 10% of portfolio.
Risk/Reward: Target 2R for short-term, 3R for mid-term, and let long-term investments ride based on fundamentals.
Not a financial advice. DYOR.

Ethereum Trade IdeaEthereum has broken out of it's ascending triangle pattern.
A possible retest of the triangle resistance levels which might turn to support.
If the level holds up that will be a begining of a new uptrend for Ethereum.

BTC - Golden Pocket Confluence + FVG Sweep = Long SetupA highly refined scenario blending Fibonacci confluence with liquidity principles, setting up a controlled bullish play.
---
1. Golden Pocket + FVG Confluence — Critical Demand Zone
The blue highlighted area represents a strong confluence:
- FVG (Fair Value Gap): Imbalance left by aggressive price movement, likely to attract price for rebalancing.
- Golden Pocket: The 0.618–0.65 Fibonacci retracement zone, statistically favored for deep retracements and high-probability reversals.
Expecting strong buying interest once price taps into this confluence.
---
2. 0.618-0.65 Fib Range — Key Reversal Territory
The Fibonacci zone offers the perfect environment for engineered liquidity sweeps and smart money accumulation.
- This range often acts as a trap for retail shorts while institutions accumulate.
- A clean entry opportunity arises as price dips into this critical golden zone before expansion.
---
3. FVG Resistance Above — Initial Reaction Zone
A notable FVG resistance area is marked around 94,400–94,500:
- Upon reaching this zone, price may face initial selling pressure or short-term consolidation.
- Observing how price interacts here can further confirm bullish strength and continuation.
---
4. Smart Money Liquidity Play
The setup suggests a classic liquidity engineering move:
- Induce shorts through a pullback into the Golden Pocket.
- Absorb liquidity inside the FVG.
- Trigger a sharp bullish reversal aligned with institutional footprints.
This layered setup is clean, logical, and methodical.
---
5. Projected Price Flow
Anticipated price action structure:
- Step 1: Dip into the Golden Pocket + FVG demand zone.
- Step 2: Reversal toward the FVG resistance.
- Step 3: Breakout continuation upon reclaiming resistance, leading to further bullish expansion.
Each leg is mapped to follow high-probability liquidity behavior.
---
6. Summary:
- Golden Pocket + FVG = Prime Reversal Confluence
- Efficient Liquidity Sweep Mechanics
- Structured Bullish Progression Based on Smart Money Concepts
This plan is framed to capitalize on precision entries and liquidity dynamics without chasing price.

BTC Is Still Bullish (4H)This analysis is an update of the analysis you see in the "Related publications" section
Bitcoin is still struggling with the supply zone we identified in the previous analysis. It has not yet been able to establish itself above this supply area.
A slight correction is expected, with support anticipated from the green box.
The closing of a 4-hour candle below the invalidation level will invalidate this analysis.
For risk management, please don't forget stop loss and capital management
Comment if you have any questions
Thank You


btc . w4 - wknd . SHORT but cautious - yet paytientfriday plan, was to SHORT (see prvs post)
sell zone
starts . friday open
ends . monday open
entry . 95.542
sl . -2.62%
10 sell orders . 1.52% spread
tp1 . 91.642 . +3.99%
funding . +0.01%
we are according to plan + collecting funding
tp1 adjusted to moderate, since bullish outlook coming from april.
tp2 . +10.11%

Bitcoin: The Path To 109K Is Now Open.In my previous article I describe the potential breakout if 88K was compromised. I pointed out, the compound double bottom in the 74 to 78K area implied a greater probability of price breaking out, it was just a matter of catalyst. IF anything this possibility should have told you that swing trade shorts are a lower probability and much riskier within that resistance zone. For those of you looking for precise calls, eventually you will learn there is no such thing, because markets adjust to new information as it becomes available but we can assign loose probabilities to scenarios. So what technical possibilities are we looking at for the upcoming week and how will this shape our expectations?
On my chart, the updated anticipated scenario (See illustration) points to a retrace back to the 90K area which is NOW a support. Since the broader trend is bullish it is within reason to expect this support to HOLD and NOT break. That means it is an ideal location for high probability swing trade longs UPON confirmation. Watch 93,250 break (see blue arrow) to confirm price is following the retrace scenario (break of previous candle low). IF this is not broken, then the retrace scenario is NOT in play.
Another fact I want to point out is a new minor impulse structure is now in effect (it is not numbered on the chart). The move from the 74K low to the current high contains 3 waves which means the next retrace is likely Wave 4 which would then open the possibility for the Wave 5 breakout beyond the 95K area. Wave 4 to 5 is the highest probability wave to anticipate because it requires 3 waves to be in place and has to adhere to the Wave 1 overlap rule. While this does not offer a specific setup to trade, it does help to shape a clear expectation. All you need from there is a system or method to confirm the bullish reversal (like the Trade Scanner Pro).
Other than that, If Bitcoin manages to maintain the support above 90K, this new rally may be the broader Wave 5 that I have talked about previously which implies a test of 109K over the next quarter. Again this is a game of gauging potential and then quantifying the risk that is associated with it. That is only the beginning of the trade idea because from there you must have a decision making process in place to manage the trade in a constantly CHANGING environment. IF you fail to have such a process then you face random results.
Thank you for considering my analysis and perspective.

BRIEFING Week #17 : AAPL's fate is the SP'sHere's your weekly update ! Brought to you each weekend with years of track-record history..
Don't forget to hit the like/follow button if you feel like this post deserves it ;)
That's the best way to support me and help pushing this content to other users.
Kindly,
Phil

Bitcoin —Short-Term Retrace (Drop) Or Higher Next?Look at this, this is Bitcoin on the daily timeframe. I will keep it short, sweet and easy.
Bitcoin broke up 22-April and has been sideways since with an upward bent. When Bitcoin is set to drop, it drops the next day.
It has been four days and Bitcoin is going up, no retraces. This indicates that the next move will be a big, very big, green candle. No significant drop so far.
A drop would mean prices moving below 90K. Wicks lower or higher are not relevant and consider noise only. Not a drop nor a rise.
The next major move is up. Bitcoin is going up.
The action on the chart reveals higher prices.
The action coming from the Altcoins market reveals a major advance happening in the coming days.
Four days not lower but higher.
The 2-March high, the highest price since the first drop below 90K has been compromised. There was no strong rejection nor selling pressure.
This is a strong resistance level, $95,000. As soon as it gets conquered, Bitcoin will move straight up to $100,000.
Very easy, simple, short and sweet.
Bitcoin is going up. Buy and hold.
Buy and hold. I repeat.
Orange is the target zone. Short-term. Up next.
Namaste.

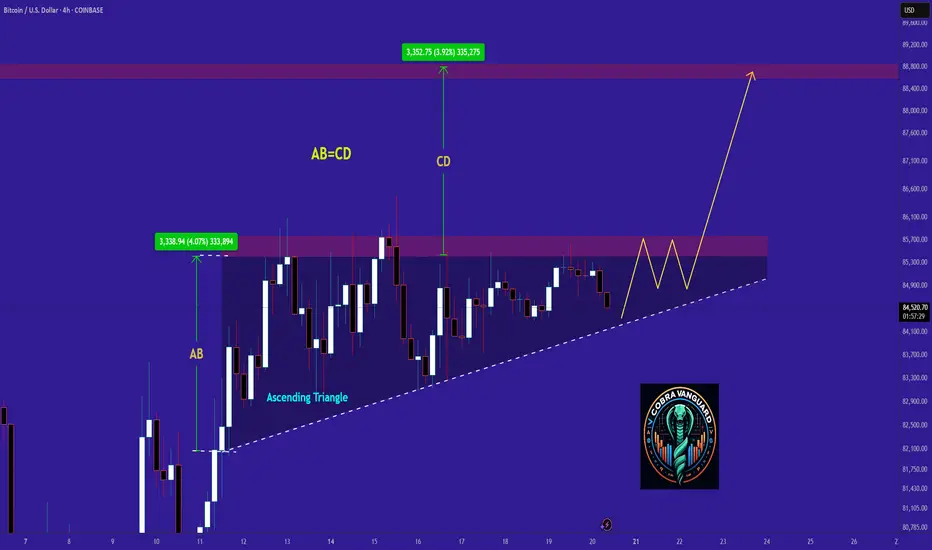
BITCOIN Ready for PUMP or what ?Currently, COINBASE:BTCUSD is forming an ascending triangle, indicating a potential price increase. It is anticipated that the price could rise, aligning with the projected price movement (AB=CD).
However, it is crucial to wait for the triangle to break before taking any action.
Give me some energy !!
✨We spend hours finding potential opportunities and writing useful ideas, we would be happy if you support us.
Best regards CobraVanguard.💚
_ _ _ _ __ _ _ _ _ _ _ _ _ _ _ _ _ _ _ _ _ _ _ _ _ _ _ _ _ _ _ _
✅Thank you, and for more ideas, hit ❤️Like❤️ and 🌟Follow🌟!
⚠️Things can change...
The markets are always changing and even with all these signals, the market changes tend to be strong and fast!!
$BTC - Weekend OutlookBitcoin just tapped into the major overhead supply zone 95k, which corresponds to the breakdown origin of the previous range.
Notably, we observed the highest Coinbase premium in recent sessions, signaling aggressive spot-driven demand. However, a sell wall is starting to build around 95k and 97k, suggesting that short-term sellers are positioning here.
Key support to watch : the 88k–86k range, which marks the recent breakout base and vwap.
Holding this zone would validate the breakout structure and set the stage for further continuation to the upside. Failure to hold likely triggers a deeper retest toward mid-range levels.
Expect volatility over the weekend as price oscillates between overhead supply and this critical breakout support.
