BTCUSD Do you think this position is a turning point?According to the current trend analysis, BTC has reached a critical point of long-short negotiations in the short term, but it is also at this time that we must pay attention that there is a high possibility of large fluctuations. Traders still need to observe calmly. Blindly entering the market will only put you in danger.
From the analysis, BTC can focus on the resistance of 90700 and 91500 in the short term. Focus on the support of 88500 and 87400 below.
Trading is risky, so control your position reasonably. The market is changing rapidly, and accurate signals are subject to real-time. BINANCE:BTCUSDT INDEX:BTCUSD COINBASE:BTCUSD BITSTAMP:BTCUSD
Btctrend

Make continuous profits of 10,000 points on BTCUSD, please come My name is Baker, and I am a professional analyst with more than ten years of experience in the financial industry. After witnessing insider trading in the market, I decided to resign from all institutional positions and form my own analyst team. At present, my team and I focus on in-depth analysis of gold, Bitcoin and oil market trends and medium- and short-term fast trading strategies. Of course, I am also a mentor to many traders in the market. Recently, I have continuously made profits of 5,000-10,000 points in BTC transactions, and my members have made profits of more than 600%. In the following time, I will share with you trading skills, accurate signals, insider information and other content. Interested traders can keep following up.
The market has been very unstable recently. If you are a novice trader or a trader with a bad mentality or a trader who has suffered too much loss in the past, it will be more difficult for you to trade in this market, because I have come from that stage. So I know it all. But how to trade is a very critical step, when to buy, when to sell, how much profit can you accept for each transaction, and how much loss can you accept for each transaction. Loss is equivalent to paying tuition fees, see how much loss you can bear and what you can learn. How to effectively control trading risks. Reasonably control trading positions. These are things that must be faced in trading. When trading, the market will create opportunities for us to make money. But it requires courage and execution. When not trading, you need patience. The market gives us opportunities to make money. But it will not give us the opportunity to continue to make money. So we have to seize the opportunity to make money.
When you come to this channel. Then your choice will not be wrong. Believe in your own vision. Because your vision will guide you how to become better. Smart people find me after losing money, become my members, and let me help them. This is indeed a method. Because in this way, you can not only get accurate trading signals, but also learn how to manage your trading mentality, how to control risks, how to trade correctly, and why to trade. BINANCE:BTCUSDT INDEX:BTCUSD BITSTAMP:BTCUSD COINBASE:BTCUSD

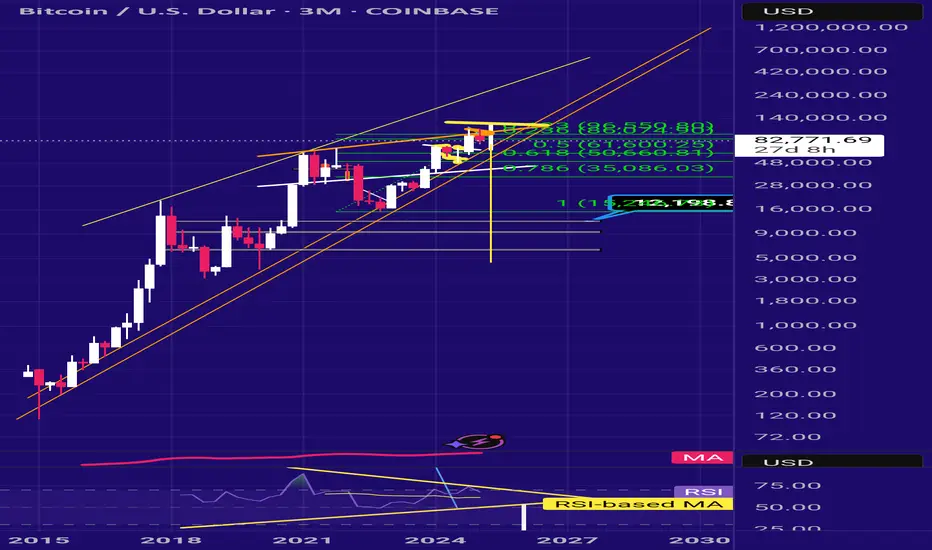
BTC in trouble. Sale Now.We are going to $61k and if we break that, we go to $50k.
If $50k breaks, guaranteed we go to $12k.
The worst case scenario is at $3k. Probable and possible based on chart patterns.
Obvioisly with a lot of up and downs and mini bull-runs but in the the big picture, we are going down.
The 2 year bear market cycle started.
Hold tight.
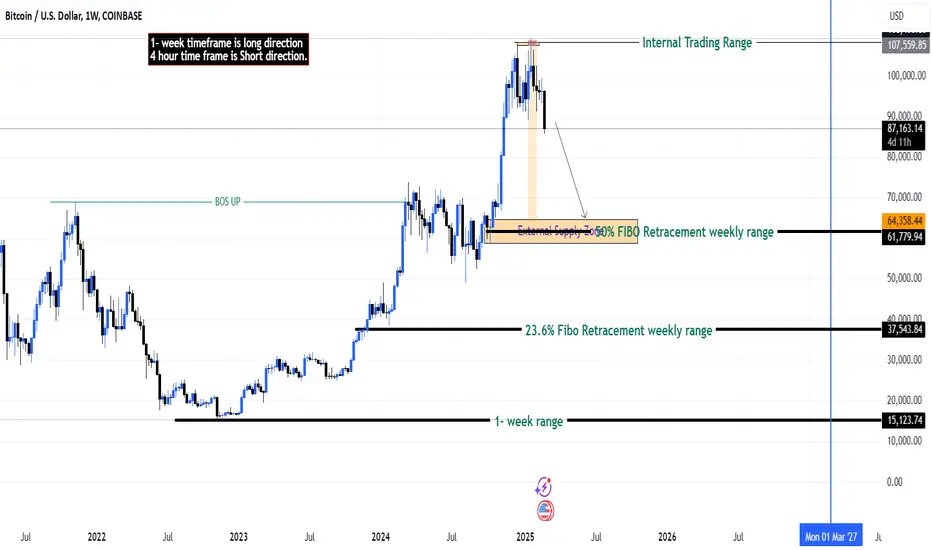
BTC Rebalance in Play? Key Retrace Setup Unfolding!Bitcoin has tapped into a bullish imbalance on the weekly timeframe—a natural move as the market seeks to rebalance. 🔄 We often see reactions around the midpoint of these levels.
If price starts ranging sideways and breaks structure to the upside, we could consider a counter-trend trade on the retrace, then look for another sell opportunity as it pulls back. 📊
I’ll aim to follow up with a video over the weekend. Stay tuned! 🎥
Not financial advice. ⚠️

Bitcoin Reversal Setup – Potential Upside Within the ChannelBTC/USD is currently trading within a descending channel on the 1H timeframe. The price has recently bounced from the lower trendline support, indicating a possible reversal.
Key Levels & Observations:
• Support Zone: ~ $78,000 (recent low & trendline support)
• Resistance Levels:
• $95,000 (major resistance level within the channel)
• $96,000 (potential breakout level)
Trading Idea:
A bullish move is anticipated if BTC holds above the lower trendline. A potential target is the mid-channel resistance ($93,000), with an extended move toward the upper boundary ($94,600). A break above this level could signal a broader trend reversal.

Broad View on Bitcoin - FxDollars - 26/02/2025Educational Analysis says BTCUSD may move DOWN from this range, according to my technical.
Broker - COINBASE
Because the BTCUSD pair showed some bullish weakness, it finally did liquidity, which was taken out on buy-side orders to show a sign of a downtrend, and I am looking to counter-trend this position.
Let's see what this pair brings to the table for us in the future.
Please check the comment section to see how this turned out.
DISCLAIMER:-
This is not an entry signal. THIS IS ONLY EDUCATIONAL PURPOSE ANALYSIS.
I have no concerns with your profit and loss from this analysis.
I HAVE NO CONCERNS WITH YOUR PROFIT OR LOSS,
Happy Trading, Fx Dollars.
BTC - Where Are We?If you think 109k was top, you clearly are not bullish enough, and if you're already liquidated or scared of mere 20% dip then you are over-leveraged which is not healthy.

BTC USDT Buy ZoneAs discussed earlier safe zone for BTC USDT LONG/BUY .
Handel with care maximum possiblility of testing 89000 area place order accordingly.
Happy Trading ..

Bitcoin Overextended? Key Levels & 15-Min Chart Setup Revealed!📈 Bitcoin seems overextended right now. 🔑 In my opinion, it's testing key support levels. I'm watching for a retrace into the midpoint of the previous price swing for a potential short opportunity. 🎥 In the video, I break down key insights on the trend, market structure, and price action, and show exactly what I'm looking for on the 15-minute chart for an entry. 🚨 Not financial advice! 📉

Bitcoin BTC Breaking Structure? Key Levels & Trade Setup!👀 👉 In this video, we analyze Bitcoin (BTC) and its recent price action. The four-hour chart shows a bearish break of structure, and my short-term bias remains bearish. I'm waiting for a short entry, aiming for previous lows highlighted in the video. This is not financial advice.

I want to warn you about $BTCI understand that it's impossible to predict the exact peak down to the last cent unless you have some insider data. I see the global sentiment. I see that companies are currently obsessed with the BTC ETF mania and risk, while others are paralyzed by fear, throwing up their hands and saying, "That's it, we're done." I believe that, most likely, the global high is here. We've seen the same wedge pattern form in 2021, 2013, and 2017, which signaled one thing—the bull market was over.
There's no altseason, but at the very least, there will be opportunities to reclaim profits because there will still be short squeezes. However, that’s just a momentary event. We see everything falling, and then suddenly, altcoins start shooting up—this is a sign that the end has come for the market.
I've already thought about where to escape and what to do. I have plans A, B, C, and D, but only one of them is positive. The rest are about pure negativity in the world, which will only continue to escalate.

Bitcoin (BTC/USD) Trade Setup – Potential Bullish ReversalHelle Guys Here Is My First Analysis On BTC/USD Keep Me Update In And Follow Me For More Instrutions thanks
On the 1-hour chart, Bitcoin recently broke out of an ascending channel but faced a sharp correction. Price has now found support around $94,400, which aligns with a key demand zone. A rebound from this level could trigger a bullish move toward the $99,700 target, where strong resistance is expected.
Trade Plan:
Entry: Near $96,200, after confirmation of support.
Target: $99,700 (key resistance zone).
Stop Loss: Below $94,400 to manage risk.
If price holds above support and reclaims key levels, a bullish continuation is likely. However, failure to hold could lead to further downside. Traders should monitor price action and volume for confirmation before entering.
Let me know your thoughts in the comments! Do you see BTC recovering or breaking lower? 🚀📉
Must Support Me And Share it With Your friends And Family thanks Trade At Own Risk and Strategy

$BTC Daily UpdateCRYPTOCAP:BTC #BTC Back above $95,878 support, $97,780 resistance in effect, previous 1D closed with bullish engulfing, time to see if current daily can follow thru. RSI and MACD on 1D looks good with potential to test $99,361, with weekend approaching current weekly also looks pretty good, Current support at $95,878, continue watching given s/r.

Bitcoin Trading Plan & Market Analysis🚀 In this breakdown, I outline my trading plan for Bitcoin (BTC), focusing on market structure, price action, and key liquidity dynamics.
🔍 Key Observations:
✅ Price Action & Liquidity Sweeps
* Bitcoin has been forming equal highs/lows, with dips below the lows targeting southside liquidity before rallying.
* On the 4-hour timeframe, this pattern has repeated multiple times—suggesting smart money accumulation at current levels.
✅ Confirmation Criteria
* My bullish thesis remains unconfirmed until we see:
* A decisive breakout of the current range.
* A successful retest and failure of that breakout level.
* If these conditions are met, I will be looking for buying opportunities.
✅ Final Confirmation
* A break of key resistance (highlighted in the video) is critical for confirming a trend reversal.
📺 Everything is explained in detail in the video—this is NOT financial advice!

Traders who followed my plan made a huge profit of 1500 pipsThis moment is exciting, happy, and incredible.
For traders who followed my plan and bought at 93500, the price of BTCUSD has reached 95500 at this moment, and the second target TP94800 I provided has been accurately reached. The traders who followed it have made a huge profit of 1500 points. This is a pleasing and incredible plan. I feel very happy and proud at this moment. This plan has helped me help more traders get huge profit returns. Great. Of course, I will continue to share my ideas and accurate trading plans here. Traders who think my plan is great, remember to stay tuned.
Mr. Baker
CRYPTO:BTCUSD INDEX:BTCUSD BINANCE:BTCUSDT.P BINANCE:BTCUSDT

Bitcoin is accelerating its decline, and a reversal opportunityComprehensive overall trend analysis shows that Bitcoin has experienced a single-day decline.
The opening of the US stock market in the evening accelerated the decline of Bitcoin
Currently, Bitcoin has fallen below the 95,000 mark. According to trend technical analysis,
Bitcoin has hit the short-term support level, and now we can plan to do long transactions
Bitcoin long plan:
Buy: 93,800-93,500
Closing: 94,500-94,800
Stop loss: 93,200
Mr. Baker
INDEX:BTCUSD CRYPTO:BTCUSD

BTC correction time?I can see in this weekly chart that if BTC didn't respects it's Support level 93k-91k, it might show 75k as a retest performing double Top pattern, then we can start going Bullish if it don't break 75k... After that market may show 120k to 125k. But if market don't respect 75k, it might go further down.

BTC (BITCOIN) IDEA IS HERE Hello Guy's Welcome To Another Day Of TRADING
Here we are mapping chart of BTCUSDT ( BITCOIN ) in 30-M TF
This chart shows Bitcoin’s price movement over time.
The Pattern: The price is moving inside a triangle shape, getting squeezed between two lines.
Resistance Zone: Bitcoin tried to go above $97,000 but got pushed down
RESISTANCE LEVEL. 96800/97000
TARGET WILL BE. 94000
If the price breaks below the lower line of the triangle, it may fall further, possibly to $94,000 or lower..

Is BTC Gearing Up for a Bullish Reversal? Here’s My Game Plan!👀 👉 In this video, we analyze BTC, which is currently rangebound. On the 4-hour chart, I’m noticing equal lows followed by a liquidity sweep, then a higher low and a higher high. If Bitcoin breaks above the current range high, I’ll be looking to buy. However, if it trades lower, breaks the range low, and fails a retest, a short setup would be more suitable. We’ll cover trend analysis, price action, market structure, and both bullish and bearish scenarios. Not financial advice.


The Path to $158K – A Two-Phase Bull RunBitcoin (BTC/USD)
Bitcoin is on track to reach $134,000 by April 2025, following the natural progression of the bull market cycle. However, as BTC approaches this key level, profit-taking and market dynamics will likely trigger a pullback phase, setting the stage for the second and final leg of the bull run.
Phase 1: The $134K Target and Pullback (April–July 2025)
BTC’s bull market momentum is expected to push the price toward $134,000 in April 2025, marking a critical milestone.
As this level is reached, a selling phase will emerge, leading to a correction between $62,000 and $72,000 from May to July 2025.
This retracement will serve as a healthy market reset, allowing for renewed accumulation before the next explosive move.
Phase 2: The Final Bull Run to $158K (Nov–Dec 2025)
After the correction, BTC will enter the second phase of the bull cycle, characterized by renewed investor interest and fresh capital inflows.
A new wave of hype and adoption will propel Bitcoin toward its final bull market peak of $158,000 by November–December 2025.
This mirrors historical market cycles, where a strong initial rally, followed by a correction, leads to an ultimate parabolic run before the market cools down.
Key Price Levels to Watch:
Target 1: $134,000 (April 2025) → Key milestone before the pullback.
Pullback Range: $62,000–$72,000 (May–July 2025) → Profit-taking phase and market reset.
Final Bull Run Target: $158,000 (Nov–Dec 2025) → Peak of the bull market before a potential cycle shift.
Summary: History Will Repeat Itself
Bitcoin's bull market progression follows a well-established pattern of rapid price appreciation, sharp corrections, and a final euphoric rally. With $134K as the first major target, a pullback to $62K–$72K will act as the foundation for the second explosive phase, ultimately driving BTC to its anticipated $158K peak by late 2025.
As always, market cycles repeat, and this time, history appears to be following the same script once again.

BTC - Third Touch Possible Move BTC has well consolidation done now if third touch happen it would break the support and next move would be near 91000-92000, alternative scenario if breakout happen that means market did not respect to 3rd touch then we can see market near 99000-100000

BTC H4 Liquidity Valid Area! Read ChartHello Traders!
BTC is trading in triangle and also respecting to support area, in H4 there is liquidity to my marked level, BTC CRYPTOCAP:BTC definitely would sweep it. but first need rectangle breakout confirmation.
Support: 92600-91700
Resistance: 107000
Liquidity: 104450
Like my idea if you like it
