Bitcoin vs. Nasdaq: BTC Shows Signs of Decoupling Amid US Stock
For years, the narrative surrounding Bitcoin’s price action has been inextricably linked to the performance of traditional financial markets, particularly the tech-heavy Nasdaq Composite. Often moving in lockstep, Bitcoin was viewed by many as a high-beta asset, amplifying the gains during bullish periods and suffering even steeper losses when risk sentiment soured in equities. However, recent market movements have sparked a crucial question among investors and analysts alike: is Bitcoin finally beginning to forge its own path, decoupling from the gravitational pull of U.S. stocks as they face mounting headwinds?
The past few weeks have witnessed a notable divergence. While U.S. stock markets, reeling from a confluence of factors including escalating geopolitical tensions stemming from a potential “Trump tariff war,” persistent inflation concerns highlighted by Federal Reserve Chair Jerome Powell’s hawkish warnings of “higher inflation and slower growth,” and broader macroeconomic anxieties, have experienced a significant downturn – shedding a staggering $3.5 trillion in value – Bitcoin has demonstrated a surprising degree of resilience, even posting gains in some instances. This nascent divergence has ignited a wave of optimism among Bitcoin proponents who have long yearned for the digital asset to be recognized and traded based on its own fundamental merits, rather than as a mere proxy for risk-on sentiment in the equity markets.
The concept of Bitcoin decoupling from traditional assets has been a recurring theme in the cryptocurrency space. The original thesis for Bitcoin, after all, positioned it as a decentralized, censorship-resistant store of value and a hedge against traditional financial system vulnerabilities. Its finite supply, its independence from central banks and government policies, and its inherent scarcity were touted as key differentiators that would eventually lead it to trade independently. However, the reality of the past few years has often painted a different picture, with institutional adoption bringing increased correlation with established asset classes.
The current shift, however tentative, offers a glimmer of hope for those who believe in Bitcoin’s unique value proposition. The factors contributing to the stock market slump – trade war anxieties, inflation fears, and the prospect of tighter monetary policy – arguably strengthen the case for Bitcoin as an alternative asset. In times of economic uncertainty and currency debasement concerns, the fixed supply and decentralized nature of Bitcoin could become increasingly attractive to investors seeking a safe haven outside the traditional financial system.
Furthermore, the increasing maturity of the Bitcoin market, with the development of more sophisticated trading instruments, greater institutional participation, and a deeper understanding of its underlying technology, may be contributing to its growing independence. As Bitcoin gains broader acceptance as a legitimate asset class, its price discovery mechanisms may become less reliant on the sentiment driving traditional equity markets.
However, it is crucial to approach this apparent decoupling with a degree of caution. While the recent divergence is encouraging for Bitcoin bulls, it is too early to definitively declare the long-awaited break has finally arrived. Market correlations can be fluid and influenced by a multitude of factors. A sudden shift in global risk sentiment or a significant negative event specific to the cryptocurrency space could easily re-establish the link between Bitcoin and traditional assets.
Adding a layer of complexity to the current narrative is the warning from some analysts regarding a potential Bitcoin price correction. Despite the recent resilience, multiple BTC price forecasting models have pointed towards a scenario where Bitcoin could fall back to its 2021 all-time high of around $70,000 in a relatively short timeframe – some even suggesting this could occur within the next ten days. This potential “crash risk,” as one analyst termed it, is attributed to various technical and market cycle indicators.
The notion that $70,000 could represent Bitcoin’s “practical bottom,” as suggested by some, highlights the inherent volatility and speculative nature of the cryptocurrency market. Even if Bitcoin is beginning to decouple from traditional equities, it remains susceptible to its own unique set of risks and price swings. Factors such as regulatory developments, network security concerns, and shifts in investor sentiment within the crypto space can still exert significant influence on its price.
Therefore, while the current divergence between Bitcoin and the struggling U.S. stock market offers a compelling narrative and fuels the hopes of long-term Bitcoin holders, it is essential to maintain a balanced perspective. The confluence of factors driving the stock market decline could indeed be creating an environment where Bitcoin’s unique characteristics become more appealing, leading to a sustained period of independent price action. However, the inherent volatility of the cryptocurrency market and the potential for a significant correction remind investors that the journey towards true decoupling is likely to be a complex and potentially bumpy one.
In conclusion, the recent market dynamics present a fascinating juncture for Bitcoin. The initial signs of decoupling from the crumbling U.S. stock market, driven by a confluence of macroeconomic anxieties and the potential for Bitcoin to act as an alternative store of value, are undeniably encouraging for those who believe in its long-term potential. However, the warnings of a potential price correction underscore the inherent risks within the cryptocurrency space. Whether this nascent decoupling marks a definitive shift in Bitcoin's market behavior or proves to be a temporary divergence remains to be seen. Investors would be wise to monitor these trends closely, remaining cognizant of both the potential for independent growth and the ever-present risks associated with this dynamic and evolving asset class. The coming weeks and months will be crucial in determining whether Bitcoin can truly forge its own path in the face of traditional market turmoil.
Btcusdanalysis


BTC(20250404) market analysis and operationTechnical analysis of BTC contract on April 4: Today, the large-cycle daily level closed with a small positive line yesterday, and the K-line pattern was a single negative and a single positive. The price was still at a low level. The fast and slow lines of the attached chart indicator were glued together and flattened, but it was obvious that the rising price was suppressed, and the pullback was not strong. On the contrary, there seemed to be more opportunities for decline. From the overall technical indicators, the decline in the big trend is still very obvious, so the idea remains unchanged and continue to sell; in the short cycle, the current price is still in a volatile trend. The four-hour chart has a single negative and a single positive, and the attached chart indicator is dead cross, but the strength has not come out. The hourly chart corrected the high point position of 84,000 after the sharp drop this week. The current attached chart indicator is golden cross running, and there is no room for rise or fall, so wait and see during the day, pay attention to the strength and weakness of the European market and the impact of the evening data

Bitcoin (BTC/USD) Trade Setup & Analysis🔹 Trend Analysis:
📉 The chart shows a downtrend followed by a reversal attempt.
📈 The price bounced off a support zone and is moving upwards.
🔹 Indicators:
📊 The 9-period DEMA (83,805.38) is slightly above the current price, acting as a resistance level.
🔹 Trade Setup:
🟢 Entry Zone: Around 82,943 (Current Price)
🔴 Stop-Loss: 81,183.22 ❌ (Below support level)
🎯 Target Point: 85,563.52 ✅ (Upper resistance level)
🔵 Strategy: The trade anticipates a price dip before

BTC/USDT Analysis – 30-Minute Chart (OKX)BTC/USDT Analysis – 30-Minute Chart (OKX)
Key Support Levels:
Immediate support: 82,596 USDT
Stronger support: 81,900 USDT (Potential entry point)
Stop-loss: Below 79,426 USDT (Risk management)
Key Resistance Levels:
First resistance: 84,326 USDT
Next resistance: 85,726 USDT (Major supply zone)
Higher targets: 87,702 – 88,547 USDT
Indicators & Market Structure:
BTC is testing a short-term support after a bearish move.
The Stochastic RSI shows an overbought condition, signaling a potential retracement.
The EMA 20, 50, 100, and 200 are showing mixed signals; BTC needs to break above EMA 100 to confirm bullish momentum.
The MACD histogram is showing early signs of bullish momentum.
Trade Plan:
Bullish case: If BTC holds 82,596 – 81,900 USDT, a reversal towards 84,326 – 85,726 USDT is possible.
Bearish case: If BTC drops below 81,900 USDT, further downside towards 79,426 USDT may happen.
📌 Summary:
BTC is at a crucial level, consolidating around support. If it holds above 82,596 USDT, we could see a bounce toward 85,726 USDT. However, a break below 81,900 USDT could trigger more downside. Monitor price action carefully before entering a position. 🚀

ETH/USDT:UPDATEHello dear friends
Given the price drop we had, a head and shoulders pattern has formed within the specified support range, indicating the entry of buyers.
Now, given the good support of buyers for the price, we can buy in steps with capital and risk management and move towards the specified targets.
*Trade safely with us*

Navigating BTC Volatility Storm: Buy, Hold, or Flee?Bitcoin's recent price action has been reminiscent of a rollercoaster, leaving investors grappling with a whirlwind of conflicting signals. From sharp drops mirroring stock market turmoil to the looming "death cross," the cryptocurrency's trajectory is shrouded in uncertainty. Is this a prime buying opportunity, a warning to retreat, or simply another bout of the volatility that defines Bitcoin?
The past few days have been a stark reminder of Bitcoin's inherent volatility. Reports of an 8% drop, coupled with the US stock market shedding $2 trillion in value, sent ripples through the crypto sphere. The catalyst? Concerns surrounding potential US tariffs and their impact on the global economic outlook. This sudden shift in market sentiment triggered a sell-off, reminiscent of the COVID-19 crash in 2020, during which Bitcoin’s pre-pandemic gains evaporated.
Adding to the unease is the looming "death cross," a technical indicator that occurs when the 50-day moving average crosses below the 200-day moving average. Historically, this pattern has signaled bearish momentum. The 2022 death cross, for example, precipitated a significant price drop of nearly 20%. Conversely, "golden crosses," where the 50-day moving average crosses above the 200-day moving average, have historically signaled bullish momentum, triggering rallies of over 500% in 2020 and 2021.
Currently, Bitcoin's 50-day moving average is edging closer to this critical crossover, prompting widespread speculation. Is this a repeat of 2022, or will the market defy historical patterns? The answer, as always, is complex and contingent on a confluence of factors.
One significant factor is the strength of the US dollar. While the dollar's strength can often negatively impact Bitcoin, the current increase in the money supply could potentially counteract this effect, creating a bullish flag pattern. The dollar's inflation may become a catalyst for Bitcoin as a store of value. The global market dynamics are currently shrouded in uncertainty, making it difficult to predict the long-term impact of these factors.
The recent price drops have pushed Bitcoin towards the $80,000 mark, with some analysts predicting a potential fall to $71,000. However, this level could also represent a "sizeable bounce," acting as a strong support zone for Bitcoin. The concept of an "oversold bounce" also comes into play. After a period of intense selling pressure, markets often experience a relief rally as traders capitalize on discounted prices. Whether this materializes remains to be seen.
Is it a Good Time to Buy Bitcoin?
The decision to buy, hold, or sell Bitcoin depends on an individual's risk tolerance, investment strategy, and understanding of the market. Here's a breakdown to consider:
• For the Long-Term Investor:
o Bitcoin's long-term potential remains a compelling narrative. Its decentralized nature, limited supply, and growing adoption continue to attract institutional and retail investors.
o Price volatility is an inherent part of the Bitcoin journey. Historically, periods of sharp declines have been followed by significant rallies.
o Dollar-cost averaging (DCA) can mitigate the impact of volatility by investing a fixed amount at regular intervals, regardless of the price.1
o The strength of the US dollar may become a catalyst for Bitcoin as a store of value.
• For the Short-Term Trader:
o The current volatility presents opportunities for skilled traders to profit from price swings.
o Technical analysis, including monitoring moving averages and support/resistance levels, is crucial for identifying potential entry and exit points.
o However, short-term trading is inherently risky and requires a deep understanding of market dynamics.
o The "death cross" should be monitored carefully.
• For the Cautious Investor:
o The current market uncertainty may warrant a more conservative approach.
o Diversifying investments across different asset classes can help mitigate risk.
o Staying informed about market developments and avoiding emotional trading decisions is essential.
The Death Cross: A Warning or a False Alarm?
The "death cross" is a significant technical indicator, but it's not a foolproof predictor of future price action. Historical data show that while it can signal bearish trends, it's not always accurate. Market conditions, investor sentiment, and macroeconomic factors can all influence Bitcoin's trajectory.
Ultimately, the Bitcoin market remains highly speculative. The current volatility, driven by a confluence of factors, underscores the importance of careful research, risk management, and a long-term perspective. While the "death cross" and market fluctuations may cause short-term panic, the long-term potential of bitcoin, and it's reaction to the weakening dollar, may still produce long-term gains.

BTC SHORT TP:79,700 02-03-2025Bitcoin is currently displaying a bearish pattern on the 1-hour timeframe, suggesting a continuation of the downward momentum. The projected take profit (TP) for this setup is targeting the 79,500 - 80,000 price zone.
The analysis is based on the lower 1-hour timeframe, which means that if the expected move does not materialize within the next 13 to 19 hours, the trade setup will be considered invalid.
In this case, you could consider opening a short position now and potentially averaging down your entry as the trade progresses. This is a strategy I often employ to maximize profits.
Make sure to follow me closely, as I will keep you updated on the developments and help you generate substantial green profits together.

BTC/USDT 4H Chart Analysis 🚀 BTC/USDT 4H Chart Analysis 🏆
🔍 Market Overview:
Bitcoin (BTC/USDT) is currently testing a key support zone. A confirmed breakdown could open the doors for a bearish move, while a bounce could lead to a recovery attempt.
📌 Key Observations:
🔶 Important Resistance (🟠 82,743.59 USDT)
🚧 This level has acted as a strong resistance zone. A breakout above this could trigger bullish momentum.
🔵 Crucial Support (81,633.22 USDT)
🛡️ Holding above this level is important for buyers to prevent further downside.
❌ If BTC confirms a close below this support, it could signal a continuation of the downtrend.
📊 Moving Averages (7, 25, 99 SMA):
🟡 Short-Term SMA (7): Price is testing this moving average.
🔵 Medium-Term SMA (25): Turning into potential resistance.
🟢 Long-Term SMA (99): Still bullish but flattening out.
⚡ Trade Triggers:
✅ Long Trigger (📈💰) - If BTC breaks above 82,743.59 USDT with volume → 🚀 Buy opportunity!
❌ Short Trigger (📉🔻) - If BTC closes below 81,633.22 USDT, it confirms a bearish breakdown → 🏴☠️ Short setup active!
📢 Trading Strategy:
💎 Bullish Plan: Wait for a breakout above 82,743.59 USDT with strong volume → 🎯 Target: 83,500+ USDT.
⚠️ Bearish Plan: If BTC breaks below 81,633.22 USDT, expect a drop towards 79,986.83 USDT, with a final target at 78,445.12 USDT.
🔥 Final Thoughts:
Bitcoin is at a decision point! 🎯 A breakout could push BTC higher, while a breakdown signals deeper corrections.
📢 Watch volume for confirmation before taking a position! 🚀
🔔 Stay Alert & Manage Risk! 🎯

BTC/USDTBTC bottom is either in or very close based on Etf inflows.
tariff fuds,the 200-day ema,rsi,funding rateand a major trendline.

Bitcoin (BTC/USD) Rectangle Pattern Breakdown – Bearish Move1. Overview of the Chart & Market Context
The chart provided represents Bitcoin (BTC/USD) on the 1-hour timeframe, published on TradingView. This analysis highlights the rectangle pattern formation, key support and resistance levels, and a potential short trade setup with defined risk management.
The market structure suggests a bearish outlook, as Bitcoin attempted to break above a resistance level but failed, leading to a sharp decline. The price action now indicates further downside movement, aligning with a rectangle pattern breakdown.
2. Rectangle Pattern Formation
What is a Rectangle Pattern?
A rectangle pattern is a consolidation phase where price moves sideways within a defined range, forming multiple touches at resistance and support before a breakout occurs. It can serve as a continuation or reversal pattern, depending on the breakout direction.
In this case, the pattern has resulted in a bearish breakout, indicating that sellers have taken control of the market.
Key Characteristics of This Rectangle Pattern:
The upper boundary (resistance) is at 88,333 USD, where price repeatedly failed to break higher.
The lower boundary (support) is at 78,044 USD, which acted as a strong floor but is now under pressure.
The price moved within this range for an extended period, showing a balanced battle between buyers and sellers.
A failed breakout at resistance, followed by a sharp rejection, signals a bearish reversal.
3. Breakdown of Key Levels & Market Structure
A. Resistance Level – 88,333 USD
This level has been tested multiple times, but price failed to hold above it.
The recent failed breakout led to a strong bearish rejection, confirming resistance.
The price action formed a bearish engulfing candlestick, adding to the bearish bias.
B. Support Level – 78,044 USD
This zone has previously provided multiple bounces, showing strong buying interest.
However, with the recent break below this level, it may now act as resistance.
If the price retests this area and fails to break above, it confirms a bearish continuation.
C. Price Rejection and Market Structure Shift
The formation of lower highs and lower lows signals a transition from consolidation to a downtrend.
The price broke out of the rectangle pattern to the downside, confirming a bearish breakout.
If the support at 78,044 USD fails, the price may continue dropping toward 73,678 USD.
4. Trade Setup & Execution Plan
🔹 Entry Strategy
A short position is initiated after the bearish rejection at resistance (88,333 USD).
The breakdown of the rectangle pattern strengthens the short setup.
The price may briefly retest the broken support (78,044 USD) before continuing downward.
🔹 Stop-Loss Placement
The stop-loss (SL) is placed above 88,333 USD, ensuring that if price moves against the trade, risk is minimized.
This protects against any unexpected bullish reversal.
🔹 Profit Targets (Take Profit - TP)
TP1: 78,044 USD (previous support level) – A conservative target.
TP2: 73,678 USD (deeper support) – If bearish momentum continues, this is the extended target.
Trade Component Details
Entry Short after rejection at 88,333 USD
Stop-Loss (SL) Above 88,333 USD
Take Profit 1 (TP1) 78,044 USD
Take Profit 2 (TP2) 73,678 USD
Confirmation Breakout & retest of support
Risk-Reward Ratio Favorable (defined SL & TP)
5. Expected Price Action and Market Behavior
🔻 Bearish Scenario (Most Likely Outcome)
The price will continue to fall towards TP1 (78,044 USD) due to selling pressure.
If 78,044 USD fails to hold, Bitcoin is likely to test the next major support level (73,678 USD).
The structure of lower highs and lower lows supports the downtrend.
🔺 Bullish Scenario (Invalidation of the Short Setup)
If Bitcoin breaks above 88,333 USD, the bearish outlook is invalidated.
This could signal a potential trend reversal or bullish breakout.
6. Technical Indicators Supporting the Analysis
Several technical indicators can be used to confirm the bearish outlook:
📉 RSI (Relative Strength Index):
If RSI is below 50, it confirms bearish momentum.
If RSI is oversold (<30), a temporary bounce may occur.
📉 Moving Averages:
If the 50-period MA crosses below the 200-period MA, it confirms a bearish trend.
If price is below both MAs, it strengthens the bearish setup.
📉 Volume Analysis:
A high selling volume during the breakdown indicates strong bearish conviction.
If volume spikes near support levels, a potential bounce could happen.
7. Summary of Key Findings
Pattern Identified: Rectangle pattern with a bearish breakout.
Market Structure: Price formed lower highs and lower lows, signaling a downtrend.
Trade Setup:
Short trade after rejection at 88,333 USD.
Stop-loss above 88,333 USD to manage risk.
Profit targets at 78,044 USD (TP1) and 73,678 USD (TP2).
Risk Management:
Clear stop-loss and take-profit levels ensure a controlled risk-to-reward ratio.
If price moves against the trade, the stop-loss prevents excessive losses.
Technical Indicators:
RSI, Moving Averages, and Volume Analysis confirm the bearish outlook.
8. Final Thoughts & Trading Plan Implementation
This analysis presents a high-probability bearish trade setup using the rectangle pattern breakdown strategy. With proper risk management, traders can execute this short trade with a structured plan.
🔹 Actionable Trading Plan:
Wait for price confirmation – If BTC retests the broken support (78,044 USD) and rejects, this strengthens the trade idea.
Execute the short trade – Once confirmation occurs, enter a short position.
Manage risk appropriately – Stick to the stop-loss above 88,333 USD.
Monitor price action – Adjust take-profit levels based on momentum and support breaks.
If the price invalidates the setup by breaking above resistance, it is crucial to exit the trade and re-evaluate the market conditions.
Conclusion:
This Bitcoin (BTC/USD) rectangle pattern breakdown analysis provides a clear bearish trade setup, supported by market structure, technical indicators, and price action. The well-defined entry, stop-loss, and take-profit levels ensure a structured risk-reward ratio, making this a viable short trade opportunity.

Bitcoin heading to $72.000We see a distribution model with what seems a confirmed third tap. We want to look for the latest supply zone for a short entry.
The only problem we have is that we have strong supply above the range so we might go for another fakeout before we dump so keep that in mind.

BTCUSD: Ready to Soar or Collapse?Hi Traders ! Possible Entries in BTCUSD (1H):
✅ Buy: If the price bounces off the lower line of the smaller ascending channel and breaks above 85,000 with volume. Additional confirmation if the RSI recovers above 60.
❌ Sell: If the price breaks down the smaller ascending channel, especially if it falls below 84,800. Extra confirmation if the RSI crosses below 50.
📢 Disclaimer: Not financial advice. Manage your risk properly.

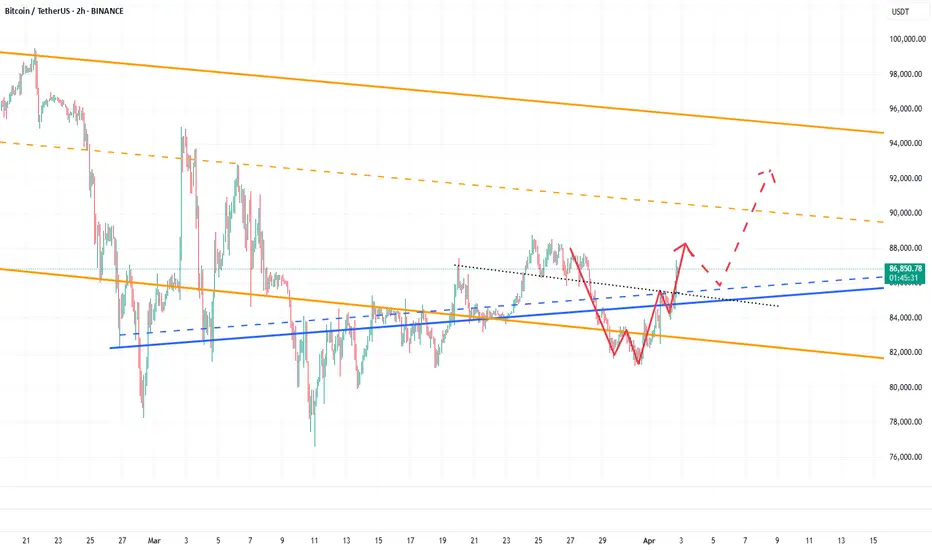
BTC already has the conditions to hit the 90000-95000 zone!A few days ago, I mentioned that BTC had the potential to surge towards the 90000-95000 range. Currently, BTC has already climbed above 87000 during its rebound, effectively opening the door to the 90000-95000 zone.
From a fundamental perspective, with bearish factors becoming clearer, if Trump adopts a more lenient stance on tariffs, BTC could extend its rebound. On the technical side, BTC has successfully broken through the short-term resistance around the 85500 level, turning the 85500-84500 area into a short-term support structure. This transition further supports BTC’s continuation to the upside, potentially testing the 90000-95000 range.
For short-term trading, we can consider waiting for a technical pullback and looking to go long on BTC once it retraces to the 85500-85000 region. The trading strategy verification accuracy rate is more than 90%; one step ahead, exclusive access to trading strategies and real-time trading settings
Bullish Breakout from Falling Wedge | Upside Potential Ahead!Market Overview:
The Bitcoin (BTC/USD) 4-hour chart is displaying a Falling Wedge pattern, a well-known bullish reversal structure. This indicates that the downtrend is weakening, and a potential breakout could lead to a strong upside move.
🔹 Key Technical Analysis
1️⃣ Falling Wedge Formation & Breakout
Bitcoin has been trading inside a falling wedge, marked by lower highs and lower lows, signaling a contraction in volatility.
A breakout above the upper trendline of the wedge is forming, suggesting a bullish reversal and the start of an uptrend.
Falling wedges typically lead to a rally equal to the height of the pattern, giving a measured move target of $114,334.
2️⃣ Price Action & Confirmation Levels
A clean breakout above $87,000 would confirm bullish momentum.
If price successfully retests the wedge’s upper boundary and holds support, further bullish continuation is expected.
The psychological level of $100,000 could act as an interim resistance before the final target is reached.
3️⃣ Upside Target & Resistance Zones
The measured move suggests a potential rally towards $114,334, aligning with previous resistance zones.
This target represents a 30.55% gain from the breakout level.
Traders should watch for pullbacks and retests as part of the breakout confirmation.
📈 Trading Plan - Long Setup
🔹 Entry: Look for a confirmed breakout above $87,000, or a retest of support.
🔹 Stop Loss: Below $84,000, protecting against false breakouts.
🔹 Take Profit: $100,000 - $114,334 (previous resistance & measured move target).
🔹 Risk-Reward Ratio: Strong bullish setup with favorable upside potential.
🛑 Risk Factors to Consider
⚠️ A failed breakout and a drop below $83,000 would invalidate the bullish setup.
⚠️ External factors such as macroeconomic events, regulatory news, and BTC ETF developments could influence volatility.
Final Thought
The breakout from the falling wedge signals a potential bullish continuation for Bitcoin, with targets set around $114,334. Traders should watch for confirmation above $87,000 and manage risk accordingly.

Can it hit 89,000 again?The price trend of BTC has once again become the focus of global investors' attention.
Previously, BTC experienced a period of consolidation, during which the bulls and bears engaged in repeated games. Now, the bulls of BTC have risen strongly, unleashing powerful upward momentum.
With a swift and fierce move, it has broken through the key resistance level of 85,000 at one stroke. This breakthrough is like a fuse igniting the market, and the upward trend has spread rapidly. It is expected that it will further challenge the range of 87,000-89,000 in the future.
The market has been extremely volatile lately. If you can't figure out the market's direction, you'll only be a cash dispenser for others. If you also want to succeed,Follow the link below to get my daily strategy updates

The Coming Bitcoin Death CrossThe Bitcoin daily price chart will likely show a death cross within the next week. In the above chart, I have extended both the 50-day and 200-day SMAs based on their current trajectory. The result shows that they will intersect on or around the 7th of April.
Even though the death cross seems inevitable, does that necessarily mean that the bullish phase of this market cycle is over? In my opinion, it is still a little too early to make that call. We only have to look back at the previous market cycle for an example where a death cross didn't lead to the death of the market cycle.
Looking at the chart above, we can see that Bitcoin experienced a death cross following the first peak in April 2021. About three months later, a golden cross formed, which led to the final market cycle peak in November 2021. We can also see that in this current market cycle, there have been two other instances where death crosses have occurred. Both were followed two to three months later by golden crosses, which ended consolidation phases and led to substantial price increases over the following months.
As I see it, there are now two possible scenarios for this market cycle.
The first is that Bitcoin's price peak on January 20th was the market cycle peak, and Bitcoin is now in the bear market phase of this market cycle.
The second scenario is that the peak for this market cycle has not yet occurred, and we will we will see a similar outcome as the two previous death cross-golden cross occurrences earlier in this market cycle.
I am also still watching the Stochastic RSI indicator on the monthly chart. What I have noticed is that when the Stochastic RSI reading has dropped substantially below the "20" level, that has signaled that the previous price peak was the peak of that market cycle.
Looking at this chart, we can see that the Stochastic RSI is currently at 11.31 however, this can change. If the price of BTC can substantially increase over the next few weeks, it is possible that when April's monthly candle closes, the Stochastic RSI reading could be back over the "20" level.
If, however, the Stochastic RSI reading is substantially below the "20" level when the April candle closes, then based on previous history, I would have to conclude that Bitcoin's price peak on January 20th was the market cycle peak.
I am trying to remain hopeful that the bullish phase of this market cycle will resume at some point while still keeping an open mind to other possibilities.
What are your thoughts? Do you agree, or is my analysis flawed?

BTC/USD Bullish Breakout from Rectangle PatternOverview:
The chart represents Bitcoin's price action against the US Dollar on the 1-hour timeframe, highlighting a Rectangle Pattern Breakout with a well-structured trade setup. This analysis will break down the pattern, key levels, and possible trading scenarios.
1️⃣ Chart Pattern Breakdown – Rectangle Consolidation
The price has been moving within a rectangle pattern (range-bound movement), where Bitcoin found support at lower levels and faced resistance at the upper boundary.
Rectangle Pattern: A continuation/consolidation pattern where price fluctuates between horizontal resistance and support before breaking out.
Curve Formation: The price action within the rectangle also forms a rounding bottom, indicating a potential shift from bearish to bullish sentiment.
Breakout Confirmation: BTC has broken out from the rectangle, suggesting bullish momentum.
2️⃣ Key Technical Levels
🔹 Support Level ($84,110)
This zone has acted as a strong demand area, preventing the price from falling further.
Buyers consistently stepped in at this level, making it a significant psychological floor for Bitcoin.
🔹 Resistance Level ($86,850 - $87,000 Zone)
This level had previously rejected upward movements, leading to multiple price pullbacks.
After the breakout, this area is expected to act as a new support level upon a retest.
🔹 Target Price ($89,931 – Next Resistance Zone)
If the breakout sustains, the next key target for bulls is around $89,931, based on prior resistance zones and technical projections.
🔹 Stop Loss ($84,110 – Below Support Zone)
A stop loss below the support zone ensures risk management in case of a false breakout.
3️⃣ Trading Strategy & Execution
📌 Entry Point – After price confirms the breakout above the rectangle’s resistance. Traders should wait for:
A pullback and retest of the broken resistance, which should now act as support.
A strong bullish candle confirming continuation.
📌 Take Profit (TP) – $89,931, based on historical resistance levels and price projection from the rectangle range.
📌 Stop Loss (SL) – Placed at $84,110, below the rectangle’s previous support zone to minimize downside risk.
📌 Risk-to-Reward Ratio (RRR) – The setup offers a favorable RRR, meaning potential profits outweigh the risks.
4️⃣ Market Sentiment & Additional Factors
✔ Bullish Outlook – The breakout signals strong buying interest and potential upside continuation.
✔ Volume Confirmation – Traders should monitor volume spikes during the breakout to confirm institutional participation.
✔ Economic Events & News – External factors like macroeconomic data or Bitcoin-related news can impact price action.
Conclusion – BTC/USD Trading Setup
Pattern Identified: Rectangle Pattern Breakout
Current Trend: Bullish breakout from consolidation
Trade Type: Long position (Buy setup)
Key Levels:
✅ Support: $84,110
✅ Resistance: $86,850 - $87,000
✅ Target: $89,931
✅ Stop Loss: $84,110
🔥 Final Thought : Bitcoin has broken out of a key consolidation range, signaling a bullish move towards $89,931. Traders should wait for confirmation and manage risk accordingly! 🚀📈

Bitcoin Analysis: Potential Path to $150K and Market TrendsCurrent Price & Key Levels
- BTC/USDT Price: BINANCE:BTCUSDT (as per chart).
- Critical Support: Bottom of the ascending channel .
- Key Resistance: Upper trendline of the channel (to be confirmed).
Technical Signals
1. Ascending Channel:
- Price is at the bottom of the channel, historically a bounce zone.
- A break above the upper trendline could signal a bullish continuation.
2. Moving Averages:
- SMA 200 (4H) and SMA 20 (1D) are critical for trend confirmation.
- A bullish crossover (e.g., SMA 20 > SMA 200) would strengthen the buy signal.
3. Dominance (BTC.D):
- If Bitcoin dominance turns bearish, expect capital rotation into altcoins (altseason potential).
- Monitor dominance alongside price action for market shifts.
$150K Target: When and How?
- Scenario 1:
- A strong breakout from the ascending channel + rising volume → Acceleration toward $150K.
- Timeline:Mid-2025/Late-2025 (historically aligns with post-halving cycles).
- Scenario 2:
- Slow grind upward with corrections → $150K likely by 2026, pending macroeconomic stability (e.g., ETF inflows, regulatory clarity).
Altcoin Season Watch
- Trigger:
- If Bitcoin’s dominance drops below 57%, altcoins may surge.
- Focus on high-cap alts (ETH, SOL) and narratives like AI, DePIN, or RWA.
Trade Strategy
- Entry:
- Buy on confirmed breakout above the channel + SMA crossover.
- Stop Loss:
- Below the channel’s lower trendline (e.g., $80,000).
- Take Profit:
- targets: $100,000.120,000
- Final target: $150,000 (scale out profits).
Risks to Monitor
- Macro Factors: Fed rate decisions, geopolitical tensions.
- Bitcoin ETF Flows: Sustained inflows/outflows impact momentum.
- Regulation: Crackdowns or approvals (e.g., ETH ETF).
---
Conclusion
- Bullish Outlook: $150K is achievable if Bitcoin holds the ascending channel and dominance remains stable.
- Altseason Hedge: Prepare a basket of altcoins if BTC.D trends downward.
Like, comment, and follow for updates! 🚀

BTC-----More around 83300, target 85000 areaTechnical analysis of BTC contract on April 2: Today, the large-cycle daily level closed with a small positive line yesterday, and the K-line pattern was a single positive line with continuous negatives. The price was at a low level, and the attached indicator was a golden cross with a shrinking volume. In the big trend, the decline was very obvious, and the pullback was difficult to continue. The probability of breaking the previous high point was even smaller. Instead, it was easy to fall under pressure and break the low. This is the trend law, not speculation; the four-hour chart showed a pullback trend for two consecutive trading days. The K-line rose and fell after a continuous positive yesterday. The current K-line pattern was a continuous negative. From the technical indicators, the current correction will enter the second stage of the downward trend. The short-cycle hourly chart yesterday's US market rose to a high in the early morning and continued to fall in the morning. The current K-line pattern was a continuous negative, and the attached indicator was a dead cross. Then there is a high probability of falling during the day, depending on the strength and the breakout of the European market.
Today's BTC short-term contract trading strategy: Sell at the 85,000 area of the pullback, stop loss at the 85,500 area, and target the 84,000-83,500 area;

Déjà Vu, BTC's Historical Pattern EncoreIt is possible the pattern that shaped in late 2020 and 2021 might repeat again.
Everything just looks like the previous main high which is selected with the red square in the left of chart.
There is no guarantee even if it happens - movement and ratios of movement can be different.
Déjà vu on the charts isn't by chance.

Bitcoin (BTC/USD) Price Analysis: Bearish Breakdown Ahead?🔥 Bitcoin (BTC/USD) 1-Hour Chart Analysis 🔥
🔹 Trend Analysis:
🟡 Price was moving in an ascending channel 📈 but has broken below the trendline.
🟠 A retest of the broken trendline is happening, suggesting a potential drop 📉.
🔹 Trade Setup:
🔽 Short Entry: Expected rejection from the trendline.
❌ Stop Loss: $85,671 - $85,710 (Above resistance).
✅ Take Profit Target: $81,386 - $81,347 (Bearish target 🎯).
🔹 Indicators & Confirmation:
📊 EMA (9) at $84,254 → Acting as resistance 🚧.
🔄 Break & Retest Pattern → Typical for a bearish continuation 🛑📉.
🔹 Conclusion:
⚠️ Bearish Bias: If the price rejects the trendline, it could drop towards $81,386 🎯.
🚨 Invalidation: If the price breaks above $85,710, the short setup is canceled ❌.

BTC/USDT 15-Minute Chart Analysis🚀 BTC/USDT 15-Minute Chart Analysis 🏆
🔍 Market Overview:
The chart shows Bitcoin (BTC/USDT) price action on a 15-minute timeframe with key resistance & support levels, along with potential trade triggers.
📌 Key Observations:
📈 Strong Resistance (🚧 85,339.85 USDT)
🔥 Major hurdle for buyers! A breakout above this could ignite a rally.
🚀 If BTC closes above this level with volume, we might see a strong uptrend.
🛑 Important Support (🔵 84,727.22 - 84,912.40 USDT)
🛡️ Holding this zone is crucial for bulls to maintain momentum.
❌ Losing this support could trigger a bearish move.
📊 Moving Averages (7, 25, 99 SMA):
🟡 Short-Term SMA (7): Price is testing this moving average.
🔵 Medium-Term SMA (25): Acting as dynamic support.
🟢 Long-Term SMA (99): Still bullish, showing an uptrend bias.
⚡ Trade Triggers:
✅ Long Trigger (📈💰) - If BTC breaks 85,339.85 USDT with volume → 🚀 BUY Opportunity!
❌ Short Trigger (📉🔻) - If BTC drops below 84,727.22 USDT → 🏴☠️ Short setup possible!
📢 Trading Strategy:
💎 Bullish Plan: Watch for a breakout above 85,339.85 USDT with strong volume → 🎯 Targets: 85,500+ USDT.
⚠️ Bearish Plan: If BTC breaks below 84,727.22 USDT, look for a drop to 84,498.52 USDT or lower.
🔥 Final Thoughts:
Bitcoin is in a critical decision zone! 🎯 Breakout = Bullish Rally! ❌ Breakdown = Bearish Move!
📢 Stay Alert! Volume Confirmation is Key! 🎯
