Bitcoin at a Critical Juncture – Breakout or Breakdown? 📉 BTC is at a key decision point! After pulling back from recent highs, it's now consolidating within a range, sitting right in the middle of the previous price swing. I'm keeping a close eye on this zone—if price breaks out, a high-probability trade opportunity could emerge.
🎯 In this video, we dive deep into price action and market structure, breaking down a potential trade setup—if the market aligns with our strategy.
🚨 Trade smart, manage risk—this isn’t financial advice! 🚀🔥
Btcusdanalysis

BTCUSD BUY NEXT MOVE 1. Bearish Reversal Scenario:
Alternative Outlook: Instead of continuing upward to the next target, Bitcoin may fail to breach the resistance and reverse downward due to a potential "bull trap."
Trigger: A rejection at or near the double-top resistance around $88,000 could initiate a sell-off toward the trendline support near $85,000 or lower.
Bearish Volume Confirmation: If there is a significant bearish divergence on indicators like RSI or MACD, it could confirm the weakening bullish momentum.
2. Range-Bound Consolidation:
Alternative Setup: BTC might get stuck in a sideways consolidation range between $85,000 (support) and $88,000 (resistance), reflecting indecision in the market.
Trigger: This could be driven by mixed macro signals (like interest rate policies, crypto market sentiment) and lack of volume to push the price strongly in either direction.
3. False Breakout (Bull Trap):
Alternative Bearish Scenario: If BTC spikes slightly above the double-top resistance (around $88,000) but fails to hold the breakout level, it could trap late buyers and drop quickly.
Trigger: A false breakout pattern often occurs with low volume on the breakout attempt followed by a sharp reversal.
Potential Drop Target: BTC may then fall toward $83,000 or even retest $82,000 as deeper support

A Good Example of How Market Makers Manipulate BTC Price- As liquidation areas are visited, price drops back down, retraces back up just to fill the price imbalance before continuing to for a new low.
- The latest price action is similar to the previous, and there is a very good likelihood that the Bitcoin price will create another major new low
- Also take note of the fake out in the ascending channel to trap traders into placing long positions. The fake out was also able to trigger stop losses from short positions.
Let me know what you guys think and comment below.

BTC/USD Trading Analysis – Double Bottom & Rising Wedge BreakoutThis BTC/USD 4-hour chart showcases a potential bullish breakout setup based on technical patterns, key support and resistance levels, and price action analysis. The chart suggests a trend reversal following a downtrend, with signs of bullish momentum building up.
Let's break down the full technical analysis, covering the chart structure, key levels, price patterns, and trading strategy.
1. Market Structure & Identified Patterns
A. Double Bottom Reversal – Strong Bullish Signal
A double bottom pattern has formed, which is a bullish reversal signal that indicates the end of a downtrend.
This pattern consists of two significant low points (Bottom 1 and Bottom 2) near the $80,000 - $81,000 support zone.
The pattern confirms strong buying interest at this level, preventing further price drops.
A breakout above the resistance level would confirm the pattern’s validity, signaling a move toward higher targets.
B. Rising Wedge Formation – Potential Bullish Breakout
The price action is consolidating in a rising wedge, forming higher highs and higher lows within a narrowing range.
A rising wedge often suggests a potential breakout.
Since this wedge forms after a double bottom, the breakout is expected to be bullish, rather than a bearish breakdown.
If the price breaks above the wedge’s upper trendline, it will confirm a strong upward momentum.
2. Key Support & Resistance Levels
Support Levels:
Major Support Zone (80,000 – 81,000):
This level has been tested twice, confirming buyer strength.
It serves as the foundation for the double bottom pattern.
Stop Loss Level (72,921):
If the price drops below this level, it would invalidate the bullish setup.
This level is strategically placed to manage risk and protect against potential downturns.
Resistance Levels:
First Resistance Zone (95,000 – 100,000):
This is a critical level, as the price has faced multiple rejections here.
A breakout above this zone would confirm a strong bullish trend continuation.
Take Profit Targets:
TP1 (108,481): The first take-profit target aligns with previous highs and is a logical point for partial profit booking.
TP2 (114,372): This is the second profit target, calculated based on Fibonacci extensions and historical price movements.
3. Trading Strategy & Execution Plan
A. Entry Strategy
To execute a successful trade, we need to wait for confirmation of the breakout.
Ideal Entry: After a strong breakout above 95,000 – 100,000, indicating bullish momentum.
Confirmation Factors:
Increased trading volume → Signals strong buying interest.
Candle close above resistance → Confirms breakout.
Retest of broken resistance as support → Strengthens bullish continuation.
B. Risk Management
Stop Loss Placement: Below 72,921, ensuring limited downside risk.
Risk-to-Reward Ratio: The trade setup aims for a 1:3 or better risk-to-reward ratio.
C. Potential Scenarios
✅ Bullish Breakout:
If BTC breaks and holds above 95,000 – 100,000, we can expect a rally toward 108,481 (TP1) and 114,372 (TP2).
❌ Bearish Rejection:
If BTC fails to break resistance, it could retest 80,000 or drop lower, invalidating the bullish setup.
4. Final Thoughts – What to Expect?
This BTC/USD 4-hour chart analysis provides a high-probability bullish trade setup, supported by:
✅ Double Bottom Formation → Strong Reversal Signal
✅ Rising Wedge Breakout Potential → Momentum Building
✅ Key Resistance Breakout Levels Identified
📌 Conclusion:
If Bitcoin breaks above 95,000 – 100,000, expect a major bullish move toward 108,481 and beyond. However, if resistance holds, we might see a retest of lower support levels. Risk management is essential for a successful trade execution. 🚀

$BTC to the MoonFor BTC, we are still sticking to our "to the moon" analysis 🚀 hehehe. We remain in a trade with the following parameters:
Entry: 81,758
Stop Loss: 79,901
Target: 109,390
This is our trade operation, but we have also increased our hold position at this entry point, aiming for the very long term. Currently, our average price is 42,350.
What reinforces our analysis?
By analyzing the daily and H4 time frames, we can observe:
✅ Bullish continuation purges
✅ SMT (Smart Money Theory) confirming the movement
✅ A shift in the state of price delivery
With that in mind, I remain bullish, and may the moon be just the first target! Let's go, BTC! 🚀

BITCOIN HAS TO BREAK LONG TERM TREND by DEC - SQUEEZE APEX DECI have posted this before and I post it again now, just months away from a CRUCIAL point for Bitcoin PA
As with any time scale trading chart, An Apex is a point of reaction. PA usualy reacts BEFORE the Apex is met.
This Giant Apex is in DEC 2025
Every single ATH in the life span of Bitcoin has been rejected by the Arc of Resistance that is overhead.
We can also see how from the ATH in 2011, a trend line was formed that has acted as Support ever since 2012. PA has never dropped below this line.
So, as you can see, PA has been in a diminishing "Sandwich" and Now, we are coming to the Crunch
We can see how the ATH's have been a reducing % Rise ever since this point also.
And you will notice how this number on the chart reduces each time, even though the real value is increasing.
Low to ATH A ( ATH 2011) - 3,465,178%
Low to ATH B ( ATH 2013) - 49,670 %
Low to ATH C ( ATH 2017) - 9,865 %
Low to ATH D ( ATH 2021) - 2,148 %
E is not over yet but coing on current ATH we have
Low to ATH E ( ATH 2025) - 575 %
So, you see the reduction of % rise, held back all along by the ARC Of RESISTANCE
What is interesting, is that since PA has been in the chanel formed in 2011, when comapred to each other, we have been seeing a rise of 20% of the previous rise ( on average )
This closer chart shows you this in more detail
I will ignoew the A - B as thia is out of channel
C-B = 19.6 %
D-C = 21.77 %
Currently E-D = 26.7 %
As you can see, we are currently OVER that average % Rise.
And we are also heading into a tight APEX in Dec.
The expected 200K ATH this cycle will take us out of the pattern, out of the Apex and out of the 20 % average rise of previousl
This really is CRUNCH TIME for Bitcoin
The REALLY interesting thing is, What would be Next ?
This would break the Cycle routine.
We may already have broken that as described in previous charts of mine from years ago
But what IS Certain is that something HAS to happen.
This Cycle ATH will reveal a HUGE amount but we have yto Wait and see what will happen

BTC You'll regret it if you don'tBTC has been floating at 84000 today, yesterday it touched resistance at 87000, today's resistance is still valid, with the Fed's information, gold's rally has been full down, and more people will pay attention to BTC next
💎💎💎 BTC 💎💎💎
🎁 Buy@83500 - 84000
🎁 TP 86000 - 87000
The market has been extremely volatile lately. If you can't figure out the market's direction, you'll only be a cash dispenser for others. If you also want to succeed,Follow the link below to get my daily strategy updates

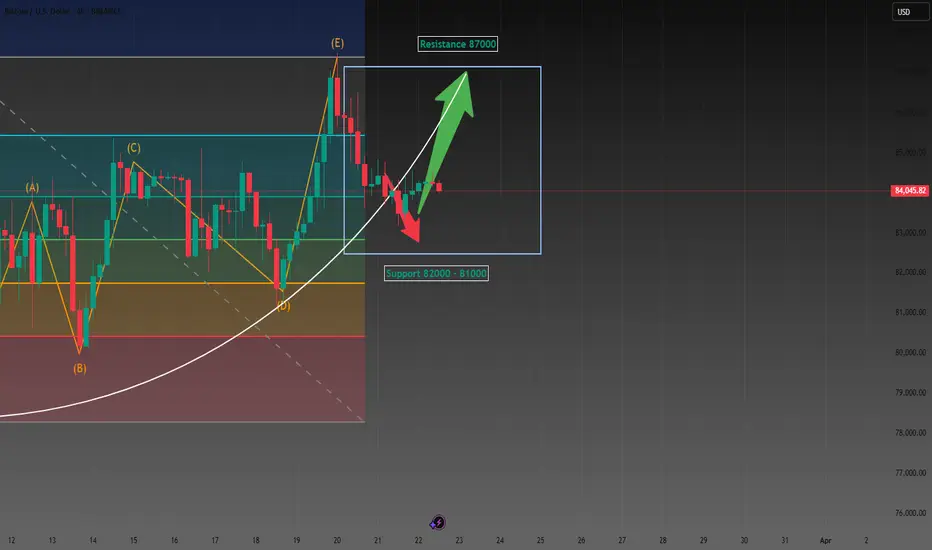
Bitcoin Market Analysis: Bullish OutlookCurrently, BTC price hovers around 84,000, showing a clear consolidation. In recent trading, bulls and bears are in a tight tussle at this price range.
Support Level Analysis
I peg the support at 81,000 - 82,000. Technically, this range is significant. Historical data indicates that as the price approaches this area, strong buying momentum emerges. During previous market corrections, this price band effectively halted sharp downward trends. Moreover, the concentrated distribution of holdings within this range implies that numerous investors have cost - bases here. Their unwillingness to see the price drop below their investment costs acts as a buffer, propping up the support.
Resistance Level Analysis
The resistance stays at 87,000. K - line trends reveal intense selling pressure when price approaches this mark. Multiple prior break - through attempts failed, with price retreating each time. This implies a large number of trapped or profit - taking positions at 87,000. As price nears, investors rush to sell, creating a strong resistance that curbs upward movement.
Bullish Reasons
Despite the current consolidation, I'm bullish. Economically, the global recovery boosts investors' risk appetite, drawing more to BTC as an innovative asset. Growing institutional interest, with BTC being added to portfolios, provides a solid price - rising base. Market sentiment is positive on Bitcoin's long - term prospects, buoyed by blockchain tech growth and wider applications. Technically, long - term indicators like the upward - diverging moving average show the long - term uptrend intact. Even with reduced trading volume during consolidation, market activity remains. New positive factors could easily break the current range and push price towards the resistance.
💎💎💎 BTC 💎💎💎
🎁 Buy@83500 - 84000
🎁 TP 86000 - 87000
The market has been extremely volatile lately. If you can't figure out the market's direction, you'll only be a cash dispenser for others. If you also want to succeed,Follow the link below to get my daily strategy updates

XAUUSD- short term downtrend H3 continue, sidewayGold Short-Term Downtrend (H3):
Gold is showing bearish momentum on the 3-hour chart, forming lower highs and lower lows. Sellers remain in control unless key resistance levels are broken. Watch for potential support around recent swing lows.

BTC Buy SETUP for todayThis is a BTCUSD buy setup with ENTRY< STOP LOSS TAKE PROFITS LEVES for today 23 of March 2025

Bitcoin (BTCUSD) - Bullish Breakout from Strong Falling WedgeBitcoin is currently showing signs of a potential breakout from a strong falling wedge pattern on the 4H chart, which is a classic bullish reversal signal.
🔍 Technical Highlights:
The falling wedge has been forming since late January, creating a series of lower highs and lower lows.
Price action is now consolidating near the wedge resistance, indicating an impending breakout.
A previous bullish leg saw a price rally of 25,428.16 (+30.29%), suggesting strong historical momentum.
If BTC breaks out cleanly, we could see a similar or stronger move—projecting a potential rally of 28,086.24 (+31.12%).
📈 Expected Target : ~$118,141, aligning with the measured move from the wedge breakout.
🧠 Trading Insigh t: Watch for a confirmed breakout with strong volume above the wedge resistance zone. Retests of the breakout area can offer ideal entries for continuation trades.

Potenial inverse head and shoulders pattern for Bitcoin This is the scenario I’m believing in for the near term for BINANCE:BTCUSD .
One more leg down to confirm the neckline around 78,300 USD.
Quick reversal price action to retest the 92,300 USD (ish) level.
If the breakout takes place to the upside, then I think we will retest the previous highs, with a higher probability of going much higher. Although I believe the tariffs will have a big impact on the USD (DXY index), which I believe will have a strong effect on BTC for the near term, around the coming 6 months. So, I believe the new high will most likely come in Q4 this year, making this cycle different from the historic crypto cycles. Although, there is still a chance that other countries will start to adopt more crypto-friendly policies for crypto or Bitcoin, making this thesis more uncertain. If the policies come out as positive, then I think there are good chances of reaching new highs earlier than Q4, 2025.

BTCUSDT RISING WEDGE PATTERN IN 2-H AT Hello Guys Here Is Chart Of BTCUSDT in 2-H AT
Entry Level: SELL Around 86500
Resistance: The upper trendline of the wedge 87300
Target Will Be : 83100
Would you like me to check potential invalidation levels where the pattern might fail?

Let's always put our trust in BTC, mate.Bitcoin Market Analysis
BTC price hovers around 84,000 in consolidation. Bulls and bears battle at this price.
Support Level
Support is in 81,000 - 82,000. Strong buying emerges there. It stopped drops in past corrections. Dense holdings mean many cost - bases are in this range, propping up support.
Resistance Level
Resistance at 87,000. K - lines show heavy selling near it. Past break - throughs failed. Trapped or profit - taking positions sell as price nears, creating resistance.
Bullish Outlook
I'm bullish. Global recovery raises risk appetite for BTC. More institutions hold BTC, boosting price. Positive sentiment on long - term prospects, due to blockchain growth, helps. Upward - diverging moving averages show uptrend. Lower volume in consolidation, but activity stays. New positives may push price to resistance.
💎💎💎 BTC 💎💎💎
🎁 Buy@83500 - 84000
🎁 TP 86000 - 87000
The market has been extremely volatile lately. If you can't figure out the market's direction, you'll only be a cash dispenser for others. If you also want to succeed,Follow the link below to get my daily strategy updates
BTCPossible triangle or channel formation on BTC here. Looks more corrective than impulsive after analyzing for 2 years since the bull market started.

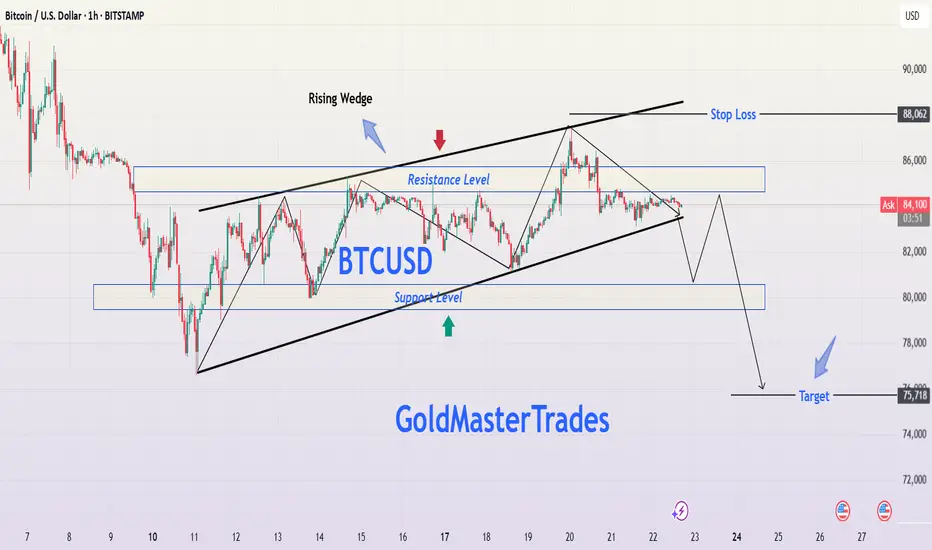
BTCUSD Bitcoin Rising Wedge Breakdown – Professional AnalysisBitcoin's price action is forming a Rising Wedge pattern on the 1-hour chart, a well-known bearish reversal formation. This pattern suggests that although the price has been making higher highs and higher lows, the upward momentum is weakening. Historically, when a rising wedge breaks to the downside, it often leads to strong downward movement, making it an ideal shorting opportunity.
This analysis will cover the pattern formation, key support and resistance levels, price action expectations, trading strategy, and risk management to ensure a well-informed trade setup.
1. Chart Pattern Breakdown: Understanding the Rising Wedge
Formation of the Rising Wedge
The price has been moving within two converging trendlines (black lines), forming a wedge shape.
The slope of both the upper and lower trendlines is positive, indicating an uptrend, but the lower trendline is steeper, suggesting weakening bullish pressure.
As Bitcoin moves higher, buying volume is declining, indicating that buyers are losing control.
The price has tested the upper resistance trendline multiple times, failing to break above it, further confirming bearish exhaustion.
The lower trendline has acted as strong support, but multiple touches suggest a possible breakdown soon.
Why This Pattern is Bearish
The rising wedge is inherently bearish because it signals that although the price is rising, the upward movement is slowing down. Eventually, the price is likely to break below the lower support trendline, triggering a sharp sell-off.
A breakdown from this wedge structure would confirm the start of a downtrend, making it an excellent opportunity for short traders.
2. Key Technical Levels to Watch
Resistance Level (~$86,000 - $86,500) - Strong Sell Zone
Bitcoin has repeatedly failed to break above this zone, indicating heavy selling pressure.
If the price unexpectedly moves above this level, the bearish setup would be invalidated.
Support Level (~$80,000 - $80,500) - Breakdown Zone
This support level has held strong multiple times.
If BTC loses this zone, it will likely trigger a massive drop due to stop-loss orders being hit and panic selling.
Stop Loss ($88,062) - Risk Management
A stop loss above $88,062 ensures protection against unexpected bullish breakouts.
This level is placed just above recent highs to minimize the risk of premature stop-outs.
Target Level ($75,718) - Profit Objective
The projected price target is based on measuring the height of the wedge and applying it to the breakout point.
This level also aligns with a major historical support zone, where buyers might step in.
3. Trading Setup & Strategy
Bearish Trading Plan - Short Setup
📌 Entry:
Enter short after Bitcoin breaks below the wedge’s lower support and confirms the breakdown by retesting support as new resistance.
Ideal entry price is around $81,500 - $82,000 after confirmation.
📌 Stop Loss:
Place above $88,062, which is beyond the wedge’s upper resistance.
This protects against unexpected bullish breakouts.
📌 Take Profit:
First target: $78,000 (psychological support).
Final target: $75,718 (technical breakdown target).
Confirmation Signals for a Strong Short Trade
✔ Candle Close Below Support – A 1-hour candle closing below the wedge confirms a breakdown.
✔ Increase in Selling Volume – Rising bearish volume supports downward momentum.
✔ Retest of Broken Support as Resistance – If the price retests the wedge’s lower trendline and fails to reclaim it, it confirms further downside.
4. Risk Management & Considerations
Risk-to-Reward Ratio: The trade offers a 3:1 risk-reward ratio, making it highly favorable.
Market Conditions: External news events, institutional activity, or macroeconomic trends (like inflation reports) could impact price action.
Bear Trap Possibility: If Bitcoin breaks below but quickly reclaims support, it could be a fakeout, so wait for confirmation before entering.
5. Alternative Scenario – When to Invalidate the Bearish Outlook?
Although the primary expectation is a bearish breakdown, we must consider alternate scenarios:
🚨 Bullish Invalidation: What if Bitcoin Rallies?
If Bitcoin breaks above the resistance zone at $86,500 - $88,000, the rising wedge breakdown would be invalidated. In that case:
✅ A breakout above $88,062 could trigger a short squeeze, pushing BTC toward $90,000+.
✅ Bulls will regain control, shifting the trend to bullish continuation instead of reversal.
🔹 In such a case, traders should exit short positions and re-evaluate market conditions before re-entering trades.
6. Conclusion – Trading Plan Summary
📊 Current Bias: Bearish 📉
🔹 Pattern: Rising Wedge (Breakdown Expected)
🔹 Entry: Short after wedge breakdown & confirmation
🔹 Stop Loss: Above $88,062
🔹 Target: $75,718
Bitcoin is forming a classic Rising Wedge, which historically leads to strong downward movement once it breaks support. If BTC follows the expected scenario, a high-probability short trade is in play, targeting a decline toward $75,718. However, traders must wait for confirmation and manage risk effectively to avoid fakeouts.
📢 Stay updated, follow price action closely, and trade responsibly! 🚀
Why did BTC experience such minimal movement todayBTC has been floating at 84000 today, yesterday it touched resistance at 87000, today's resistance is still valid, with the Fed's information, gold's rally has been full down, and more people will pay attention to BTC next
💎💎💎 BTC 💎💎💎
🎁 Buy@83500 - 84000
🎁 TP 86000 - 87000
The market has been extremely volatile lately. If you can't figure out the market's direction, you'll only be a cash dispenser for others. If you also want to succeed,Follow the link below to get my daily strategy updates

Explanation Why Bitcoin BTC Bull Run Is not Over YetHello, Skyrexians!
Time to update BINANCE:BTCUSDT huge analysis. Market became bigger and it needs more rime to form bull and bear stages. Now everyone is waiting for the bear market because it was every time, but this time it will be tricky for retailers.
Let's take a look at the 2 week time frame. If we apply our Fractal Trend Detector to this chart we can see that Bitcoin is still in the green zone and now is inside the huge support area. If it will be held we will see the following Elliott waves scenario where wave 3 will reach at least $144k. Awesome Oscillator also gives us a hint that it's still not over. The entire bull market will be finished only in the middle of 2026.
Best regards,
Skyrexio Team
___________________________________________________________
Please, boost this article and subscribe our page if you like analysis!

BTC/USD – BIG ESPRESSO SHOT–is the breakout of the decade ahead?On the Bitcoin (BTC/USD) daily chart, we observe a potential bullish scenario based on the well-known Cup and Handle formation.
Between November 2021 and November 2024, Bitcoin formed a classic Cup and Handle pattern.
The "cup" part (marked as 1-2-3) is characterized by a rounded bottom, indicating a correction phase, accumulation, and gradual recovery of bullish momentum.
Then, in the second half of 2024, the "handle" (marked as 4-5) formed as a short-term consolidation in the shape of a triangle, which was followed by a breakout that led to a peak around $109k in January 2025. A correction followed, pushing the price down to approximately $76.5k in March 2025.
Currently, the price is making a pullback, testing the key zone around 87K–$93k from below.
To confirm the bullish scenario, we need a strong hold above the $75k–$76k support and a clear breakout above the local resistance zone at 87K–$93k.
As of now, this retest has not yet been confirmed and requires further observation, as there is still a risk of a fake breakout and potential drop to lower support zones — such as $66k or even $50k.
This formation suggests strong upside potential for Bitcoin in the medium to long term, and if confirmed, may signal a continuation of the uptrend with a target around $127k–$130k.
WATCH CLOSELY

Global Tensions, Market Manipulation, and BTC Uncertainty The cryptocurrency market, a realm notorious for its volatility, is currently grappling with a confluence of factors that are forcing investors to reassess their strategies. Global trade tensions, macroeconomic uncertainties, and the intricate dance of market manipulation are all contributing to a complex and unpredictable landscape. Specifically, Bitcoin, the flagship cryptocurrency, is experiencing a period of intense scrutiny, with analysts offering a range of perspectives on its potential future.
A recurring theme in recent analyses is the notion of "whale manipulation." Reports suggest that large holders, or "whales," are engaging in strategic trades on exchanges like Binance to influence Bitcoin's price. This "liquidity massaging" is seen as a deliberate attempt to create artificial price ceilings, with some analysts predicting that Bitcoin's upward momentum could be capped below $90,000, and more conservatively, $87.5K. Such manipulations introduce uncertainty, making it difficult to discern genuine market sentiment from artificially inflated or deflated prices.
Adding to the complexity is the debate surrounding retail investor participation. Contrary to the prevailing narrative of retail investors being absent, some crypto executives argue that they are already actively involved. This perspective challenges the notion that a surge in retail interest is needed to propel Bitcoin to new heights. If retail participation is already significant, the anticipated catalyst for a bull run may have already materialized, leaving investors to wonder what new catalyst is needed for further price appreciation.
Data from Bitcoin's Realized Cap and UTXO (Unspent Transaction Output) analysis is also signaling a "major shift." These metrics, which offer insights into the actual value stored within the Bitcoin network and the movement of coins, are crucial for understanding the underlying health of the market. Changes in these indicators can foreshadow significant price movements and shifts in investor behavior. Traders are closely monitoring these metrics for clues about Bitcoin's future direction.
However, despite recent attempts to pare losses, Bitcoin is struggling to maintain a consistent uptrend. This instability has led some traders to adopt a bearish stance, with predictions of a potential drop to as low as $65,000. These bearish sentiments are fueled by the inability of Bitcoin to decisively break through resistance levels and the persistent volatility that characterizes the current market.
Conversely, some analysts are finding bullish signals by examining indicators that also correlate with the Nasdaq. The correlation between traditional financial markets and the cryptocurrency space has become increasingly evident, and analyzing these relationships can provide valuable insights. If the Nasdaq shows signs of strength, it could potentially buoy Bitcoin's price. However, this correlation is not always consistent, and the inherent volatility of both markets can lead to unpredictable outcomes.
The performance of U.S. spot Bitcoin ETFs is another critical factor influencing market dynamics. The collapse of the "cash-and-carry" trade, a popular arbitrage strategy, has had significant implications for investors. The stagnation of inflows into these ETFs, compared to the initial surge earlier in 2024, has raised concerns about the sustainability of institutional interest. While there have been recent reports of net inflows returning, questions remain if this is a temporary blip, or a sustained uptrend. This fluctuation in ETF inflow signals a wavering confidence from institutional players.
The combination of these factors creates a challenging environment for investors. Global trade tensions, which can disrupt economic stability and investor sentiment, add another layer of uncertainty. Fluctuations in traditional markets, geopolitical events, and regulatory developments can all have a ripple effect on the cryptocurrency market.
In this tumultuous landscape, investors are advised to exercise caution and adopt a diversified approach. Relying solely on technical analysis or market sentiment can be risky. Instead, a comprehensive strategy that incorporates fundamental analysis, risk management, and a deep understanding of market dynamics is essential.
The current situation highlights the inherent volatility and complexity of the cryptocurrency market. While Bitcoin remains a dominant force, its future trajectory is far from certain. The interplay of whale manipulation, retail participation, technical indicators, and macroeconomic factors creates a dynamic and unpredictable environment. Investors must remain vigilant, adapt to changing conditions, and prioritize risk management to navigate this challenging terrain successfully.

BTC: Accumulate energy for the rise and soar into the sky!📍BTC's volatility has narrowed, with selling pressure showing signs of weakening. Throughout the choppy price action, the 84000-83500 zone has established itself as a critical support area in the short-term structure. This level now serves as a key defensive line.
📍Following this consolidation phase, BTC may stage a rebound from this support region. If the price manages to break through the resistance around 84800 with strength, further upside momentum could drive it towards the 90000 level.
🔎Trade Idea:
BTCUSD:Buy at 83500-83000
TP:84500-85000
SL:Adjust according to risk tolerance.
📩Trading means that everything has results and everything has feedback. I have been committed to market trading and trading strategy sharing, striving to improve the winning rate of trading and maximize profits. If you want to copy trading signals to make a profit, or master independent trading skills and thinking, you can follow the channel at the bottom of the article to copy trading strategies and signals

Just In: $PI Set for 200% Surge Amidst Steep Falling WedgeThe price of price is set to skyrocket amidst a steep falling wedge pattern that has left the asset plummeting currently down 14%.
While the asset is currently oversold as indicated by the Relative strength index (RSI) of 21, this adds more credence to the bullish thesis. With a recent All time high (ATH) of $2.98 and a total and maximum supply of 100 billion tokens, PI coin is more than ready to capitalize on this market dip to spark a renaissance.
Albeit the crypto market is facing turbulence time at the moment, with the crypto fear and greed index dipping to 27% hinting at a bearish sentiment. Similarly, CRYPTOCAP:BTC lose its dominance over altcoin with the ration pegged as 21% bitcoin and the remaining 79% comprises of all the remaining tokens. This metric hints at a potential altcoin season incoming and NASDAQ:PI is not exempted.
Pi Price Live Data
The live Pi price today is $0.897547 USD with a 24-hour trading volume of $543,904,959 USD. Pi is down 23.67% in the last 24 hours, with a live market cap of $6,122,316,736 USD. It has a circulating supply of 6,821,168,428 PI coins and a max. supply of 100,000,000,000 PI coins.

Intraday btc fall targeting new lowsLS(London session) bos, following from yesterday NYS bos, will push intraday price further down but LS high can be taken first so know your risk.
