btcusd on bearish retrace#BTCUSD price have multiple retest below 81k, now we await for next double rejection to sell.
If price touch 84200 then bearish retracment is active which will drop the price till 81k. Stop loss at 85196.
Above 85196 have bullish breakout which forms new buy to reach 88k-90k limit.
Btcusdanalysis

Bitcoin will reach $221,000The chart explicitly labels a "Breakout" point around December 15, 2024, where the price moves above the $80,000 resistance level of the ascending triangle. This breakout is a significant technical event, suggesting strong buying pressure and a continuation of the uptrend. Following the breakout, the chart notes a "Retracement" phase, where the price pulls back to test the breakout level (now acting as support at approximately $80,000). This behavior is common in technical analysis, as prices often retest previous resistance levels after a breakout to confirm support.
As of March 14, 2025, the current price of $80,228.30 is just above the $80,000 level, suggesting the price may be in the early stages of this retracement or has recently stabilized after testing the support. This positioning indicates potential buying opportunities for traders looking for entry points near this level, with expectations of further upward movement.
Projected Price Target: $221,000
One of the most notable annotations on the chart is the "TG $221,000" label, which stands for "Target Price" of $221,000. This target is projected based on the breakout from the ascending triangle, likely calculated by taking the height of the triangle (the difference between the resistance at $80,000 and the lowest support at $55,000, which is $25,000) and adding it to the breakout level ($80,000 + $25,000 = $105,000). However, the chart's projection to $221,000 suggests a more aggressive target, possibly involving a multiple of the height (e.g., 3x the height, $80,000 + $75,000 = $155,000, still not reaching $221,000) or a Fibonacci extension beyond standard calculations.
Given the significant gap between the current price ($80,228.30) and the target ($221,000), this projection is an unexpected detail, implying a potential multi-fold increase in Bitcoin's value. It aligns with the chart's bullish patterns but involves considerable uncertainty, as market conditions, macroeconomic factors, and adoption rates could influence actual price movements.
Additional Technical Observations
Beyond the ascending channel and triangle, the chart includes several other technical elements:
Support and Resistance Levels: The $80,000 level, initially a resistance during the triangle, becomes a key support level post-breakout. The lower trendline of the ascending channel also acts as dynamic support throughout the uptrend, providing a floor for price corrections.
Volume Indicator (Implied): While not explicitly shown, breakouts like the one labeled are often accompanied by increased volume, which would confirm the strength of the move. Without a visible volume histogram, this remains an inference.
Fibonacci Retracement (Potential): The retracement after the breakout could be analyzed using Fibonacci levels (e.g., 38.2%, 50%, 61.8%) to identify key support zones, though these are not drawn on the chart.
Momentum and Moving Averages (Implied): Although not visible, momentum indicators like RSI or MACD could provide additional insights. For instance, a strong breakout might correlate with overbought RSI, while the retracement could indicate a return to neutral levels. Moving averages (e.g., 50-day, 200-day) might have supported the uptrend earlier, with the price potentially approaching these for support during retracements.
Implications for Traders
The analysis suggests Bitcoin is in a robust bullish trend, supported by the ascending channel, triangle breakout, and projected target. Traders may consider the following strategies:
Buy on Pullbacks: Look for buying opportunities near the $80,000 support level, especially if volume and other indicators confirm buying pressure.
Target Setting: Use the projected target of $221,000 as a long-term goal, but be mindful of market volatility and external factors that could affect price.
Risk Management: Given the significant gap to the target, set stop-loss levels below key support (e.g., below $80,000) to manage risk.

Bitcoin is Headed to $36K And It’s Happening NOW!This might not be the most popular opinion, especially among those who still believe the current Bitcoin bull cycle hasn’t ended. However, I encourage you to take a few minutes, approach this with an open mind, and let me know whether you agree or disagree.
Understanding the Previous Cycle (2020–2021)
The last Bitcoin bull cycle began in March 2020, when BTC bottomed at approximately $3,810. It then surged to an all-time high (ATH) of $69,870 in November 2021, marking the cycle top.
By applying a Fibonacci retracement to this entire range, we can see that the golden pocket (0.618 - 0.786 Fib)—often a key support zone during bear markets—fell between $17,700 and $28,690.
Looking at the chart, BTC beautifully retraced into this zone, even dipping slightly below it to form a cycle bottom at $15,500 in November 2022.
The key sign that the bear market had ended and a new bull market had begun was when Bitcoin broke above the 0.786 Fibonacci level of the previous cycle and established a higher high on the weekly chart. This marked a clear shift from a bearish to a bullish market structure.
The Current Cycle (2022–2025)
From the November 2022 bottom, Bitcoin rallied, setting a new ATH at $73,600—just slightly above the previous peak. After some consolidation, it found strong support at the 0.236 Fib level of the previous bull cycle, signaling that the uptrend was still intact.
The real breakout came when BTC surpassed the psychological $100,000 level and consolidated around the -0.5 Fib extension of the previous cycle. The cycle top appears to have been put in after Donald Trump took office in January 2025, marking an approximately 26-month bull run—longer than previous cycles.
However, a major bear market confirmation signal has now emerged: BTC has decisively broken below the 0.236 Fib retracement of this cycle, which historically signals the end of a bull market and the beginning of a new bear phase.
Where is the Next Bottom?
By analyzing the Fibonacci levels of both the previous and current bull cycles, we can identify key potential support zones where Bitcoin may bottom out:
1. $51,370 - $53,700
• This range aligns with:
• 0.236 Fib of the previous bull cycle
• 0.618 Fib of the most recent bull cycle
• This zone has confluence, making it a high-probability support level.
2. $35,600 - $36,500
• This range aligns with:
• 0.5 Fib of the previous bull cycle
• 0.786 Fib of the most recent bull cycle
• If BTC breaks below the first support zone, this is the next key level to watch.
Historically, Bitcoin bear markets last around one year, so we can expect this downward trend to play out over a similar timeframe.
How to Position Yourself?
For long-term investors, these support zones offer prime buying opportunities to accumulate Bitcoin at discounted prices before the next bull run begins. While the market won’t move in a straight line down—expect bounces and fake-outs—the general expectation is that BTC will find its next higher low within one of these zones.
Looking Ahead: Next Bull Cycle Target
If we use the same -0.5 Fib extension strategy that predicted the previous cycle’s top, we can estimate the next bull market peak. Based on the current cycle’s Fib range, the projected ATH for the next bull run would be around $157,000.
Final Thoughts
While nobody can predict the future with certainty, historical price action, Fibonacci levels, and market structure provide strong clues about where BTC is headed next. As always, flexibility is key—if market conditions change, so should our expectations. But if history repeats itself, these levels offer a solid framework for identifying the best entry points and positioning for the next major bull run.
What do you think? Do you agree with this analysis, or do you see it differently? Let me know in the comments!

BTC/USDT Reversal scenariosThere is bear mood in market, its exactly what is needed for reversal, lets have a look closer. I see 3 options.
1) Manipulation is over, we reached the target of local FIBO 1.618 at 77055$
2) Level 73764$ - its the target of Double TOP , the edge/high of the last block and 0.618 level of grand FIBO
3) POC level of last accumulation block which lasted for 255d at 67436$ - we could reach this level only with fast squeeze and fast buy back, leaving long needle on higher timeframe

BTC Market Update: Upside Move ImminentBTC Market Update: Upside Move Imminent
Bitcoin has successfully grabbed downside liquidity, setting the stage for a potential upside move.
Key Insights:
- The market has formed a Confirmation of Inverse Strength Distribution (CISD), indicating a bullish reversal.
- The marked swing highs are being tested, and a breakout above these levels could confirm the uptrend.
- The target zone of $84,400 is now in sight, with the market poised to challenge this level.
Trading Hypothesis:
- A sustained move above the marked swing highs could propel BTC towards the $84,400 zone.

Bitcoin Weekly LINEAR chart shows possible re run of 2021 2X ATHI was just looking at this Linear chart and spotted a couple of things.
So many people Use LOGARITHMIC charts.
In summery, A logarithmic chart is a graphical representation that uses a logarithmic scale, which differs from the conventional linear scale. In a logarithmic scale, the distance between values is not constant but increases by a factor, making it useful for datasets with a wide range of values. This approach helps in presenting numerical information more efficiently and allows for a better visualization of rates of change or percentages rather than absolute values.
A LINEAR chart however, shows you the REAL rate of change.
And on This Linear chart, I have noticed that PA is creating a very Similar Top to the MARCH ATH of 2021
I do not think we will follow it perfectly, as that drop in 2021 was over 50% and that would take us down to 52K, which I think is not a real possibility. But, being open to ALL possibilities, that trend line that was used by PA to bounce to the Nov ATH currently sits around 65K But the longer we wait, it heads higher, towards the 1 Fib ext around the Old 2021 ATH near 70K ( 69300)
Also note, how once PA had Dropped in March 2021, it levelled out and slide sideways for around 7 weeks.
So if we come over to Today, we have just dropped around 30% and seem to have found a Floor around 76K
We HAD to drop out of that Upper range box - It would have been December before we found support on the rising Trend line that has been the trigger for moves higher since 2023
And so, we have dropped to a Lower Range Box ( hopefully ) and this box hits the Rising trend line around June.
This has confluence with a number of other charts
And if we do range sideways, around this level, it is similar to that Range after the drop in 2021.
In 2021, after that range, PA rose by around 122%
I am not to sure we would see that but................
So now we wait to see if we stay in this range or not, with a top around 90K
We could See wicks out of this Range, down to the 70K mark maybe, with swift recovery.....
We may also see further Drop....
there is abcolutly NO guarentee that we will even head higher again.....
We have to wait and see and have plans and stick to them..for both BULl and BEAR

BTCUSDT Market Analysis UpdateBINANCE:BTCUSDT Hi everyone, I hope you are doing well and I have put my opinion in Bitcoin price on the chart for you. and hope this helps you! Simple, concise, useful
Bitcoin (BTCUSDT) has broken below a key trendline, and we are now seeing a potential retracement towards a demand zone around $66,771.5, which could act as a strong support level.
Breakdown & Retest: BTC has fallen below a significant trendline, confirming a bearish move. A possible retest of this zone before further decline is likely.
Long Entry Consideration: If price stabilizes and shows bullish confirmation at the highlighted demand zone, it could provide a strong long opportunity.
Bearish Scenario: A clean breakdown of this level could signal further downside potential, requiring caution before entering long positions.
RSI Oversold? The RSI is showing a potential reversal area, but confirmation is key before making any trades.
📉 Waiting for confirmation before entering!
Let me know your thoughts in the comments!
Best regards

BTC Buy at this Level - NFP News This Week (Volatility Risk!)Short term Buy idea on Bitcoin. This is a riskier idea because:
A) BTC is showing signs of Weakness (so we are counter trend trading)
B) This idea is based on NFP news timing
I may wait until Monday to get clarity (unless you also trade on the weekend)
Overall Idea for this is:
- W1/M candles have big rejection wicks to the downside, retesting the previous Week's wick, hinting at some Buyside potential
- We see divergence with ETH.
- The LTF H4 shows a Break of Structure, momentum move to the upside.
- We've already had a retracement down after, and it validated the gap in price (blue zone), reacting off it, hinting that it will hold.
- Now I'm waiting for the next best price to enter.
Again, NFP volatility can create bigger than usual spikes, so keeping that in mind.
If NFP takes it higher without coming to a better price, so be it - the train will leave without me. Will wait for further PA.
Price will be giving the validation to enter.

BTC: In Weekly TimeframeHere's how the weekly chart looks for BTC.
With 9 hours left until the weekly candle closes, it's crucial for the next weekly candle to turn green and show a rebound. The support trendline around $80K needs to hold strong to maintain positive momentum.
~ Initial Support: $80K
~ Lower Support: $68K to FWB:73K
Stay vigilant—the upcoming week will be crucial.
Trade safely, and always do your own research and analysis before making any decisions.

BTCUSDT MAKE FALLING WEDGE PATTERNHello Guys Here Is Chart Of BTCUSDT in 4-H AT
Entry Level: Buy Around 77500
Support: Below the recent low, around $77400 - $77000
Target Will Be : 90000
If BTC breaks below this level, the falling wedge pattern is invalidated, and further downside could occur.

Bitcoin - That you can't ignoreDo I want you to miss out on the opportunity? Subscribe, save the post, write comments - and let's make money togethers.

Reasons for and against a Push higher by Bitcoin SOON sin November 2022, PA has almost become predictable.
Running on a Pattern of Steps and Always paying attnetion to the Weekly MACD
I have posted in detail about the weekly MACD in other posts so I will not expain much now but here is the chart again, It explains itself really.
We are, once again, Waiting for the weekly MACD to reset to Neutral, were we hope it will bounce again. BUT, as you can see, a 3rd bounce would be unusual but , on this occasion, Highly probable
On the main chart, we can see that PA began running on a Rising trendline and, after ranging for a while, it bounced off it in Mid October 2023. It has Never returned to that line.
PA began Ranging again in March 2024. Note that date on the MACD chart. MACD Peaked and began turning Bearish and fell till it hit neutral in Sep.
At that same moment, in Sep 2024, PA bumped into the 50 week SMA ( RED) and bounced up to a New ATH in Dec 2024
So, we had 2 bounces after ranges, seemingly unconnected - until you look at the day count of each range.
1st -April 2023 to Sep 2023 - 196 days
2nd - March 2024 to Sep 2024 - 189 days
Now also note the Double Tops and then the retrace on Both those Range dates AND on the current Range
And so NOW, Currently, we are in a Range, again, MACD Peaked High and is falling Bearish
But this Range began in DECEMBER 2024
So why do we have a possibility of a push higher soon ?
Look where that RED 50 week SMA is - Just below PA.
Could PA Bounce of it if we bump into it ?
We have come VERY Close in recent days. The 50 is around 75500 - PA got to 76500
If PA touches it, I am sure we will bounce Higher
And so This leads us to why we may NOT bounce soon
I think the Bulls are trying to keep PA off the 50 till MACD is reset. If true, that 50 will level out.
PA will have to touch it BEFORE it begins to fall or PA will have to drop below 70K to reach it.
And THIS Leads us to what I think could Very well happen
IF PA were to have a bounce higher soon , maybe to Top of Range, around 109 ( but probably Lower) this would give PA room to drop back to Bottom of Range while MACD continues to Fall. A Quick push up , say over 10 days, would hardly effect the MACD reset but gives PA room to move without loosing to much more value, Keeping Market CAP stable and Sentiment happy
MACD is expected to reach neutral, at current rate of descent, around May / June.
And Look..that happens to be around 189 days since range began. The same approx day count as the previous 2 ranges this cycle.
We may see a drop lower this month, nothing is for sure but if we fall below that 50 SMA, I will be changing my Bullish Tune and Screaming CAUTION
All to play for in the next few months

BTC 3 MONTHS LONG Starts, this week?Waiting for a last impulse 140 ds/3 months on INDEX:BTCUSD BITCOIN, this week could the 3 months BTC LONG START . Why? Let´s see:
- Channel with 4 elliot waves done. Looking for Wave 5.
- RSI 3D breaking out, like 1 year ago.
- RSI W Just about to Break out, like 1 year ago. Looking for confirmation.
- Rate Cuts this week, lets see.
www.tradingview.com INDEX:BTCUSD

BTC Long ?Btc currently in a channel in h4 it's having the good potential to breakout and we'll see good above movements

Bitcoin's market share rises despite decline in active usersThe data shows that Bitcoin's dominance has been rising steadily since 2022. It also highlights that Bitcoin's market share of active users has fallen over time. The data shows that on-chain activity in Ethereum and other layer 1 (L1) networks has increased.
OnChain data shows that Bitcoin's dominance has increased since 2022, and the upward trend is the longest in history. The data also shows that Bitcoin's active user market share has fallen as on-chain activity on the Ethereum network has increased.
Amid declining users, Bitcoin dominance has increased;
Matrixport shows that Bitcoin dominance has increased to a new high of over 61%. The analytics platform put the dominance higher, which was stronger than expected in the US jobs report. It said that the increased job rate indicates that the economy is recovering. COINBASE:BTCUSD BITSTAMP:BTCUSD BYBIT:BTCUSDT.P BINANCE:BTCUSDT

$BTC Price Showing Head and Shoulder Pattern On Chart, CPI DATACRYPTOCAP:BTC Price Showing Head and Shoulder Pattern On Chart, CPI DATA, $95K Soon as Possible?
Bitcoin high-entry buyers are driving sell pressure, price may ‘floor’ at $70K
Bitcoin's “top buyers” are selling heavily, with onchain analytics firm Glassnode calling it a “moderate capitulation event.”
Bitcoin buyers who purchased around when it hit a $109,000 all-time peak in January are now panic-selling as the cryptocurrency declines, says onchain analytics firm Glassnode, which isn’t ruling out that Bitcoin could slide to $70,000.
Glassnode said in a March 11 markets report that a recent sell-off by top buyers has driven “intense loss realization and a moderate capitulation event.”
Short-term holders fled as Bitcoin dropped from peak
The surge in buyers paying higher prices for Bitcoin
BTC $82,482 in recent months is reflected in the short-term holder realized price — the average purchase price for those holding Bitcoin for less than 155 days.
In October, the short-term realized price was $62,000. At the time of publication, it’s $91,362 — up about 47% in five months, according to Bitbo data.
Meanwhile, Bitcoin is trading at $81,930 at the time of publication, according to CoinMarketCap. This leaves the average short-term holder with an unrealized loss of roughly 10.6%.
Related: Bitcoin slides another 3% — Is BTC price headed for $69K next?
On the same day, BitMEX co-founder Arthur Hayes said that Bitcoin may retest the $78,000 price level and, if that fails, may head to $75,000 next.
Glassnode explained that a similar sell-off Bitcoin pattern was seen in August when Bitcoin fell from $68,000 to around $49,000 amid fears of a recession, poor employment data in the United States, and sluggish growth among leading tech stocks.
#BTC☀ #BinanceAlphaAlert #BinanceSquareFamily #Write2Earn #SUBROOFFICIAL
Disclaimer: This article is for informational purposes only and does not constitute financial advice. Always conduct your own research before making any investment decisions.

BTC SHORT TP:79,500 11-03-2025Bitcoin is currently displaying bearish patterns on the 1-hour timeframe, indicating a potential short opportunity. We aim to close this position within 10 to 13 hours, targeting a take profit in the range of 79,000 - 80,000.
Make sure to follow me to stay updated on this trade and more!

BTC/USDT (Bitcoin) LONG SET UPEntry Price 1: $78,000
Entry Price 2: $73,000
Stop Loss: $63,000
Take Profit 1: $85,000 (Close 25%)
Take Profit 2: $98,000 (Close 50%)
Take Profit 3: $108,000 (Close 75%)
Take Profit 4: $118,000 (Close 100%)
Status: ACTIVE

Bitcoin's Natural Correction and the $141K Target Based on Fibonhello dear trader and investors
The cryptocurrency market is always accompanied by strong fluctuations and natural corrections. Bitcoin, as the market leader, requires corrections and liquidity accumulation after each significant rally to pave the way for higher price targets. In this article, we analyze Fibonacci structures and harmonic patterns to demonstrate that Bitcoin's next target could be $141K.
1. Bitcoin Corrections: A Natural Part of an Uptrend
Price corrections in bullish trends are a normal phenomenon that helps shake out weak hands and allows major players to accumulate liquidity. Historically, Bitcoin has experienced 20-30% corrections before resuming its upward trajectory. The current correction is no different and may serve as a base for the next strong move toward higher targets.
2. The $141K Target Based on Fibonacci
Fibonacci levels are among the most reliable tools for predicting price targets. Assuming Bitcoin's recent high was around FWB:73K and the ongoing pullback is a healthy retracement, we can use harmonic AB=CD pattern to project potential upside targets. Based on these levels, Bitcoin could reach $141K in the next bullish phase.
Confirmation Through Harmonic Patterns
Harmonic patterns like Butterfly and Gartley suggest that the current correction is forming a potential reversal structure. If this correction completes within the PRZ (Potential Reversal Zone), Bitcoin could see a strong continuation of its uptrend. The Fibonacci ratios in these harmonic structures indicate that the final price target for this bullish wave could be around $141K.
Volume and Liquidity: Key Drivers for the Rally
Bitcoin needs increased volume and liquidity inflows to reach higher levels. On-chain data shows that trading volumes are rising and large investors (whales) are accumulating rather than selling. This behavior typically precedes a strong bullish move.
Bitcoin's current correction is entirely natural, and technical structures suggest that it could be laying the foundation for a new bullish wave. Based on Fibonacci and harmonic pattern analysis, Bitcoin's next major target is around $141K. Traders and investors should consider these levels in their analysis and avoid emotional decisions during market corrections
good luck
mehdi

Bitcoin at $80,000. A Defining Crossroads: $65,000 or $120,000?Bitcoin stands at a critical juncture at $80,000, where market participants are engaged in a decisive battle between bullish momentum and bearish resistance. The outcome of this struggle will shape the next major move, with two distinct scenarios emerging.
Scenario 1: A Retracement Toward $65,000
If Bitcoin fails to maintain its current momentum, profit-taking and increased selling pressure could lead to a decline toward $65,000. This level serves as a crucial support zone, where demand may re-emerge to stabilize the price before any potential recovery. A break below this threshold would signal a deeper correction, potentially delaying any further upside in the near term.
Scenario 2: A Breakout Toward $120,000
For Bitcoin to sustain a move toward $120,000 by late March or early April, the market must see uninterrupted buying pressure over the next 10 days. There can be no hesitation—buyers need to absorb selling liquidity consistently, preventing any major pullbacks. The key level to watch in this scenario is $109,000, a major resistance zone that has the potential to act as the final barrier before BTC enters price discovery. A clean break and consolidation above this level would significantly increase the probability of an accelerated move toward $120,000.
At this stage, Bitcoin is at a make-or-break point, and the direction it takes from here will set the tone for the coming weeks. Whether it experiences a healthy correction or an explosive rally depends entirely on how market participants respond at these critical price levels.

ETH at a Critical Support Level! Market Poised for a Big Move?Ethereum ( CRYPTOCAP:ETH ) is currently trading at a 261-week-old support level, making this a crucial zone for the market.
Earlier, ETH dipped to $1,754, a price level that has historically been significant. This could very well mark the bottom for ETH and potentially for altcoins. However, it's still too early to confirm.
The next two weekly candles will be key, if this support holds, we could see a strong altcoin recovery in the coming months.
Macro Factors at Play:
The broader geopolitical and macroeconomic landscape isn't great, despite this potential setup. Markets in the US, China, and India are facing turbulence, and the crypto market is experiencing low volume and liquidity. These factors could impact price action in the short term.
That said, as the chart develops over the next few weeks, we might witness significant shifts in market sentiment.
Sooner or later, BTC will make its move—either consolidating or attempting to reclaim $90K—while altcoins could start rebounding rapidly. When this happens, the market could turn bullish in a matter of weeks.
Stay Alert, The Opportunity Is Coming:
Now is the time to pay close attention to the charts and fundamentals. Stay sharp, monitor key levels, and prepare for potential opportunities.
I'll be sharing a handpicked list of altcoins that could perform well in the coming days.
DYOR , Not Financial Advice.
Stay tuned.
Do show your support buy hitting that like button.
Thank you
#PEACE

BTC/USDT updateBefore the correction, we had already shared the most probable scenario for #BTC in Spot Club and, with a slight delay, in this channel. As expected, the price dropped around 11% in spot within wave C, leading to significant liquidity being absorbed in the market.
However, we had already warned tarde-ai.bot members about this potential move in advance.
We still consider our previous outlook as the most probable scenario for Bitcoin's next move. If our perspective changes, we will update the analysis accordingly.

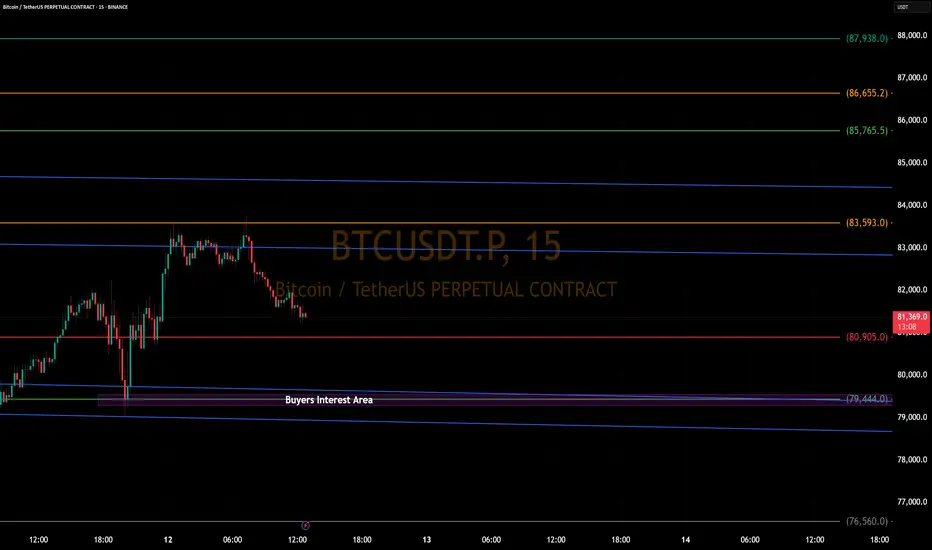
BTCUSDT Price Action | March 12, 2025BINANCE:BTCUSDT.P is now trying to recover from its 50% daily time frame correction. As per my analysis 79444 is now Buyers interest level to go long with stop loss of 76560 for targets of 83593, 85765 (50% Pullback level in 4 hour time frame).
Note. This is my personal analysis, please do your analysis and take decision for buy or sell with strict risk management. Thanks.