BTC bullishbtc can be bullish
we can buy with targets till the above horizontal lines.
the horizontal lines are range calculations for the current day in BTC.
SL can be put below breakout candle of horizontal lines.
Btcusdanalysis

Will Bitcoin Break Its Resistance? | Market Analysis of Bitcoin
As you can see on the chart, Bitcoin (BTC) is respecting a curve trendline very well. One of the most important observations is that every time Bitcoin tests this curve trendline, it forms an inverted hammer candlestick pattern, leading to a market reversal.
For those familiar with technical analysis, candlestick patterns play a significant role in predicting market movements. The repeated formation of inverted hammers at this trendline has consistently caused the market to reverse. Now, as Bitcoin approaches this trendline again, we’ll watch for the formation of another inverted hammer. If this pattern appears, it could signal another reversal and a potential drop in price.
However, just because the market has failed multiple times at this level doesn’t mean it will fail again. There’s also a strong possibility that Bitcoin could break through this resistance zone. The 91,000–92,000 zone is acting as a key resistance area, and the curve trendline is also providing resistance here.
Two Possible Scenarios
Scenario 1: Breakout Above Resistance
- There’s a high probability that Bitcoin could break the 91,000–92,000 resistance zone.
- If this happens, the next major resistance levels to watch are 94,500 and 98,800.
- After reaching these levels, Bitcoin might pull back, and we’ll analyze the next move in a future update.
- 94,500 and 98,800 are important resistance levels that are defining the current market character. For now, the market remains bearish, but if these levels are broken in the future, we could see the market’s character shift to bullish.
Scenario 2: Reversal at Trendline
- Bitcoin could test the curve trendline and form another inverted hammer pattern, leading to a reversal.
- This would mean the market fails to break the resistance and moves downward again, continuing the previous pattern.
Key Takeaways
Watch for Candlestick Patterns: The formation of an inverted hammer at the trendline could signal a reversal.
Trade Carefully: Be prepared for both scenarios—breakout or reversal—and plan your trades accordingly.
Note
My goal is to simplify the chart and help you understand the price action clearly. I avoid overloading the chart with unnecessary indicators or creating confusion. My analysis focuses on keeping the chart clean and straightforward.
Thank you!

Bitcoin Breaks 90k with upward bounce on Daily FVG and 200MABitcoin Breaks 90k with bounce on Daily FVG and 200MA.
The FMG "Fair Value Gap" is a big deal, especially this one on the daily.
The 4h and 2h and 45min charts are looking like this could continue.
It's a powerful moment, and maybe 80k will never been seen again?
This is more bullish than I have felt in a few days.

Major upcoming events in the marketThe trap has appeared:
- The crypto summit on Friday will confirm the strategic position of BTC
- The hotly speculated altcoins may be "delisted" by policies
- The US Treasury's 215,000 BTC reserves reveal the true intention
Now chasing the rise of altcoins is like betting against the dealer. XRP, which is deeply involved in SEC lawsuits, and SOL with Democratic background are both high-risk minefields.
Remember: When the White House starts discussing crypto strategy, the real winners are always the whales who have already made arrangements.
For more amazing news, opportunity trends, big swing trades, when to buy and sell, leave me a message. BINANCE:BTCUSDT BITSTAMP:BTCUSD INDEX:BTCUSD

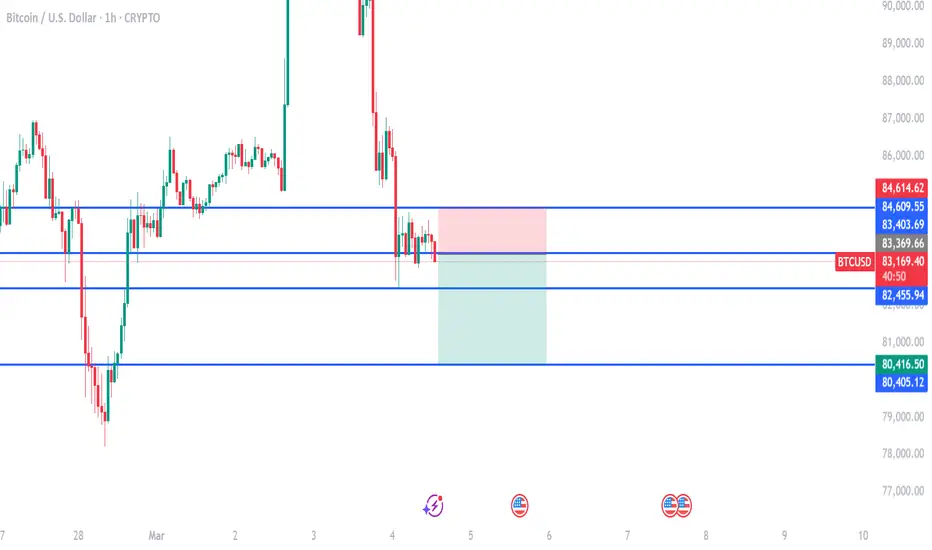
BTC SHORT TP: 85,4000 05-03-2025Bitcoin is currently displaying a rebound pattern towards the 85,000 - 85,500 zone, which is crucial to maintain its bullish momentum. I suggest entering a short position in this range with tight stop-losses to capitalize on the anticipated movement.
This analysis is based on a 1-hour timeframe, so we should expect results within 8 to 11 hours. If the expected price action does not occur within that timeframe, the trade will be considered invalid.
Be sure to follow me for ongoing updates and to continue generating profits!
We've successfully executed 6 trades in a row—let's aim for this to be the 7th, or we start fresh!

BTC new ATH and peek euphoria incoming!Wave 4 of the 5 of the 3 is complete after a complicated WXY new target 118K to 122K window. We will see how this finishes, either a slow grind higher or straight up then straight down.

BTC/USDT 1H: Bullish Structure Emerging – Next Stop $95KBTC/USDT 1H: Bullish Structure Emerging – Next Stop $95K?
🚀 Follow me on TradingView if you respect our charts! 📈 Daily updates!
Current Market Structure (Confidence 8/10):
Price: $89,849, showing bullish momentum emerging from equilibrium zone.
Hidden bullish divergence confirmed between price action and selling volume.
Market Makers (MMs) accumulated heavily at GETTEX:87K support, now targeting the premium zone.
Clean break above POI (Point of Interest) at $88.5K signals further upside potential.
Trade Recommendation:
Entry: Current price ($89.8K) or pullback to $88.7K.
Targets:
T1: $91.2K
T2: $93.5K
T3: $95K
Stop Loss: $87.2K (below equilibrium zone).
Risk Score:
8/10 – Favorable R:R setup with a clear invalidation level.
Market Maker Activity:
Accumulation phase complete at the GETTEX:87K zone.
Currently engineering moves toward the premium zone ($94-95K).
Likely targeting shorts above GETTEX:92K before continuation.
Smart Money Insight:
Institutional accumulation is evident, showing strong buying pressure.
Structure suggests another leg up, but traders should monitor premium zone resistance near $94-95K.
🚀 Follow me on TradingView if you respect our charts! 📈 Daily updates!

BTCUSD Do you think this position is a turning point?According to the current trend analysis, BTC has reached a critical point of long-short negotiations in the short term, but it is also at this time that we must pay attention that there is a high possibility of large fluctuations. Traders still need to observe calmly. Blindly entering the market will only put you in danger.
From the analysis, BTC can focus on the resistance of 90700 and 91500 in the short term. Focus on the support of 88500 and 87400 below.
Trading is risky, so control your position reasonably. The market is changing rapidly, and accurate signals are subject to real-time. BINANCE:BTCUSDT INDEX:BTCUSD COINBASE:BTCUSD BITSTAMP:BTCUSD

Bitcoin Holds Strong Above 200MA – Is the Next Rally Incoming?Bitcoin has successfully defended the $84K-$86K support zone, with the CME gap now fully closed. On the daily timeframe, BTC remains above the 200MA, signaling strong bullish momentum. With macroeconomic factors aligning in favor of crypto, this could be the start of another leg higher.
Technical Analysis:
• Support Zone: $84K - $86K held firm, preventing further downside.
• CME Gap Closure: The retracement completed the necessary gap-fill, eliminating inefficiencies.
• Trend Reversal Signal: BTC has reclaimed the 200MA on the daily chart, reinforcing bullish sentiment.
• Breakout Watch: Price is approaching a descending trendline, a breakout above could trigger a strong move toward the $110K target.
Fundamental Analysis:
• Bitcoin ETF Impact: Institutional demand continues to grow with ETF adoption.
• Macroeconomic Tailwinds: The Fed’s expected slowdown in rate hikes is a net positive for risk assets like BTC.
• Geopolitical Factors: Increased demand for BTC as a hedge against economic instability and inflation.
• Regulatory Developments: A more constructive approach from regulators supports long-term adoption.
With bullish momentum building, Bitcoin is at a key inflection point. Will it break out and push towards new highs? Stay tuned and trade wisely!
Note: Please remember to adjust this trade idea according to your individual trading conditions, including position size, broker-specific price variations, and any relevant external factors. Every trader’s situation is unique, so it’s crucial to tailor your approach to your own risk tolerance and market environment.

Make continuous profits of 10,000 points on BTCUSD, please come My name is Baker, and I am a professional analyst with more than ten years of experience in the financial industry. After witnessing insider trading in the market, I decided to resign from all institutional positions and form my own analyst team. At present, my team and I focus on in-depth analysis of gold, Bitcoin and oil market trends and medium- and short-term fast trading strategies. Of course, I am also a mentor to many traders in the market. Recently, I have continuously made profits of 5,000-10,000 points in BTC transactions, and my members have made profits of more than 600%. In the following time, I will share with you trading skills, accurate signals, insider information and other content. Interested traders can keep following up.
The market has been very unstable recently. If you are a novice trader or a trader with a bad mentality or a trader who has suffered too much loss in the past, it will be more difficult for you to trade in this market, because I have come from that stage. So I know it all. But how to trade is a very critical step, when to buy, when to sell, how much profit can you accept for each transaction, and how much loss can you accept for each transaction. Loss is equivalent to paying tuition fees, see how much loss you can bear and what you can learn. How to effectively control trading risks. Reasonably control trading positions. These are things that must be faced in trading. When trading, the market will create opportunities for us to make money. But it requires courage and execution. When not trading, you need patience. The market gives us opportunities to make money. But it will not give us the opportunity to continue to make money. So we have to seize the opportunity to make money.
When you come to this channel. Then your choice will not be wrong. Believe in your own vision. Because your vision will guide you how to become better. Smart people find me after losing money, become my members, and let me help them. This is indeed a method. Because in this way, you can not only get accurate trading signals, but also learn how to manage your trading mentality, how to control risks, how to trade correctly, and why to trade. BINANCE:BTCUSDT INDEX:BTCUSD BITSTAMP:BTCUSD COINBASE:BTCUSD

Bitcoin Retesting Bullish Megaphone PatternBitcoin is currently retesting the upper trendline of a bullish megaphone pattern, a key structure that typically signals strong upside potential after confirmation.
If this retest holds as support, BTC could see a major move toward new highs, aligning with the pattern’s bullish continuation. However, losing this level could delay the rally.
📍 Key Level to Watch: The upper boundary of the megaphone pattern (~ GETTEX:87K -$90K).
A successful bounce here could fuel Bitcoin’s next leg up! Are you positioned for it?

BTC BUYhello friends
According to the pullback we had, we can enter into the transaction with risk and capital management.
*Trade safely with us*

btc on bullish#BTCUSD price have multiple retest below 81k and more. Now we await new formation above 93k
#BTC needs to decline above 93k which holds another short bearish retest, buy between 88700 which take profit is 93k. Stop loss at 87200.
Above 91k have bullish range also.

Bitcoin Longif you want to trade Bitcoin here's my trade:
entry price: 88000
stoploss: 78000
target profit 138k or 200k or higher

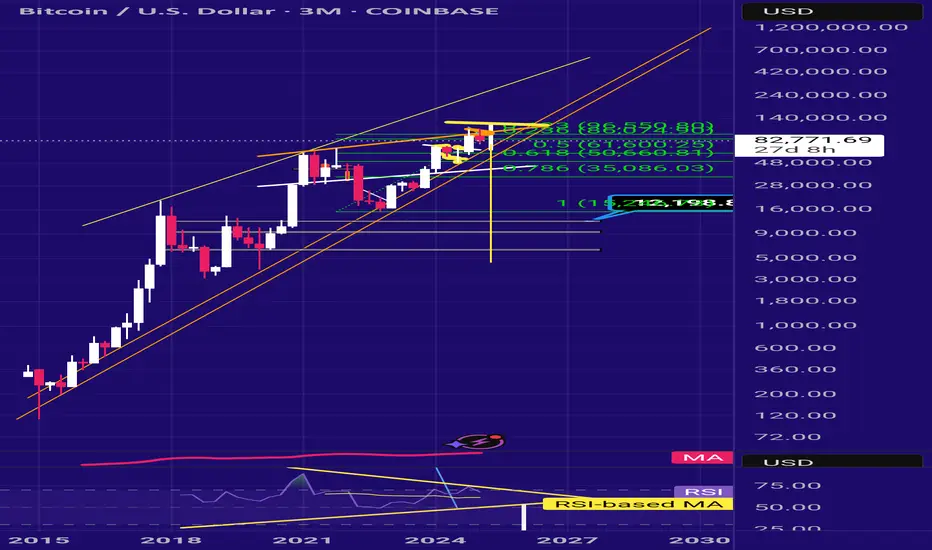
BTCUSDT 1WBTC ~ 1W Analysis
#BTC We hope there will be a lot of good news after this dips. To support the next increase to the top of Elliot Wave 5.

Bitcoin CME Gaps Filled – What’s Next for BTC?Current Market Overview & Potential Moves
Long Wicks:
The daily (1D) and weekly (1W) candles are forming long wicks, but these are simply filling previous wicks on their respective timeframes. This means they aren’t valid imbalances that need to be refilled, so they don’t necessarily signal a further downside.
CME Gaps:
Last weekend’s CME gap was fully closed, while the gap from the prior weekend was partially filled, which is often enough. There’s no technical reason for the price to drop just to complete the fill.
With no downside imbalances left to be filled, there’s no immediate reason to expect further declines. The only factor that could still influence a move down is the 1W 50 EMA, which was nearly tested (approx MIL:1K away).

BTC LONG TP:86,000 04-03-2025I foresee a potential manipulation that could drive Bitcoin down to the 81,000 - 82,000 range before we witness a significant rebound pushing the price up to 86,000. This movement is anticipated within a 1-hour timeframe, meaning we should expect this to unfold in the next 10 to 14 hours. If the expected price action does not materialize within that period, the trade will unfortunately be deemed invalid.
Make sure to follow me for the latest updates and insights, so you can continue to seize profitable opportunities!

BTC Brings SpringI thought that BTC would first try the 100-102k region with its movement starting from here and then make a new ATH. The bottom formation is complete and will react on a nice support with many positive divergences.

BTC in trouble. Sale Now.We are going to $61k and if we break that, we go to $50k.
If $50k breaks, guaranteed we go to $12k.
The worst case scenario is at $3k. Probable and possible based on chart patterns.
Obvioisly with a lot of up and downs and mini bull-runs but in the the big picture, we are going down.
The 2 year bear market cycle started.
Hold tight.
BITCOIN UPDATE TODAYHere's the latest update on Bitcoin:
Current Price
The current price of Bitcoin is around $83,780.61, with a daily high of $93,721.37 and a daily low of $82,464.84 .
Market Trends
Bitcoin's price surged 10% after President Trump's Crypto Strategic Reserve announcement, with some analysts predicting a potential breakout past $100,000 ². However, others warn that the rally may be temporary due to regulatory hurdles.
Key Levels
- Resistance: $90,000 - $100,000
- Support: $80,000 - $83,000
News
President Trump's executive order established a Crypto Strategic Reserve, which will initially include Bitcoin (BTC), Solana (SOL), Ripple (XRP), and Cardano (ADA) . This move is seen as a positive development for the cryptocurrency market.

btc on bearish#BTCUSD price retrace back 95k which results in a failed bullish strength, now back at 83500.
Firstly we wait for breakout below 83400 to sell, take profit 82300-80400, stop loss 84600.
Above 84600 on double breakout have a strong bullish to recorrect 88k to 90k limit.
Bearish BTCOn the daily and weekly stochastic RSI is in the overbought zone.
Using fibonacci, on the daily, price has not finished out the fib sequence to the d extension and had less than a 38.2 pullback.
We hit a d extension on the monthly.
Still bearish on this pair at least to 77K = 38.2 up fib retracement zone with inclination toward further downside potential to 68K = 61.8 up fib retracement zone.

Time To Hunt Bitcoin - Buy from Support to Major ResistanceThe setup focuses on buying from strong support zones and riding the price up to multiple take-profit targets.
Entry Strategy:
Entry 1: Around $84,910.7, which aligns with a key support zone.
Entry 2: Around $78,430.4, a deeper support level in case of further downside.
Risk Management:
A stop loss at $65,523.5 ensures capital protection in case of a breakdown below major support.
Take Profit Levels:
Take Profit 1: $99,009.6 – First resistance area where partial profits can be secured.
Take Profit 2: $106,102.9 – A key level where momentum may slow down.
Take Profit 3: $110,919.3 – The final target in case of a strong bullish rally.
Trade Scenario:
Bullish Case: If price holds above Entry 1, a bounce towards Take Profit levels is expected.
Bearish Case: If price drops below Entry 1, the next support (Entry 2) offers another buying opportunity.
Stop Loss Activation: If BTC drops below $65,523.5, the trade is invalidated, preventing further losses.
This trade plan follows a risk-reward approach, focusing on capital preservation while targeting high-probability reversal zones.
OKX:BTCUSDT.P BINANCE:BTCUSDT BINANCE:BTCUSDT BITSTAMP:BTCUSD KUCOIN:BTCUSDT COINBASE:BTCUSD BITSTAMP:BTCUSD
