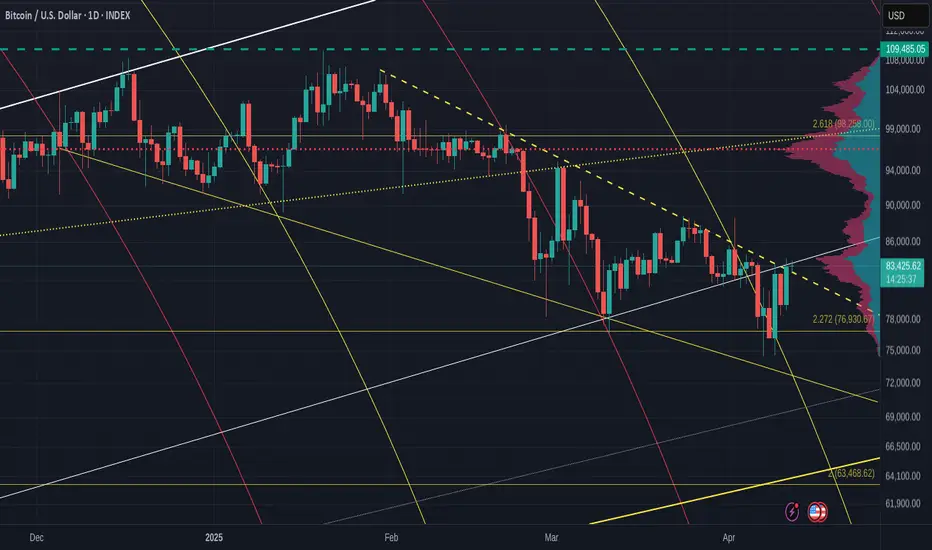
Bitcoin following 2013-2017 Fractal UPDATE - have we left it ?This chart remains unchanged from the last time I posted it except for the addition of that yellow Dashed Arrow
As we can see, PA fell below the Fractal in Late February and ever since, we have ranged further away from it.
Does this mean we have left the fractal we have been on since November 2021 ?
Not really.
PA fell below it in 2022 due to pressures from Interest rates making companies collapse and sentiment being negative.
We have fallen below it this time purely because PA was so overbought, it needed to recover.
This can be very clearly seen on the Weekly MACD, where in 2024, we ranged for months because of the same reason.
See how on the weekly MACD, how once we reached near Neutral, we bounced back up to a New ATH and, ever since, BTC PA has ranged while waiting for the MACD to cool off..
And now we are there. MACD is in the bounce zone and has shown some strength in the last few days.
So, The Fractal
For PA to get back above that Fractal, we need PA to make a very strong push higher. and as you can see from the Bold Arrow, this is achievable by end of May if PA rises Strong and continually
form here.
I am not to sure this will happen.
We have so many Macro events destabilising the markets...
I am more inclined to think PA will hit that circle , and we will likely follow the Dashed Arrow to a cycle ATH of near 300K, by the end of the year at the latest.
This is the Path of safety.
Things can always change for the better or for the worse and so we have to be ready for all occasions.
But BULLISH is the word - BUT BITCOIN ON SPOT, HOLD IT AND RELAX
Btcusdanalysis

Bitcoin Short Term Danger (4H)Bitcoin has formed a rising wedge pattern, typically considered a bearish reversal structure, suggesting a potential retracement ahead.
Watch for a possible breakdown around the $83,800 level. If this level is breached, price may head toward the $79,000–$80,000 zone, where stronger buying interest is expected.
This potential move also aligns well with key Fibonacci retracement levels, providing confluence for the setup.
Furthermore, the Bitcoin CME Futures chart supports this scenario — a large gap is expected to open tomorrow, and historically, Bitcoin tends to fill CME gaps in the short term.
— Thanks for reading.

"Bitcoin Bearish Reversal Setup: Supply Zone Short Strategy"🔵 SUPPLY ZONE (Resistance Area)
💥 Strong selling area around 85,800 - 87,800 USD
Historically, price got rejected here
Expect sellers to step in again
✍️ ENTRY POINT
📍 Just below the supply zone (~85,889.89)
Ideal for short position setup
Watch for bearish candlestick patterns for confirmation
🛑 STOP LOSS
❌ Placed above the supply zone at 87,796.97
Keeps risk under control if breakout happens
🎯 TARGET POINT (Support Area)
📉 Around 78,000 USD
Marked by previous support and structure
Great Risk-to-Reward ratio
📐 PATTERN WATCH
Looks like a harmonic pattern (maybe Gartley or Bat) 🦇
Suggests reversal from point D
Also resembles a rising wedge, which is bearish
📊 EMA (9-period)
🧭 Price hovering above the 9 EMA (84,704)
A break below it = bearish confirmation
Summary
🔻 Bearish bias
🛒 Short near supply zone
❌ SL above 87,800
🎯 TP around 78,000

Weekly Support is around 80000.Weekly Support is around 80000.
However, 72500 - 73000 is its previous
breakout level & probably a Best Buying Rage
(if it touches) which is also a Confluence area of
Trendline Support+Important Fib. level.
Bullish Divergence on Shorter Time Frame +
Weekly Support around 80000 (if Sustained)
may push the Price up towards 87000 &
then around 95000 - 96000.
Ultimate Resistance is around 110000.
Crossing this level may open new Highs
Targeting around 136000.
On Shorter Timeframe, 85000 - 86000 is
the Immediate Resistance & Support is
around 80000.

Bitcoin BTCUSDT – 4H Technical Analysis
Bitcoin is currently approaching a key downtrend resistance line that has been respected several times since early February. The price action suggests a potential rejection from this level, which could lead to a move toward the lower boundary of the broader descending channel.
🔹 Bearish Scenario: If the resistance holds, we may see a continuation of the downtrend with possible targets near the $71K– FWB:73K region.
🔹 Bullish Invalidator: A confirmed breakout above the trendline would invalidate the bearish setup and could signal a shift in market structure.
⚠️ Watch price action closely around this level for potential rejection or breakout confirmation.

LONG BTCBuyers have stepped in and are absorbing all sales by shorts. BTC should trade higher during the following weeks.

Quick Update on BTCHello traders,
BTC moved as expected from the critical support we mentioned in our previous update. We've seen a nice rebound, and it would be great if the weekly candle closes green — that would add bullish momentum to both BTC and the broader market. I’ve taken some spot entries on BTC and am hoping for a positive return.
I hope you all followed along.
Stay tuned for more updates!

BTC/USD – Short-Term Rejection at Supply Zone! Bitcoin just tested and got rejected from a high-volume supply zone around $84,940 (marked by LuxAlgo's Supply & Demand Visible Range). The price formed a wick rejection right inside the zone, and we’re now seeing early bearish signs.
---
Key Levels:
Immediate Resistance: $84,940 (supply zone top)
Support 1: $84,140
Support 2: $82,997 (previous demand zone)
Target (if breakdown continues): $82,800 area
---
Bearish Clues:
Wick rejection in a major supply zone
Strong bearish engulfing candle forming after rapid move up
RSI (not shown) was likely overbought during this quick rally
Lower timeframes suggest a potential pullback or short opportunity
---
Scalp Idea (Short-Term Traders):
Short Entry: Near $84,900–$84,940
TP1: $84,140
TP2: $83,000
SL: Above $85,100
Risk/Reward: 1:2+
---
What Do You Think?
Is this a healthy retracement or the start of a deeper dump?
Comment your thoughts below!
Smash that like if you caught this rejection or love clean supply/demand setups!
#Bitcoin #BTC #CryptoTrading #Scalping #ShortOpportunity #LuxAlgo #TechnicalAnalysis #TradingView #DayTrading

Bitcoin (BTC/USD) Long Trade Setup – Breakout Strategy with TargCurrent Price: $80,724.28
Entry Point: $80,671.23 (just above current price)
Stop Loss: $78,052.44
Target Point: $88,573.60
Resistance Point: $82,260.90
📈 Trend & Moving Averages
EMA 30 (red): $80,220.87 — Short-term trend.
EMA 200 (blue): $80,788.61 — Long-term trend.
The price is currently between the EMAs, indicating potential indecision or a shift in trend. A break above both EMAs with momentum would confirm bullish strength.
🔑 Trade Setup Summary
Element Level
Entry 80,671.23
Stop Loss 78,052.44
Target (TP) 88,573.60
Resistance 82,260.90
Risk-Reward ~1:2.7 (approx)
📊 Analysis & Expectations
Bullish Bias: The chart suggests a long trade with a breakout strategy.
Volume and momentum confirmation will be key above resistance.
Resistance at 82,260.90 may cause a brief pullback before continuation to the target.
The stop loss is well-placed below a support zone and the most recent swing low.
✅ What to Watch For
Break and close above EMA 200 and resistance at 82.2K.
Bullish volume increase on breakout.
Price action around the entry zone (wait for confirmation candle if unsure).

BTCUSD - Liquidity Grab Above Resistance? Potential Reversal ?BTCUSD – Liquidity Grab Above Resistance? Potential Reversal Ahead
Timeframe: 1H
Pair: BTC/USD
---
Analysis Summary:
As per Our Previous Analysis,Bitcoin has broken above the major resistance near 85,000, tapping into an imbalance zone and grabbing external liquidity above previous highs. This move appears to be a classic liquidity grab, rather than a true breakout.
Key observations:
Price wicked above resistance into imbalance.
Potential trap for breakout traders.
Bearish signs developing with a possible trendline break.
---
Trade Plan:
Short on confirmation of trendline break or bearish structure.
Targets:
TP1: 80,000 (internal liquidity)
TP2: 78,000 (ex-liquidity)
TP3: 77,000 (external liquidity zone)
Stop Loss: Above recent swing high / 86,000
---
Market Sentiment:
Short-term bearish bias due to liquidity collection and imbalance reaction.
Also Keep In Mind :
Their is a Major Resistance above the Imbalance So If the Price break it then we have to be prepared for the other scenario of BTC
---
#Bitcoin #BTCUSD #CryptoTrading #SmartMoneyConcepts #LiquidityGrab #Imbalance #SupportResistance #TrendlineBreak #BearishSetup #Forex #CryptoAnalysis #PriceAction #TradingView #MarketStructure

BITCOIN - We've done it, We Broke over resistance and tested
WE ARE FREE
The dashed line is that line of resistance we been stuck under since ATH
Last week, we broke away from the Fib circle that has also held us down recently and we Shot up to theline of resistance and we broke over it.
~The 4 hour shows us more detail
You can see how we have broken over previously and Lost the line as support.
This time, we seem to be holding and the 1 hour chart shows this in more detail
However, we should take note of the MACD, that on lower time frames is now falling bearish on 1 hour and about to on the 4 hour.
We are Almost vertainly going to come back down and test that dashed line as support again.
I expect a possible range of PA 79K -80K lowest and then hopefully a stronger bouce to take us over that line os resistance we are surrently under.
Time will tell.....BUT I FEEL GOOD ;-)
BTC/USDT"For Bitcoin, this is what I see on the daily timeframe, and I think there's a good chance it'll make a bullish move. What do you think, buddy?"
Let me know if you want it more formal or more casual!

BTCUSDT 1DBTC ~ 1D Analysis
#BTC Let us now hope for a decisive breakout of the bullish pattern, signaling a potential end to this downtrend.

BTC bottom at 2D 200MA?I think we're following the fractal of 2021 bull market, and I was looking for similarities between the consolidation phase that came after the sharp decline. And in fact, there are some similarities.
The first test of the 200MA on the 2D chart and the build-up of a bullish divergence with a fakeout below the trend line on the RSI. It's not exactly the same, but I would say it's very similar.
This week should give a good bounce from the 2D 200MA for the fractal to remain relevant. In case of a breakdown, this idea is canceled.

SHORT TERM BTC PLAN - VERY CLEAR BUY AREABUY area is for blind bidding! Bounce is inveitable
If we have first bull trap towards SELL area, just sell..
np

BTC-----Sell around 81600, target 80500 areaTechnical analysis of BTC contract on April 11:
Today, the large-cycle daily level closed with a small negative line yesterday, and the K-line pattern was a single negative and a single positive. The price was at a low level, and the attached indicator was dead cross. However, the price fluctuation seemed large, but in fact there was no amplitude. Yesterday, the price fell, and the support rebounded in the early morning, basically smoothing out the decline. In this way, the current trend is still in correction, but it does not mean that you can take risks to go long. I think shorting at high levels is still the best choice; the short-cycle hourly chart showed that the decline in the European session continued in the US session yesterday, but it did not continue in the early morning but was a correction of the trend. The current K-line pattern is continuous positive, and the attached indicator is running in a golden cross. Yesterday, the high point of the opening of the decline was near the 82,500 area. Today, we still rely on this position for defense.
Today's BTC short-term contract trading strategy: sell at the rebound of the 81,600 area, stop loss at the 82,100 area, and target the 80,500 area;

Bitcoin Trade Setup: Bullish Breakout Targeting $87K!🔹 Key Levels Identified:
📌 Target Point: 87,008.21 USD 🏁🔵
👉 Expected price move (+9.07%) 🚀
📌 Entry Point: 79,719.00 USD ✅
👉 Suggested buying level in demand zone 🏦
📌 Stop Loss: 78,213.25 USD ❌🔻
👉 Risk management level 📉
📊 Technical Analysis:
📈 Trendline Support:
🔵 The price bounced off the trendline 📊, confirming an uptrend 📈
🔵 Demand Zone:
🟦 Marked blue area = Buyer interest 📊
💰 Expected reversal zone if price retests
📊 Moving Average (DEMA 9):
🔸 82,343.85 USD (current level)
🔺 Price slightly below DEMA ➝ possible bullish reversal 🚀
⚡ Trade Setup:
✔️ Risk-to-Reward Ratio:
🟢 Potential profit: +7,220.76 USD
🔴 Risk: -1,500 USD
📊 Favorable trade setup with high reward vs low risk ✅
✔️ Momentum Confirmation:
🟢 Above 79,719 USD = 🚀 Bullish breakout
🔴 Below 78,213.25 USD = ❌ Stop Loss triggered
🔮 Conclusion:
🔥 Bullish setup if price holds demand zone!
🚀 Target: 87,008 USD
⚠️ Manage risk with stop loss! 📉

BITCOIN weekly and 50 SMA - has VERY good newsAs you can easily See, despite all the unsettled News and events in recent days, the current Week candle has returned to GREEN having hit that 50 SMA.
To remind you, we began the week with a RED candle BELOW that 50 SMA.
This is Very important for sentiment. We bounced off that 50 back in 2024 and went to ATH.
To remind you, we have hit the 50 at the same time as the weekly MACD has entered a Bounce Zone, very near Neutral.
The MACD chart above shows you that the Histogram bar has also returned to White, showing a possible turn of favour from Bearish to Bullish.
BITCOIN IS SO READY TO GO
We just need the investors that are pouring money into the Snail called GOLD, to realise the Future is BITCOIN
We wait

Possible Bear MoveCurrently monitoring its bearish trend and identifying additional potential zones for shorting opportunities.

BTC-----Sell around 82100, target 80800-80300 areaTechnical analysis of BTC contract on April 10: Today, the large-cycle daily level closed with a big positive line yesterday. The K-line pattern was single negative and single positive. The price stood above the MA5 daily average line, but the attached indicator was dead cross. A single rise is difficult to become a trend and difficult to continue. In addition, when the large trend is still weak, there is no room for rise, so the current trend can only be regarded as a correction trend; from the four-hour chart, the current K-line pattern is continuous negative, and the pressure high point after the pullback is 83,600 area, and the price has not broken the correction high point position of the previous stage-by-stage decline. This is very obvious. The current K-line in the short-cycle hourly chart is continuous negative, and the attached indicator is dead cross, so whether the European session can continue is the key.
Today's BTC short-term contract trading strategy: sell directly at the current price of 82,100 area, stop loss at 82,600 area, and target 80,800 area and 80,300 area;

BTCUSDT | Waiting for Precision – Not Just Price LevelsMany were tempted to short BTCUSDT around the $83,000 region, and I was closely watching it too. However, as always, I don’t take trades based solely on price levels. What separates professional trading from guesswork is the data behind the scenes, and in this case, CDV (Cumulative Delta Volume) did not show any bearish divergence. That’s why I completely passed on this level without hesitation.
🎯 What’s Next?
Upper Blue Box is My Focus: I’ve now shifted my attention to the next key upper blue box, where I’ll be looking for serious short opportunities, but only if LTF confirmations such as orderflow shifts, CDV divergences, or volume traps appear.
Why I Wait: Just because a price hits a “zone” doesn’t mean we react. Professional traders wait for confluence, confirmation, and controlled risk.
🔒 Smart Trader Checklist:
No CDV divergence = No trade.
Wait for price to enter the upper blue box and react.
Short only with proper lower time frame confirmation.
If price breaks above with strong momentum and retest, I will not insist on shorts. I will shift and look for longs.
💡 I trade with precision and patience—not emotion. These levels are not random lines, but key zones mapped with advanced tools and strict discipline. That’s why my followers consistently win, and why my success rate is among the highest you’ll find here.
If you want to trade with clarity, confidence, and data-backed precision, just keep following me. You’ll see the difference.
📌I keep my charts clean and simple because I believe clarity leads to better decisions.
📌My approach is built on years of experience and a solid track record. I don’t claim to know it all but I’m confident in my ability to spot high-probability setups.
📌If you would like to learn how to use the heatmap, cumulative volume delta and volume footprint techniques that I use below to determine very accurate demand regions, you can send me a private message. I help anyone who wants it completely free of charge.
🔑I have a long list of my proven technique below:
🎯 ZENUSDT.P: Patience & Profitability | %230 Reaction from the Sniper Entry
🐶 DOGEUSDT.P: Next Move
🎨 RENDERUSDT.P: Opportunity of the Month
💎 ETHUSDT.P: Where to Retrace
🟢 BNBUSDT.P: Potential Surge
📊 BTC Dominance: Reaction Zone
🌊 WAVESUSDT.P: Demand Zone Potential
🟣 UNIUSDT.P: Long-Term Trade
🔵 XRPUSDT.P: Entry Zones
🔗 LINKUSDT.P: Follow The River
📈 BTCUSDT.P: Two Key Demand Zones
🟩 POLUSDT: Bullish Momentum
🌟 PENDLEUSDT.P: Where Opportunity Meets Precision
🔥 BTCUSDT.P: Liquidation of Highly Leveraged Longs
🌊 SOLUSDT.P: SOL's Dip - Your Opportunity
🐸 1000PEPEUSDT.P: Prime Bounce Zone Unlocked
🚀 ETHUSDT.P: Set to Explode - Don't Miss This Game Changer
🤖 IQUSDT: Smart Plan
⚡️ PONDUSDT: A Trade Not Taken Is Better Than a Losing One
💼 STMXUSDT: 2 Buying Areas
🐢 TURBOUSDT: Buy Zones and Buyer Presence
🌍 ICPUSDT.P: Massive Upside Potential | Check the Trade Update For Seeing Results
🟠 IDEXUSDT: Spot Buy Area | %26 Profit if You Trade with MSB
📌 USUALUSDT: Buyers Are Active + %70 Profit in Total
🌟 FORTHUSDT: Sniper Entry +%26 Reaction
🐳 QKCUSDT: Sniper Entry +%57 Reaction
📊 BTC.D: Retest of Key Area Highly Likely
📊 XNOUSDT %80 Reaction with a Simple Blue Box!
📊 BELUSDT Amazing %120 Reaction!
I stopped adding to the list because it's kinda tiring to add 5-10 charts in every move but you can check my profile and see that it goes on..

ETH/USDTbtc $85k is high liquidation and cme gap zone.
once these tariff headlines slow down bitcoin will be pulled toward these magnet levels

Bitcoin (BTC/USD) Technical Analysis – Bullish Setup🔵 Key Levels:
🎯 Target Point: 87,050.22 (🔼 Expected upward move)
🔵 Support Zone: 79,833.82 (🛡️ Strong demand area)
🔴 Current Price: 82,254.27
📊 Analysis:
🔵 RBS + RBR Zone (🔄 Role Reversal Support & Rally Base Rally) - Possible entry point for a long position.
🟠 Stop Loss: Below 79,833.82 (🚨 Risk Management)
🟣 Resistance Zone: Near 83,000 (🔄 Possible short-term pullback)
📈 Strategy:
1️⃣ Price might retrace to the blue zone (support) before continuing upward.
2️⃣ If it holds, 🚀 potential rally towards 87,050.22 🎯
3️⃣ If it breaks below support, ⚠️ possible downside risk.
✅ Conclusion:
A bullish setup with a 7.45% profit target 📊
Risk managed with a stop loss below support ⚠️
