Bitcoin Is About To SkyrocketHello, Skyrexians!
It looks like BINANCE:BTCUSDT has finally finished its correction. On the daily time frame we have the confirmation, now we are waiting for weekly close to make sure. With our prediction next wave to the upside is going to be the altcoin season wave, a lot of negative around the Trump's tariffs also confirms that.
Let's take a look at the weekly chart and remember our global forecast. The wave which has been finished in March 2024 was just a wave 1. Now price is printing wave 3. Notice that the minimal target for the wave 3 has been completed. This is the Fibonacci 1 level. Even if wave 3 has been already finished we will see higher high in the wave 5. But the main scenario is that this wave will be finished at 1.61 Fibonacci level, approximately at $140k. Anyway we will see which scenario market choose when Bitcoin will breaks $110k. Now we want to see the confirmation on the weekly by the green dot on Bullish/Bearish Reversal Bar Indicator .
Best regards,
Skyrexio Team
___________________________________________________________
Please, boost this article and subscribe our page if you like analysis!
Btcusdanalysis

BTC/USD Bullish Breakout Setup – Targeting $85,477 with 5.62% UpThe price has recently surged above both the 30 EMA (red) and 200 EMA (blue), signaling a strong bullish move.
The EMAs are beginning to turn upward, particularly the 30 EMA, suggesting short-term bullish momentum.
Key Levels Identified
Entry Zone (Purple Support Zone):
Around $80,105 – a potential buy zone after a pullback.
Labeled with STOP LOSS, indicating the invalidation level if price drops below this zone.
Target Zone (Purple Resistance Zone):
Around $85,477 – this is the target level, marked as “EA TARGET POINT”.
Offers a potential move of +5.62% or 4,551.83 points.
Price Action
Price broke above a previous resistance (now support) and has pulled back slightly.
The projected move suggests a bullish continuation after a minor pullback and consolidation.
Risk-Reward
Good risk-reward ratio implied with the large gap between the stop loss and target.
Stop loss is tight, just below the purple support zone (~$80,105).
Projection
The blue lines and annotations suggest a bullish play, with an expected upward movement after retesting the support.
✅ Possible Trade Idea
Buy Zone: ~$80,105 (on a confirmed retest)
Stop Loss: Slightly below $80,105
Target: ~$85,477
Expected Move: +5.62%
🔍 Additional Notes
Keep an eye on price behavior around the support zone—confirmation (e.g., bullish candle pattern or rejection wick) strengthens the entry.
The strong move leading to the breakout suggests high momentum, which could mean limited pullback.
News or macro developments could invalidate technicals—be aware of external factors.

BTC Bullish Setup Incoming? Watch This Key Level!15-Minute Timeframe Analysis
Hey Traders!
#Bitcoin has just formed a potential harmonic pattern on the 15-min chart, signaling the early stages of a bullish setup.
What we're seeing:
Harmonic pattern completion
Possible Bullish Divergence building up
Price approaching a strong resistance level
Plan of Action:
We’re watching closely for a clear breakout above the resistance—that’s our confirmation signal for a bullish trend continuation. Once confirmed, we’ll be looking to enter a long position with strict risk management in place.
Pro Tip: Patience pays! Wait for confirmation to avoid false breakouts.
What do you think? Will #BTC break resistance or get rejected? Drop your thoughts in the comments!
Follow me for more real-time trade ideas, technical setups, and risk-managed strategies!
#Bitcoin #BTCUSD #Crypto #TechnicalAnalysis #HarmonicPattern #BullishDivergence #PriceAction #BreakoutStrategy #CryptoTrading #RiskManagement #TradingView

Bitcoin - Watching For CapitulationI'm not going to try and predict whether not Bitcoin has begun what I believe to be its inevitable long term bear market, but I will look at some important trends and horizontal levels. For years, I've speculated that Bitcoin would have a hard time sustaining a significant new all-time high. It turns out, for the mean time, I've been correct in that assumption.
Bitcoin has now broken down from the ascending broadening wedge pattern that began in November, 2022. Here's the chart zoomed out:
There is still a chance for this to be a false breakdown, if buyers show up soon and take price back above that $87-90K resistance, which has become quite strong. However, ongoing global market news continues to remain bearish fundamentally, as many commodities and material objects will have to be repriced to the upside. At the same time, the FED is in a bind because if this causes a spike in unemployment, they will be more hesitant to lower rates, fearing greater inflation. This is the definition of stagflation.
In any case, zoomed in you can see that Bitcoin is in a downtrend channel - often a bullish pattern. My speculation is that Bitcoin will attempt to break down BELOW the channel, leading to a cascade of liquidations. This kind of drop can end around $69-71K on the shallow end, though can go much deeper from a structural standpoint. Outlined are all the support levels, and circled in red is a potential capitulation area.
If Bitcoin manages to bounce from the $60-70K level on high enough volume, depending on economic news, price can even make a new high. But we're not there yet by any means. This possibility is shown with the green arrow. On the other hand, if Bitcoin cannot bounce at the previous trend resistance (light blue line below the red local downtrend), price can retrace all the way towards $48-50K.
Let's see what happens!
Thanks for reading.
-Victor Cobra

BITCOIN NEW SWING UPDATESHello folks, crypto folks. bitcoin might go to 3.168 fibs. but only if price can go lower 60k below.
THe idea of zoning for entries are a big risk for it.
This is only my view, this is a continuation pattern.
lets trade it to swing.
check my comments below I post some cool. stuff
THis is not a financial advice.
FOllow for more

BTC/USD Long Setup – Bounce from Demand Zone Towards $80K TargetKey Zones
Demand Zone (Buy Zone)
🔵 $74,250 – $75,000
Strong support area
Buyers previously stepped in here
Marked for potential entry
Resistance Zone
🟣 $77,300 – $77,600
Mid-level resistance
Could cause a short pullback
Watch for breakout or rejection
Target Point
🎯 $80,273.49
Potential upside: +6.68% gain
Previous supply/structure zone
Take Profit (TP) zone
Stop Loss
⛔ $74,247.07
Just below the demand zone
Protects against invalid setup
Trade Idea
1. 🔽 Price expected to drop into demand zone
2. 🔄 Wait for bullish confirmation (e.g. bounce or engulfing candle)
3. 📈 Enter long position near $75,000
4. ⬆️ Ride it up through resistance
5. ✅ Target = $80,273 | ❌ Stop = $74,247

BTC at a Critical Inflection Point – Bulls vs. BearsBitcoin is currently trading around $77,644, sitting right between two major trendlines:
🟢 Long-Term Bullish Support – This green ascending trendline has held since late 2023, providing key support throughout BTC’s macro uptrend.
🔴 Medium-Term Bearish Resistance – The red descending trendline has capped price since the 2025 highs, forming a clear structure of lower highs.
We're now at a pivotal confluence zone where these two trendlines intersect. Price recently bounced off the green support, but it's struggling to decisively break above the red resistance.
🔍 Key Scenarios:
✅ Bullish Breakout:
A strong daily close above the red trendline could confirm bullish continuation.
Targets: $84K, GETTEX:92K , and potentially ATH breakout above $100K.
❌ Bearish Rejection:
Rejection at resistance may lead to a retest of the green trendline (~$74K).
A breakdown from there opens the door to GETTEX:64K –$60K, or even deeper pullbacks.

BTC/USD 1H Chart Analysis – Bearish Setup with SBR Rejection🔵 Key Zones & Levels:
🔷 SBR Zone (Support ➡ Resistance):
Price Range: ~$81,000–$83,000
🛑 Stop Loss: $83,002.31 (Just above resistance)
Expecting sellers to step in here if price retests this level
🟠 Mid-Range Zone:
Current price is consolidating just below SBR zone
Could form a lower high before dropping
🟦 Target Zone (Support Area):
🎯 Target Price: ~$75,000
Previous demand area – price bounced hard from here before
🔁 Trade Plan:
📉 Bias: Bearish
📍 Entry: Near current price or after retest of SBR zone
🛑 Stop Loss: $83,002.31
🎯 Target: $75,000 (approx -8.33%)
✅ Summary:
Risk-Reward: Appears solid (R:R > 2:1)
🕵️♂️ Watch for: Fakeouts or rejections in the SBR zone
🔻 Potential Move: -6,804 points if plan plays out

Daily BITCOIN Bull Bear candles showing return of the Bulls ?I have used this chart often and have posted it here on a number of occasions with out the Bull Power Bear Power Histogram by CEYHUN active.
This is how the chart Looks when it is active.
This indicator calculates trading action to determine if a Candle is Bullish or Bearish and is VERY ACCURATE
And, Currently, Today's candle is GREEN, for the first time in a LONG TIME.
We can see how the candles have remained RED for most of the Drop in channel.
But now, while we sit on support on a Fib Speed Resistance Fan, we are GREEN.
Long Term, we can see that the climb back to current ATH could be tough. The VRVP on the right is clearly showing rising levels of resistance we climb higher.
Currently, we need to watch closely, to see that candle remain Green and that we do not loose support here.
I feel Bullish

Bitcoin Formed a Double Bottom Bullish PatternFenzoFx—Bitcoin formed a double bottom bullish pattern. A consolidation phase toward $81,160 is imminent if the price holds above $74,475.
>>> Trade BTC/USD, swap free at FenzoFx Decentralized Forex Broker.
Bitcoin and 50 SMA on a WEEKLY chart - UPDATE Following on from the sharp drop in the beginning of the week, where PA dropped Below the 50 SMA ( RED) , PA has recovered and, as you can see, the candle Body is currently sitting ON the 50 SMA
We may need to remain in this area to bring back the Bullish Sentiment and then move higher.
It can be said that a bullish sentiment remains with Bitcoin as its did NOT crash as sharply as Stock Markets.
We are also now waiting on the MACD to fully enter the "Bounce Zone"
The Weeks candle on the histogram has returned to RED and so some caution is required here, while we wait.
It is the next few days that are crucial now. The "Tariff" dust us settling and countries are reacting to Trumps Tariff impositions.
My Gut feeling is VERY positive right now.
But that is just me,
Watch that candle on the 50 SMA like a Hawk. If we loose that again and the week closes below, THEN we need to think carefully

BTC - 4 Different Wider Looks at BTC1️⃣ Weekly EMA 55. Many legit touches.
2️⃣ Possible Elliot Wave in Log chart.
3️⃣ 4H EMA 200.
4️⃣ A valid Pitchfork since Dec 2024
Follow for more ideas/Signals. 💲
Look at my other ideas 😉
Just donate some of your profit to Animal rights and rescue or other charity :)✌️

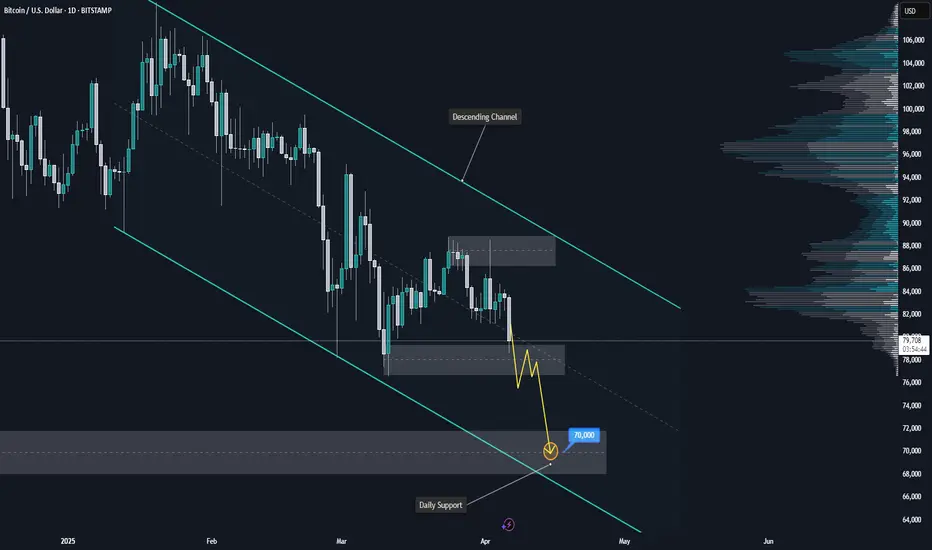
BITCOIN Downtrend Continues – Is $70K the Next Stop?COINBASE:BTCUSD continues to trade within a well-defined descending channel, maintaining a clear bearish market structure on the daily timeframe. After a strong rejection from the upper boundary of the channel, the price has retraced to a minor support zone around $78,000.
Given the prevailing momentum and strength of the broader downtrend, this support is likely to break under continued selling pressure. A clean breakdown below this level would reinforce the bearish bias and open the door for a move toward the daily support zone near $70,000, which aligns with the lower boundary of the channel.
This zone marks a potential area of interest where price may react or attempt a short-term bounce. However, unless there is a significant shift in momentum, the path of least resistance remains to the downside.
Traders should watch for confirmation of the bearish continuation, such as lower highs, weak bullish pullbacks, or increased volume on red candles, before considering short entries.
If you align with this outlook or have additional perspectives, feel free to share your thoughts below.
BTC/USDTafter reclaiming the 50-week ema,btc enters acceration.
if it fails to hold,then it's a bear market.

BTC SHORT TP:77,200 07-04-2025⚠️ Despite its recent recovery, Bitcoin is showing bearish patterns on the 1-hour and 2-hour timeframes. That's why I'm targeting a short at 77,300.
This analysis is based on those timeframes, so we expect it to develop in the next 12 hours; otherwise, it will be invalidated.
Follow me to stay updated and keep stacking those greens together! 💰🔥

$$$ BTCUSD MACRO-BULLISH $$$ 1W CHART $$$BITFINEX:BTCUSD 1W Chart
There are many reasons to look at this weekly chart and see that there's absolutely no reason to be bearish on Bitcoin yet.
Holding strong r/s flip support.
Holding regression trend.
Holding parabolic trend.
Stoch RSI at the bottom.
Weekly bullish divergence.
Assuming this plays out in a way that's similar to the last local bottom, the current target is around $134k-$135k.
It would take a lot to invalidate all of these bullish indicators, but if that does somehow happen, with a CLOSE of the weekly candle that invalidated these, then It's pretty much definitely over for a loooong time.
NFA blah blah blah..

Were To Buy BITCOINMartyBoots here , I have been trading for 17 years and sharing my thoughts on COINBASE:BTCUSD here.
.
BTC is very interesting chart for now that it has dipped 30% and trying to find support.
Do not miss out on BTC at the important levels as this will be a great opportunity
Watch video for more details

BTC-----Sell around 80700, target 79000 areaTechnical analysis of BTC contract on April 8: Today, the large-cycle daily level closed with a small positive line yesterday, and the K-line pattern was a single negative and a single positive. The main reason for the decline was the stimulation of the news, so there was no continuous negative pattern, but the price was below the moving average, and the attached indicator was dead cross and running downward. The decline in the general trend was very obvious. The current moving average pressure position was near the 81000 area. Although the current trend is very clear, we still need to remind everyone to pay attention to the risk of retracement. Risk control must be strictly done, because many friends have gambling nature and do it with large positions. Once the risk is not controlled, there will be a situation of liquidation; the short-cycle hourly chart has been continuously rebounding since yesterday's day. The current K-line pattern is the same, and the attached indicator is running in a golden cross. There is no signal of pressure, so we have to wait during the day, and use the daily moving average pressure as a defensive position.
Therefore, today's BTC short-term contract trading strategy: sell at the rebound 80700 area, stop loss at the 81200 area, and target the 79000 area;

Bitcoin Technical Breakdown – Bearish Channel in Motionhello guys.
🔻 1. Bearish Channel
Bitcoin is currently respecting a downward-sloping channel with lower highs and lower lows.
Every attempt to break the upper boundary has been met with rejection, confirming bearish pressure.
🔁 2. Retest of Former Trendline
The former ascending trendline (drawn from 2023’s bottom) was broken and recently retested as resistance, failing to flip it back to support.
This retest often signals confirmation of trend reversal.
🧱 3. Critical Support Zone: $62K– FWB:65K
This zone served as a strong accumulation range in the past and aligns with the current downside target.
____________________________
🔮 What’s Next?
Based on this pattern and price behavior:
Bitcoin may continue its bearish descent, following the projected zig-zag pattern in the channel.
The next significant bounce area lies around $64,000, aligning with both volume-based support and previous breakout zones.

BTC/USD) Bullish reversal analysis Read The ChaptianSMC Trading point update
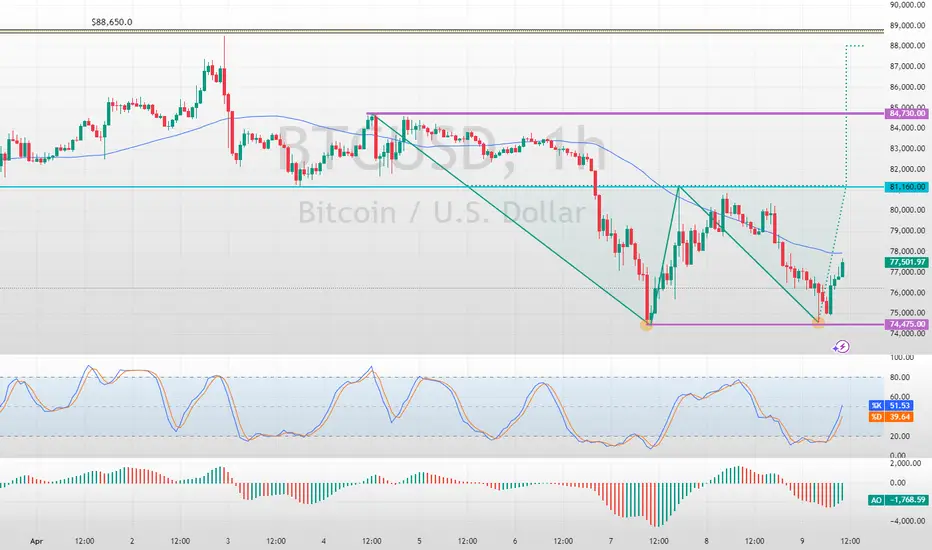
This is a bullish reversal analysis on BTC/USD (Bitcoin to USD) on the 4-hour chart, suggesting a potential long opportunity after a sharp corrective move.
---
Key Breakdown of the Chart:
1. Strong Downward Move with Potential Reversal:
Bitcoin experienced a sharp drop from the 88k region to ~74,387.50, now hitting a key demand zone (marked as "Orderblock").
2. Bullish Reaction Expected:
From the Orderblock support zone, a bullish reversal is anticipated.
The projected move aims to fill the imbalance and test the target zone between 87,152.94 and 88,557.14.
3. RSI Oversold:
RSI is around 32.27, indicating oversold conditions and adding confluence for a potential bounce.
4. EMA (200):
The 200 EMA lies around 85,153.85, which may act as dynamic resistance on the way up.
Mr SMC Trading point
5. Price Target:
The expected upside move is approximately +13,722.85 points (+18.75%), aiming for the supply zone above 87k.
---
Conclusion / Trade Idea:
Entry Zone: Near 74,387.50, the orderblock/demand area.
Target Zone: 87,152.94 – 88,557.14
Bias: Bullish short- to mid-term reversal.
Confluences: Oversold RSI, clean support zone, potential trendline bounce, and price inefficiency above.
---
Pales support boost 🚀 analysis follow)

BTCUSDT📊 Bitcoin Weekly Analysis – Smart Money Concept (SMC)
On the 1W BTC/USDT chart, we are currently observing a corrective move after a strong bullish impulse. The price is approaching a high-probability demand zone formed between two significant Fair Value Gaps (FVGs):
• 🔹 FVG 3M around $74,000
• 🔹 FVG M around $66,000
🟩 Long Setup Zone:
The area between these FVGs represents a discounted price zone where smart money is likely to step in. This is labeled as a “zone for long position” on the chart.
⸻
🧠 Smart Money Perspective:
• The market is in a retracement phase, targeting inefficiencies (FVGs).
• If price taps into this zone and shows signs of bullish intent (e.g., weekly bullish engulfing, BOS/CHOCH on lower timeframes), we can expect a strong upward move.
⸻
🎯 Mid-to-Long Term Target:
• Based on the current market structure and SMC model, the next major target is $130,000.
⸻
🔐 Risk Management:
• Ideal entry: within the FVG zone
• Stop-loss: below the lower FVG (around $65,000)
• Confirmation: bullish price action on lower timeframes or weekly candle close with strong momentum
⸻
📌 Conclusion:
This setup offers a potential high-reward opportunity if smart money reacts to this discounted zone. Patience and proper confirmation are key.
⸻

Bearish Bitcoin Faces Key ResistanceFenzoFx—Bitcoin trades bearishly below the critical resistance level of $81,160. If the price remains below this level, the downtrend will likely resume, targeting $74,000.

BTCUSDT 1DBTC ~ 1D Analysis
#BTC Let us now pray that the trade war will be completed so that this bullish pattern goes according to plan.
