Sell@97500, TP 96000 - 95000 - 94000🎉 Yesterday, I accurately predicted that the price of BTC would break through 97,000! 🚀 Now, a pullback is on the horizon ⬇️. Keep an eye on the support level at 93,000! 👀
⚡⚡⚡ BTCUSD ⚡⚡⚡
🚀 Sell@97500
🚀 TP 96000 - 95000 - 94000
Accurate signals are updated every day 📈 If you encounter any problems during trading, these signals can serve as your reliable guide 🧭 Feel free to refer to them! I sincerely hope they'll be of great help to you 🌟
Btcusdsell

Trading suggestions for BTCTwo days ago, I accurately predicted that the price of BTC would break through 97,500! 🚀
Currently, BTC is finding it difficult to break through the resistance level of 98,000 ⚠️. Given the current situation, it is recommended to decisively adopt a short-selling strategy at a high price level 📉.
⚡⚡⚡ BTCUSD ⚡⚡⚡
🚀 Sell@97500
🚀 TP 96000 - 95000 - 94000
Accurate signals are updated every day 📈 If you encounter any problems during trading, these signals can serve as your reliable guide 🧭 Feel free to refer to them! I sincerely hope they'll be of great help to you 🌟

Current Technical Analysis and Operational Suggestions for BTCCurrently, the price of BTC has established a strong support level around 96,000. This level precisely represents the cost line for short - term holders (STH), and its supporting effectiveness has been verified multiple times in past market trends. If the price stabilizes at this crucial level, a technical rebound is highly likely to be triggered.
From the perspective of the hourly chart, the consecutive six or seven bearish candlesticks reflect the concentrated release of bearish forces. However, it is necessary to closely monitor for the emergence of a "bullish divergence" signal, that is, when the price hits a new low for the period, but the MACD indicator does not reach a new low simultaneously. When the DIF line in the MACD indicator crosses the DEA line near the zero - axis to form a golden cross, and is accompanied by an increase in trading volume, it is generally regarded as a valid bullish signal.
Currently, if the green bars of the MACD indicator continue to shorten and the fast and slow lines tend to converge, this may be an omen of an impending short - term rebound. The long lower shadow on the candlestick chart demonstrates strong buying pressure at the low level, but this still needs to be verified in combination with the trading volume. If subsequent candlesticks can firmly stay above the high point of the long lower shadow, the effectiveness of the 96,000 support level can be confirmed. Once the price successfully stabilizes at 96,000 and the MACD golden cross is confirmed, the bullish signal will be further strengthened.
BTCUSD
buy@96000
tp:97000-97500
Investment itself is not risky; it is only when investment is out of control that risks occur. When trading, always remember not to act on impulse. I will share trading signals every day. All the signals have been accurate without any mistakes for a whole month. No matter what gains or losses you've had in the past, with my help, you have the hope of achieving a breakthrough in your investment.

In - depth Analysis of BTC: Can the 97,000 Target be Achieved?96000: This is the resistance level near the upper trend - line of the current ascending wedge. The price has tested this area several times but failed to break through effectively, indicating strong selling pressure at this level 💥.
⚡⚡⚡ BTCUSD ⚡⚡⚡
🚀 Buy@92000 - 93000
🚀 TP 95000 - 96000 - 97000
Accurate signals are updated every day 📈 If you encounter any problems during trading, these signals can serve as your reliable guide 🧭 Feel free to refer to them! I sincerely hope they'll be of great help to you 🌟

Analysis of the Current Trend of BTC and StrategiesIn terms of the current daily technical analysis of BTC, although the MACD indicator stabilizes above the zero line, the continuous shrinking of the red bars exposes the gradual weakening of the bullish momentum. The RSI (14) indicator flattens out around 60, confirming that the market has entered the correction phase after being in an overbought state. It is worth being vigilant that during this rebound process, the trading volume has been continuously sluggish, forming a sharp contrast with the breakout on heavy volume in March, which implies that the upward movement lacks effective capital to take over.
In terms of the K-line pattern, the consecutive three-day long upper shadows, combined with the pressure at the upper band of the Bollinger Bands, form a "Shooting Star" pattern, highlighting the heavy selling pressure from above. However, before confirming the downward correction trend, there may be a short-term rebound opportunity in the market to digest the floating chips. It is necessary to pay special attention to the key support level of 92,700. Once the closing price effectively breaks below this level, the short-term top will be confirmed, and the market trend may decline towards the integer level of 90,000.
BTCUSD
sell@94800-94500
tp:93500-93000
Investment itself is not risky; it is only when investment is out of control that risks occur. When trading, always remember not to act on impulse. I will share trading signals every day. All the signals have been accurate without any mistakes for a whole month. No matter what gains or losses you've had in the past, with my help, you have the hope of achieving a breakthrough in your investment.

Bitcoin at Bull-Bear Crossroads: Fear vs GreedCurrently, the price of BTC continues to be tested within the range of 95,500-96,000. The support level below shows a trend of gradually moving upwards, which is in line with the technical feature of "higher lows", indicating that the current market is in a bullish correction stage. The overall trend is moderately bullish, and there is still some upward potential in the short term as no overbought signal has emerged yet.
In terms of technical indicators, the Bollinger Bands show that the price is closely following the middle band, and both the upper and lower bands are continuously narrowing, which means that the market is about to make a directional choice. The upward momentum of the MACD indicator above the zero axis is constantly increasing, but we need to pay close attention to the potential risk of a bearish divergence at the top to prevent a trend reversal.
In terms of time periods, the ascending channel at the 4-hour level remains intact. If there is a short-term pullback, the support level near 86,000 is worthy of key attention. At the 1-hour level, the upward oscillation structure has not been damaged. If it can effectively break through the resistance level of 96,000, it is expected to open up a new round of upward space; conversely, the price may fall back to 94,000 to seek support.
Regarding the current short-term trading strategy, the price of BTC is maintained at the high end of the oscillation range. So, before there is a breakdown of the range, we can continue to initiate short positions first. After the price retraces to the low point, we can go long again and look for a rebound opportunity.
BTCUSD
sell@95000-95500
tp:94000-93500
Investment itself is not risky; it is only when investment is out of control that risks occur. When trading, always remember not to act on impulse. I will share trading signals every day. All the signals have been accurate without any mistakes for a whole month. No matter what gains or losses you've had in the past, with my help, you have the hope of achieving a breakthrough in your investment.

Buy@92000 - 93000 TP 95000 - 96000 - 9700096000: This is the resistance level near the upper trend - line of the current ascending wedge. The price has tested this area several times but failed to break through effectively, indicating strong selling pressure at this level 💥.
97500: It is a higher - level resistance target. If the price can strongly break through the 96000 resistance level and continue to rise, it may test this level 🎯.
⚡⚡⚡ BTCUSD ⚡⚡⚡
🚀 Buy@92000 - 93000
🚀 TP 95000 - 96000 - 97000
Accurate signals are updated every day 📈 If you encounter any problems during trading, these signals can serve as your reliable guide 🧭 Feel free to refer to them! I sincerely hope they'll be of great help to you 🌟

BTCUSD BEARISHMy calculations find that this asset, will indeed drop to the indicated price in coming days or weeks. This move will be overwhelmingly bearish.

BTCUSD 4 - Hour Chart Market AnalysisBTCUSD 4 - Hour Chart Market Analysis
I. Trends and Patterns 📈
Looking at the 4 - hour chart, the recent performance of BTCUSD has been characterized by complex fluctuations. In the earlier stage, there was a consolidation phase where the price oscillated within a relatively narrow range, forming a roughly rectangular consolidation pattern 📊. During this period, the forces of bulls and bears were relatively balanced 🤝, and the market was in a wait - and - see mode 🕵️. Subsequently, the price broke above this consolidation range and moved upward, indicating that the bulls had taken the upper hand 🐂, driving the price to gradually climb ⬆️.
Currently, the price is in an ascending wedge pattern, a common technical pattern. An ascending wedge is generally regarded as a reversal pattern. In an uptrend, although the price continues to reach new highs, the upward slope gradually flattens, suggesting that the bullish momentum is weakening while the bearish momentum is accumulating 🐻.
II. Key Support and Resistance Levels 📌
Support Levels
93000: This is a crucial support level, located near the lower trend - line of the ascending wedge and also a key low point during previous pullbacks. If the price moves downward, this level is likely to provide strong support. A break below this level may trigger further declines ⚠️.
91500: It is the upper edge of the previous consolidation range. If the price experiences a significant drop, this level may prevent the price from falling further sharply 🛑.
86000: It is the lower edge of the previous consolidation range. If the price continues to decline, this will be an important support line. A break below it may open up a larger downside space 📉.
Resistance Levels
96000: This is the resistance level near the upper trend - line of the current ascending wedge. The price has tested this area several times but failed to break through effectively, indicating strong selling pressure at this level 💥.
97500: It is a higher - level resistance target. If the price can strongly break through the 96000 resistance level and continue to rise, it may test this level 🎯.
⚡⚡⚡ BTCUSD ⚡⚡⚡
🚀 Sell@95000 - 94500
🚀 TP 93000 - 92000
🚀 Buy@92000 - 93000
🚀 TP 95000 - 96000
Accurate signals are updated every day 📈 If you encounter any problems during trading, these signals can serve as your reliable guide 🧭 Feel free to refer to them! I sincerely hope they'll be of great help to you 🌟

BTCUSD 4 - hour Chart AnalysisBTCUSD 4 - hour Chart Analysis
I. Trend Judgment
From the 4 - hour chart, BTCUSD is on an upward trend, consolidating at relatively high levels. Despite price fluctuations, bulls are still in control to some extent 🐂.
II. Key Levels
Support Area: The 90,000 - 91,500 range is a key support zone. The price has rebounded here multiple times, suggesting strong buying interest. If it drops back, it could be a buying opportunity 📈. 86,000 and 83,000 are additional lower - level supports.
Resistance Area: 95,000 is the resistance area. The price has faced hurdles here. If bullish momentum strengthens, breaking this could open up more upside 🚀.
III. Trading Strategies
Long - position Strategy: When the price retreats to the 90,000 - 91,500 support area and a bullish candlestick shows up, consider going long. Place stop - loss below the support and aim for 95,000. If broken, higher levels may follow 💰.
Short - position Strategy: Near 95,000, if a bearish candlestick appears with rising volume, try a small short position. Set stop - loss above resistance and target 91,500 - 90,000 ⬇️.
⚡⚡⚡ BTCUSD ⚡⚡⚡
🚀 Sell@95000 - 94000
🚀 TP 92000 - 91000
🚀 Buy@91000 - 92000
🚀 TP 94000 - 95000
Accurate signals are updated every day 📈 If you encounter any problems during trading, these signals can serve as your reliable guide 🧭 Feel free to refer to them! I sincerely hope they'll be of great help to you 🌟

Bitcoin Bearish Reversal Setup: Rising Wedge Breakdown Targeting1. Entry Point:
Marked around $86,853, this is where a potential short (sell) trade might have been initiated.
2. Stop Loss:
Placed above $88,783, protecting the trade in case the market goes against the position.
3. Target Point (Take Profit):
Aiming down toward $74,443.76, suggesting a large bearish move is anticipated.
4. EMA Indicators:
30 EMA (Red Line) at ~$84,271: Indicates short-term trend.
200 EMA (Blue Line) at ~$83,496: Indicates long-term trend.
Price is currently trading above the 200 EMA but slightly below the 30 EMA, showing mixed short-term momentum.

BTC/USD Short Setup – Triple Top Reversal with EMA Confirmation Entry Point (Sell): Around $85,699.52
Stop Loss: $86,741.44 (above resistance zone)
Target (Take Profit): $82,982.09
This provides a Risk-Reward Ratio of approximately 1:2, a commonly acceptable ratio in trading.
📈 Indicators:
EMA 30 (Red) is currently above the EMA 200 (Blue), indicating bullish momentum—but this setup anticipates a trend reversal.
If price breaks below the EMAs, that would confirm bearish strength.
🧠 Conclusion:
This setup is based on:
A strong resistance zone,
Bearish reversal pattern (triple top),
Risk management via stop loss and take profit levels.
If you're trading this:
Wait for confirmation with a bearish candlestick below the EMAs or a break of recent support.
Manage position size based on stop distance and your account risk tolerance.

"Bitcoin Bearish Reversal Setup: Supply Zone Short Strategy"🔵 SUPPLY ZONE (Resistance Area)
💥 Strong selling area around 85,800 - 87,800 USD
Historically, price got rejected here
Expect sellers to step in again
✍️ ENTRY POINT
📍 Just below the supply zone (~85,889.89)
Ideal for short position setup
Watch for bearish candlestick patterns for confirmation
🛑 STOP LOSS
❌ Placed above the supply zone at 87,796.97
Keeps risk under control if breakout happens
🎯 TARGET POINT (Support Area)
📉 Around 78,000 USD
Marked by previous support and structure
Great Risk-to-Reward ratio
📐 PATTERN WATCH
Looks like a harmonic pattern (maybe Gartley or Bat) 🦇
Suggests reversal from point D
Also resembles a rising wedge, which is bearish
📊 EMA (9-period)
🧭 Price hovering above the 9 EMA (84,704)
A break below it = bearish confirmation
Summary
🔻 Bearish bias
🛒 Short near supply zone
❌ SL above 87,800
🎯 TP around 78,000

Bitcoin (BTC/USD) Rectangle Pattern Breakdown – Bearish Move1. Overview of the Chart & Market Context
The chart provided represents Bitcoin (BTC/USD) on the 1-hour timeframe, published on TradingView. This analysis highlights the rectangle pattern formation, key support and resistance levels, and a potential short trade setup with defined risk management.
The market structure suggests a bearish outlook, as Bitcoin attempted to break above a resistance level but failed, leading to a sharp decline. The price action now indicates further downside movement, aligning with a rectangle pattern breakdown.
2. Rectangle Pattern Formation
What is a Rectangle Pattern?
A rectangle pattern is a consolidation phase where price moves sideways within a defined range, forming multiple touches at resistance and support before a breakout occurs. It can serve as a continuation or reversal pattern, depending on the breakout direction.
In this case, the pattern has resulted in a bearish breakout, indicating that sellers have taken control of the market.
Key Characteristics of This Rectangle Pattern:
The upper boundary (resistance) is at 88,333 USD, where price repeatedly failed to break higher.
The lower boundary (support) is at 78,044 USD, which acted as a strong floor but is now under pressure.
The price moved within this range for an extended period, showing a balanced battle between buyers and sellers.
A failed breakout at resistance, followed by a sharp rejection, signals a bearish reversal.
3. Breakdown of Key Levels & Market Structure
A. Resistance Level – 88,333 USD
This level has been tested multiple times, but price failed to hold above it.
The recent failed breakout led to a strong bearish rejection, confirming resistance.
The price action formed a bearish engulfing candlestick, adding to the bearish bias.
B. Support Level – 78,044 USD
This zone has previously provided multiple bounces, showing strong buying interest.
However, with the recent break below this level, it may now act as resistance.
If the price retests this area and fails to break above, it confirms a bearish continuation.
C. Price Rejection and Market Structure Shift
The formation of lower highs and lower lows signals a transition from consolidation to a downtrend.
The price broke out of the rectangle pattern to the downside, confirming a bearish breakout.
If the support at 78,044 USD fails, the price may continue dropping toward 73,678 USD.
4. Trade Setup & Execution Plan
🔹 Entry Strategy
A short position is initiated after the bearish rejection at resistance (88,333 USD).
The breakdown of the rectangle pattern strengthens the short setup.
The price may briefly retest the broken support (78,044 USD) before continuing downward.
🔹 Stop-Loss Placement
The stop-loss (SL) is placed above 88,333 USD, ensuring that if price moves against the trade, risk is minimized.
This protects against any unexpected bullish reversal.
🔹 Profit Targets (Take Profit - TP)
TP1: 78,044 USD (previous support level) – A conservative target.
TP2: 73,678 USD (deeper support) – If bearish momentum continues, this is the extended target.
Trade Component Details
Entry Short after rejection at 88,333 USD
Stop-Loss (SL) Above 88,333 USD
Take Profit 1 (TP1) 78,044 USD
Take Profit 2 (TP2) 73,678 USD
Confirmation Breakout & retest of support
Risk-Reward Ratio Favorable (defined SL & TP)
5. Expected Price Action and Market Behavior
🔻 Bearish Scenario (Most Likely Outcome)
The price will continue to fall towards TP1 (78,044 USD) due to selling pressure.
If 78,044 USD fails to hold, Bitcoin is likely to test the next major support level (73,678 USD).
The structure of lower highs and lower lows supports the downtrend.
🔺 Bullish Scenario (Invalidation of the Short Setup)
If Bitcoin breaks above 88,333 USD, the bearish outlook is invalidated.
This could signal a potential trend reversal or bullish breakout.
6. Technical Indicators Supporting the Analysis
Several technical indicators can be used to confirm the bearish outlook:
📉 RSI (Relative Strength Index):
If RSI is below 50, it confirms bearish momentum.
If RSI is oversold (<30), a temporary bounce may occur.
📉 Moving Averages:
If the 50-period MA crosses below the 200-period MA, it confirms a bearish trend.
If price is below both MAs, it strengthens the bearish setup.
📉 Volume Analysis:
A high selling volume during the breakdown indicates strong bearish conviction.
If volume spikes near support levels, a potential bounce could happen.
7. Summary of Key Findings
Pattern Identified: Rectangle pattern with a bearish breakout.
Market Structure: Price formed lower highs and lower lows, signaling a downtrend.
Trade Setup:
Short trade after rejection at 88,333 USD.
Stop-loss above 88,333 USD to manage risk.
Profit targets at 78,044 USD (TP1) and 73,678 USD (TP2).
Risk Management:
Clear stop-loss and take-profit levels ensure a controlled risk-to-reward ratio.
If price moves against the trade, the stop-loss prevents excessive losses.
Technical Indicators:
RSI, Moving Averages, and Volume Analysis confirm the bearish outlook.
8. Final Thoughts & Trading Plan Implementation
This analysis presents a high-probability bearish trade setup using the rectangle pattern breakdown strategy. With proper risk management, traders can execute this short trade with a structured plan.
🔹 Actionable Trading Plan:
Wait for price confirmation – If BTC retests the broken support (78,044 USD) and rejects, this strengthens the trade idea.
Execute the short trade – Once confirmation occurs, enter a short position.
Manage risk appropriately – Stick to the stop-loss above 88,333 USD.
Monitor price action – Adjust take-profit levels based on momentum and support breaks.
If the price invalidates the setup by breaking above resistance, it is crucial to exit the trade and re-evaluate the market conditions.
Conclusion:
This Bitcoin (BTC/USD) rectangle pattern breakdown analysis provides a clear bearish trade setup, supported by market structure, technical indicators, and price action. The well-defined entry, stop-loss, and take-profit levels ensure a structured risk-reward ratio, making this a viable short trade opportunity.

BITCOIN Breaking Down – Is $78K Inevitable?COINBASE:BTCUSD is continuing its bearish trend after rejecting from the resistance level within the descending channel. The price formed a converging triangle at this level and broke out to the downside, confirming strong selling pressure.
If sellers maintain control at this level, we could see a drop toward the $78,000 level, which aligns with a key support level. This zone could serve as a short-term target within the current bearish market structure. However, failure to break below this support zone could invalidate the bearish outlook and signal a potential rebound.
Traders should monitor bearish confirmation signals, such as weak pullbacks, lower highs, or increasing selling volume, before entering short positions.
If you agree with this analysis or have additional insights, feel free to share your thoughts here!

BTCUSDT SELL/ SHORTBy utilizing Fibonacci retracement levels, historical patterns, , we can formulate a hypothesis that the market might follow a similar trajectory if bearish sentiment prevails.
Bitcoin (BTC/USD) Breakdown – Rising Wedge Signals Further Drop!1. Chart Overview
This 4-hour BTC/USD chart from BITSTAMP presents a well-defined Rising Wedge pattern, which is a bearish reversal structure typically signaling an upcoming price decline. After a strong upward movement, Bitcoin formed a wedge pattern with higher highs and higher lows converging. This indicates weakening bullish momentum, leading to a confirmed breakdown.
2. Key Technical Elements & Market Structure
A. Rising Wedge Formation (Bearish Pattern)
A rising wedge is a bearish reversal pattern that appears after an uptrend, showing gradually weakening buying pressure.
The chart shows that price action was following an upward sloping support and resistance trendline.
The higher highs and higher lows formed within the wedge indicate a loss of bullish momentum.
Eventually, the price broke below the lower trendline, confirming a bearish breakdown.
B. Breakdown Confirmation
A decisive bearish candle broke below the wedge's lower trendline, confirming the downward move.
After breaking down, the price attempted a small retest of the wedge’s support, which has now turned into resistance.
This successful rejection from the previous support adds to the bearish confirmation.
C. Support & Resistance Levels
Resistance Level ($88,547):
This zone acted as a strong supply area, where previous bullish moves were rejected.
If BTC/USD attempts to recover, this area may provide selling opportunities.
Support Level ($79,193):
This is the next downside target, aligned with previous price consolidation zones.
A break below this support could trigger further selling pressure.
3. Trading Setup & Strategy
A. Short Trade Setup
Entry Point: After BTC/USD confirmed the breakdown of the rising wedge.
Stop Loss: Placed slightly above the $88,547 resistance level to limit risk.
Target Price: A decline towards $79,193, which aligns with the previous major support zone.
B. Bearish Market Sentiment
BTC/USD is currently trading below the wedge, reinforcing bearish bias.
A successful retest of the broken wedge support would validate further downside continuation.
If price remains below the $85,000 level, sellers are likely to maintain control.
4. Market Outlook & Next Price Action
Bearish Scenario
If BTC fails to reclaim the wedge breakdown level, further downside is expected.
A breakdown below $80,000 psychological level could increase selling momentum toward $75,000-$77,000 levels.
Volume analysis suggests that selling pressure is increasing.
Bullish Scenario (Invalidation)
If BTC/USD reclaims the $88,547 resistance and closes above it, the bearish bias could weaken.
Bulls need to break above the rising wedge resistance trendline for a reversal.
5. Conclusion & Trading Plan
The Rising Wedge pattern breakdown confirms a bearish outlook for BTC/USD.
The risk-reward ratio for a short trade is favorable, targeting a move down to $79,193.
Traders should watch for volume confirmation and trend continuation signals before entering.
Key Takeaways
✅ Bearish Bias confirmed after the Rising Wedge breakdown.
✅ Short Position setup with entry, stop loss, and target defined.
✅ Resistance at $88,547 - Failure to break above it strengthens the bearish case.
✅ Target at $79,193 - A strong support area where buyers may step in.
6. Tags for TradingView Post
#BTC #Bitcoin #Crypto #TradingSetup #TechnicalAnalysis #CryptoTrading #BearishPattern #RisingWedge #Breakdown #ShortTrade #PriceAction #SupportResistance #MarketAnalysis
Would you like any further refinements or additional insights? 🚀

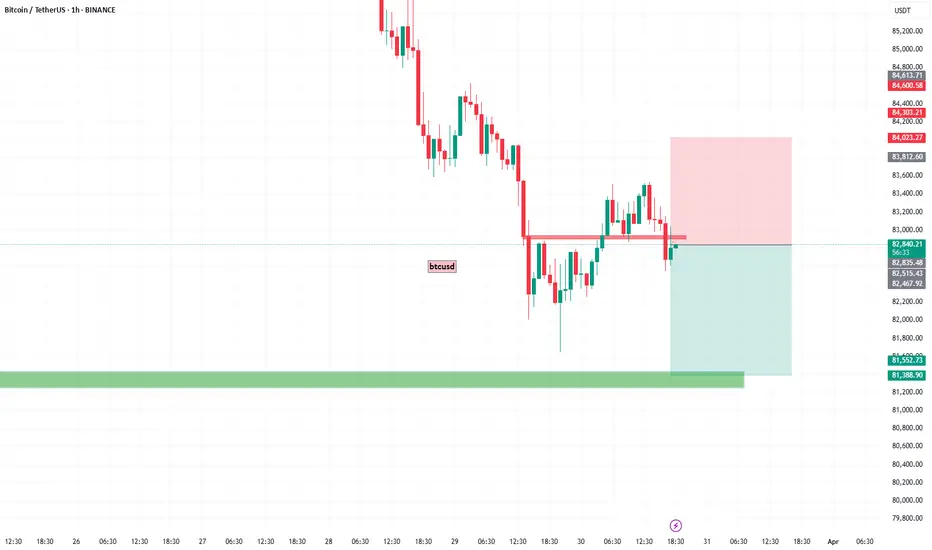
Is Bitcoin going to start rising?The latest U.S. economic data has brought significant impacts. The core PCE inflation witnessed a 0.4% month - on - month increase, hitting the highest growth in a year, with a year - on - year rise of 2.8%, exceeding market anticipations. Meanwhile, the long - term inflation expectation from the University of Michigan has soared to a 32 - year high, intensifying market concerns about inflation's resurgence. Currently, the market remains enveloped in macro - risks, pending a softening of market sentiment.
Turning to the Bitcoin market, as depicted in today's price trend (the current BTCUSDT price is $82,338.01, dropping by $2,086.37, a 2.47% decline), the K - line chart analysis indicates a downward trend. The Williams indicator signals an oversold condition. Additionally, trading volume has contracted recently, with both price and volume decreasing, suggesting a sluggish and inactive market.
Nevertheless, if Bitcoin can stabilize above $82,000 and there are signs of capital reflux, gradual position - building may be considered, with a target price set above $90,000. Investors must recognize that the Bitcoin market brims with uncertainties. Variables such as forthcoming U.S. economic data, regulatory policies, and geopolitical scenarios will all sway Bitcoin prices. In this volatile financial landscape, meticulous analysis and judicious decision - making are of utmost importance for investors navigating the Bitcoin market.
BTCUSDT
buy@82000-83000
tp:84500-86500
I will share trading signals every day. All the signals have been accurate for a whole month in a row. If you also need them, please click on the link below the article to obtain them.

Bitcoin Weekly Forecast | Rising Wedge Breakdown & Bearish MoveIntroduction
This Bitcoin (BTC/USD) 1-Day Chart Analysis highlights a critical market development: the breakdown of a Rising Wedge pattern, signaling a potential bearish trend. After reaching a new all-time high (ATH) resistance, BTC has shown weakness, confirming a possible reversal. This analysis covers key levels, trend structure, trading setups, and market psychology for traders looking to capitalize on this move.
1️⃣ Understanding the Chart Structure
Rising Wedge Pattern – A Classic Bearish Reversal
A Rising Wedge is a bearish technical formation that develops when prices rise within a narrowing range. It typically features:
✅ Higher Highs & Higher Lows: Suggesting bullish momentum, but the price action becomes weaker over time.
✅ Converging Trendlines: Showing a loss of buyer strength as each rally fails to make significant new highs.
✅ Volume Decline: As the wedge matures, volume decreases, confirming reduced buying interest.
✅ Breakdown Confirmation: A sharp drop below the lower trendline validates the bearish move.
In this case, BTC followed all the classic wedge characteristics, and its breakdown has initiated a potential major correction.
2️⃣ Key Levels & Market Dynamics
🔵 Resistance Level + All-Time High (ATH) (~$110K-$115K)
BTC reached its ATH resistance zone but failed to hold above it.
The red arrow indicates the rejection at the top, where strong selling pressure emerged.
Bulls attempted multiple breakouts but failed, leading to a reversal.
🟢 Support Zone (~$78K-$80K) – Weak Retest Before Breakdown
The price initially bounced off this support but struggled to hold gains.
The blue support level highlights a key zone where BTC found temporary stability.
A weak rally followed, but the price got rejected again, confirming the bearish trend.
🔻 Major Bearish Target (~$48,920)
Using the measured move theory, the projected drop extends to $48,920, a strong historical support.
The black arrow points to the expected downward trajectory.
3️⃣ Trading Setup & Risk Management
🔽 Bearish Trade Setup (Short Position Strategy)
For traders looking to short BTC based on this pattern, here’s an optimal trade setup:
🔸 Entry Point: Around $85K-$90K (post-retest of breakdown)
🔸 Stop Loss: Above $100K (invalidation of the bearish setup)
🔸 Take Profit Targets:
TP1: $75K (minor support)
TP2: $60K (psychological level)
TP3: $48,920 (final bearish target)
Alternative Scenario – Bullish Recovery?
If BTC reclaims $100K+ with high volume, the bearish thesis is invalidated, signaling a continuation of the uptrend.
A break above ATH ($115K) would confirm new bullish strength.
4️⃣ Market Sentiment & Psychological Factors
📉 Bearish Sentiment Strengthens:
Rising Wedges often cause a bull trap, where buyers expect new highs but get caught in a reversal.
Current price action suggests sellers are gaining control.
⚠️ Key Risks for Traders:
False breakdowns can occur if BTC sees unexpected bullish news.
Keeping an eye on fundamental developments (ETF approvals, macroeconomic conditions, etc.) is essential.
Conclusion – BTC Heading for a Deeper Correction?
Bitcoin’s Rising Wedge breakdown strongly suggests a continued bearish trend.
Short opportunities are ideal below $90K, with downside targets near GETTEX:48K -$50K.
If BTC regains $100K+, bearish outlook is invalid.
📊 Trading Recommendation: Monitor price action closely and adjust risk management accordingly!
Would you like me to tweak any part of this analysis? 😊

Bitcoin (BTC/USD) Trading Analysis – Rectangle Pattern Breakdown1. Market Overview
The BTC/USD chart (1-hour timeframe) illustrates a trendline-supported uptrend that eventually transitioned into a rectangle consolidation pattern before breaking downward. The market displayed signs of buyer exhaustion near the resistance level, leading to a rectangle pattern breakdown, confirming a bearish shift.
This analysis will break down the chart structure, key technical levels, potential trade setups, and risk management strategies for traders looking to capitalize on this move.
2. Breakdown of the Chart Structure
A. Trendline Breakout & Shift in Market Sentiment
The chart initially exhibits an ascending trendline, acting as dynamic support for Bitcoin’s price.
As long as BTC/USD remained above this trendline, the uptrend was intact.
However, once the price broke below the trendline with strong bearish momentum, it signaled a significant shift in sentiment from bullish to bearish.
The breakdown of the trendline also coincided with the rectangle’s lower boundary breakdown, confirming bearish strength.
B. Rectangle Pattern Formation (Consolidation Phase)
The price oscillated between resistance at $88,500 and support at $86,000, forming a rectangle consolidation pattern.
This pattern reflects a period of market indecision where buyers and sellers are in equilibrium.
Multiple failed breakout attempts at resistance signaled strong seller dominance, leading to eventual support failure.
The rectangle breakdown suggests that bears have gained control and a downward move is likely.
C. Breakdown Confirmation & Target Projection
The price broke below the lower support of the rectangle ($86,000) with increased selling pressure.
The bearish breakout was confirmed by strong red candles with high volume, reinforcing the downside move.
The height of the rectangle pattern provides a measured move target of around $83,797, aligning with previous support.
The momentum remains bearish, and price is likely to test this level before any reversal attempt.
3. Trade Setup & Risk Management
A. Ideal Trade Entry
Entry Point: After the price retested the broken rectangle support at $86,000, which now acts as resistance.
Confirmation: The rejection from this resistance with a bearish engulfing candle confirmed further downside.
Bearish momentum indicators, such as RSI and MACD crossovers, further validated the setup.
B. Stop-Loss Placement (Risk Management Strategy)
Stop Loss: Placed above the previous resistance zone at $88,969 to protect against false breakouts.
Rationale: If price moves back into the rectangle and surpasses resistance, the bearish setup becomes invalid.
C. Take-Profit Target & Risk-to-Reward Ratio
Target: $83,797, based on the rectangle pattern height projection and key support levels.
Risk-to-Reward Ratio: The setup offers a favorable risk-to-reward ratio, ensuring that potential gains outweigh potential losses.
4. Market Sentiment & Future Outlook
A. Bearish Continuation Outlook
The trendline failure, rectangle breakdown, and bearish candlestick patterns all suggest a continuation of the downtrend.
If price fails to reclaim support-turned-resistance ($86,000), further downside is expected.
Increased selling volume confirms bearish control.
B. Possible Bullish Reversal Scenarios
If BTC/USD bounces strongly from the $83,797 target zone, it could indicate buyer accumulation and lead to a bullish recovery.
A move back above $86,000 would invalidate the bearish outlook.
5. Conclusion
This BTC/USD analysis highlights a bearish rectangle pattern breakdown, reinforced by a trendline break and strong resistance rejections at $88,500. The breakout target is $83,797, where traders should monitor price action for further bearish continuation or potential reversal signs.
Traders should approach with caution, set appropriate stop-loss levels, and follow volume trends for confirmation of further price movements.

Bitcoin’s Next Move: Falling to $79K?This detailed technical analysis of Bitcoin (BTC/USD) on the 1-hour timeframe highlights a Rising Wedge pattern, key support and resistance levels, a trade setup, and projected price movements. The chart suggests a bearish breakdown, and traders can use this analysis to make informed decisions.
1. Understanding the Chart Pattern – Rising Wedge Formation
A Rising Wedge is a bearish reversal pattern that occurs when the price moves upwards within two converging trendlines. The slope of the lower trendline is steeper than the upper trendline, indicating weaker bullish momentum and an increasing probability of a downside breakdown.
📌 Key Observations:
The black solid trendlines outline the wedge pattern.
The price action remained inside this wedge from March 11 to March 26, 2025.
A breakdown has now occurred, confirming bearish momentum.
🔺 Why is this Bearish?
Rising Wedges are considered distribution patterns, meaning buyers are losing strength, and sellers are gradually taking control.
The price fails to make aggressive new highs and instead grinds upward weakly.
Once support is broken, a strong sell-off usually follows.
2. Key Chart Levels – Support & Resistance Zones
🔵 Resistance Level (Upper Bound of Wedge & Supply Zone)
The red arrow marks a strong rejection at $88,500 - $89,000, which acted as a major resistance level.
This zone has seen multiple failed breakout attempts, signaling that sellers dominate this area.
Stop-losses for short trades should be placed above this resistance zone.
🟢 Support Level (Lower Bound of Wedge & Demand Zone)
The wedge's lower boundary previously acted as strong support until it was breached.
The blue highlighted box represents a demand zone around $81,000, where buyers previously stepped in.
Losing this level could trigger a much stronger bearish move.
3. Breakdown Confirmation & Trading Setup
With the wedge broken to the downside, we now look for a confirmed bearish setup to enter a trade.
📉 Bearish Confirmation:
✅ The price broke below the wedge’s lower boundary, signaling a reversal.
✅ A retest of the broken wedge trendline confirms the breakdown.
✅ The price is now showing lower highs and lower lows, indicating a new bearish trend.
🎯 Trade Setup – How to Play This Move?
🔴 Entry for Short Position:
Enter short between $86,900 - $87,200 after confirming a rejection at the broken trendline.
🔵 Stop Loss:
Place a stop-loss above $89,282 to protect against a fakeout.
If BTC closes back inside the wedge, the short setup is invalidated.
🟢 Target 1: $81,000 – This is a key demand zone, and price might temporarily bounce here.
🟢 Target 2: $79,031 – This is the next strong support level, making it a final bearish target.
⚠ Risk Management Note:
Adjust position size based on risk tolerance.
Be mindful of short squeezes (where price temporarily spikes before continuing lower).
4. Expected Price Movement – Bearish Projection
🔮 The dashed black lines on the chart indicate a likely price pathway:
1️⃣ A breakdown below the wedge, followed by a minor retest of the broken trendline.
2️⃣ A continuation toward $81,000 (support level).
3️⃣ A small bounce before further decline.
4️⃣ The price reaching the final target of $79,031, where buyers may start accumulating again.
📌 If Bitcoin breaks below $81,000 with high volume, the bearish trend will likely accelerate.
5. Market Psychology & Trading Strategy
📌 Why This Setup Makes Sense?
The market exhibited exhaustion at the top of the wedge.
The break-and-retest confirms seller dominance.
The lower highs & lower lows show bearish momentum.
🚀 Alternative Bullish Scenario?
If BTC reclaims the wedge and breaks above $89,000, then the bearish setup is invalid.
A close above $89,500 would signal strong buying pressure and potential bullish continuation.
6. Conclusion – What to Watch Next?
🔎 Key Points to Monitor:
✔ Retest & rejection at $87,000 – $88,000 (confirming bearish momentum).
✔ Break of $81,000 to signal continuation toward the target.
✔ Stop-loss protection above $89,000 to manage risk.
📊 Final Thoughts:
The Rising Wedge breakdown suggests a shift from bullish to bearish sentiment.
This is a high-probability short trade with well-defined entry, stop-loss, and targets.
Traders should wait for price action confirmation before entering trades.
Would you like any refinements, or do you need further trade ideas? 🚀📉

BTC/USD Rising Wedge – Bearish Breakdown Ahead?Introduction: Understanding the Market Structure
This Bitcoin (BTC/USD) 4-hour chart presents a technical setup with a mix of bullish and bearish formations. The analysis focuses on key support and resistance zones, trendlines, and chart patterns to determine the next possible move.
🔍 The key takeaway? BTC has formed a Rising Wedge, a bearish reversal pattern, signaling potential downside unless a breakout invalidates the setup.
1. Market Structure & Current Trend Analysis
📌 Market in Curve Formation – The Accumulation Phase
Before the recent rally, Bitcoin was in a downtrend, making lower lows and lower highs, suggesting a period of price weakness.
However, price found strong support at around $77,600 - $80,000, forming a curved bottom structure—an early signal of an accumulation phase.
This bottoming pattern transitioned into a bullish uptrend, leading to the formation of a rising wedge.
🔹 Key Observations:
✔ Accumulation near $77,600 created a base for buyers.
✔ The gradual recovery curve suggests a shift from bearish to bullish momentum.
✔ Bitcoin later formed higher lows, confirming a temporary uptrend.
⚠ Shift in Momentum – The Rising Wedge Appears
The price rallied from the support zone but started forming a Rising Wedge pattern, which is typically a bearish signal.
A rising wedge indicates that although buyers are pushing prices up, they are losing momentum.
The narrowing price range suggests that sellers are entering at higher levels, weakening bullish strength.
2. Key Technical Levels to Watch
🔵 Resistance Zone ($92,000 - $94,957)
The shaded area near $92,000 - $94,957 is a major resistance level, where BTC previously failed to sustain a breakout.
This supply zone has been tested multiple times, reinforcing its strength.
The Stop Loss for short positions is placed above $94,957—any breakout above this level would invalidate the bearish setup.
🟠 Support Zone ($77,600 - $80,000)
The strong demand zone between $77,600 - $80,000 aligns with previous support levels.
If the rising wedge breaks down, this is the first major price target where BTC could find support.
A strong breakdown below $77,600 could lead to further declines toward $75,000 or lower.
3. The Rising Wedge Pattern – Bearish Warning!
🔍 What is a Rising Wedge?
A Rising Wedge is a bearish reversal pattern that forms during an uptrend when price moves within two converging trendlines.
It indicates that buyers are losing strength, and sellers are preparing to take control.
Once the lower trendline breaks, it confirms bearish momentum, leading to a price drop.
📝 Current BTC/USD Rising Wedge Analysis:
BTC has formed higher highs and higher lows, but the price range is narrowing.
The lower trendline is critical—a breakdown below this level could trigger a sharp decline.
The bearish target aligns with the support zone near $77,600.
4. Trading Plan – Possible Scenarios
📉 Bearish Breakdown Scenario (High Probability)
✅ Entry: Short BTC if the price breaks below the rising wedge (~$86,000 - $85,500).
✅ Stop Loss: Above $94,957 to protect against invalidation.
✅ Take Profit Target: $77,600 - $80,000 (first support level).
✅ Extended Target: If BTC drops below $77,600, watch for $75,000 - $72,000.
✅ Risk-Reward Ratio: Ideally 1:3 or higher for optimal trade management.
📈 Bullish Breakout Scenario (Low Probability but Possible!)
If BTC breaks and closes above $94,957, the bearish setup becomes invalid.
A confirmed breakout above resistance could push BTC towards $98,000 - $100,000.
Traders should wait for volume confirmation before entering long positions.
5. Risk Management & Final Thoughts
⚠ Risk Factors to Consider:
If BTC breaks the wedge with low volume, the move might be a false breakdown.
Macroeconomic events, such as interest rate decisions, can influence price behavior.
Watch for bullish divergences in indicators like RSI or MACD before shorting aggressively.
🔎 Conclusion:
The Rising Wedge pattern suggests a bearish reversal—a breakdown could send BTC toward $77,600.
Traders should wait for confirmation before entering trades.
If BTC breaks above $94,957, a bullish continuation could push it toward $100,000.
🔥 Bearish Bias Until Breakdown Confirmation!
Would you like an indicator-based analysis (e.g., RSI, MACD, or Moving Averages)? 🚀

BTCUSD:BTCUSD: SHORT, TP86600-85600BTCUSD now has an obvious double-head pattern, and the short opportunity is worth a try. There is support near 86600, followed by 85800. These can be used as two targets. If the support is strong during the fluctuation process, the order can be closed in advance.
