BTCUSDSHORTS

Shorts & Longs Charts - Side by SideSince my last (from FEB 19) idea regarding BTCUSDSHORTS and LONGS, there has been a lot of psychological manipulation in my opinion
The goal is to create a short squeeze thus doubling buy volume to reach a very high (5000 range) btc target.
SHORTS seem to be near a critical amount AND LONGS are at a vital last stand for massive opening of positions.
This is about as valid as charting the Market cap. Just for fun ;)


BTC Shorts are showing us it's time to get out!Last time we were in this territory we had a big crash.


btcusd - updateas per my comments yesterday seems we might see the small reversal i noted. now looking at it it might not be as big i as analysed. either way, any sign of bullish momentum, make sure you catch it.
See previous analysis
PLEASE SUPPORT THE MOVEMENT WITH YOUR LIKES, COMMENTS AND FOLLOW FOR MORE

BTCUSD - UPDATE FOR THE NEXT FEW DAYSCOULD THE BULLS FINALLY HAVE THE WINDS BEHIND THEIR SAILS?
TIME WILL TELL
TRADE SAFE
See previous analysis
PLEASE SUPPORT THE MOVEMENT WITH YOUR LIKES, COMMENTS AND FOLLOW FOR MORE

btc longs/shorts ratio analysisInterest in bitcoin is low, BAKKT decision is postponed, volume is down. These factors creates a high probability of a price going down.
trends.google.com

BTCUSD - WHAT IS NOW EXPECTEDPersonally, i am in favour of LONG on BTCUSD. so i am expecting more upside
1. Wait for it to break this line before shorting
this bad boy (see chart)
2. Breaking this top will give good Momentum
for buy. TP1 will be around $4400 and TP2
will be around $5100 (see chart)
See previous analysis
PLEASE SUPPORT THE MOVEMENT WITH YOUR LIKES, COMMENTS AND FOLLOW FOR MORE


Bitcoin Daily Update (day 299)Disclaimer: If you are primarily interested in copying other people’s trades then this is not for you. However, if you are willing to put in the work that it takes to learn how to trade for yourself then you have found the right place! Nevertheless please be advised that you can give 10 people a profitable trading strategy and only 1-2 of them will be able to succeed long term. If you fall into the majority that tries and fails then I assume no responsibility for your losses. What you do with your $ is your business, what I do with my $ is my business.
Click here for my Comprehensive Trading Strategy | Click here for my Comprehensive Trading Process | Click here to learn about the 2 BTC' to 20 BTC' Trading Challenge
Consensio: P > S MA > M MA > L MA = Fully bullish but currently challenging S MA.
Patterns: Phase 7 hyperwave | Symmetrical triangle / ih&s
Horizontals: Continues to be a lot of support in the $3,900 range which is my most bullish indicator right now. $4,100+ continues to be formidable resistance.
Trendline: Connecting to the top of the wicks from November 29th and December 24th for bear TL.
Parabolic SAR: $4,145 - right on the TL / top of the triangle
Futures Curve: The backwardation is more important to me (bullish) than the shorts heading back to support. They could spend a lot of time there while price rallies. However the spread is narrowing.
BTCUSDSHORTS: The way shorts are heading back to support is very bearish imo.
Funding Rates: Longs receive 0.04%
TD’ Sequential: G4
Ichimoku Cloud: Was checking the cloud today on some alts and was amazing how they are turning bullish while BTC’ is nowhere near that (traditional settings)
Relative Strength Index: Supporting > 50
Average Directional Index: Turning up while +DI diverges from -DI in a bullish manner but still too early to consider it a bull trend by the ADX.
Price Action: 24h: -0.4% | 2w: +6% | 1m: +12%
Bollinger Bands: Consolidating > MA during squeeze is bullish. MA turning down is bearish.
Stochastic Oscillator: Nearing overbought territory
Summary: Not much has changed. With the amount of support > $3,900 and the amount of resistance around $4,100 I am confident that the next move will be violent regardless of which way it breaks. That also leaves plenty of room to consolidate in a more narrow range toward the apex of the symmetrical triangle.
I considered cancelling my stop buy order on XBTH19 in favor of waiting for a close > than that area, but with the support and resistance becoming more defined and the range tightening I feel comfortable is in a good spot.
I find it very interesting how the daily cloud (traditional settings) on alts are turning bullish and threatening very nice long entries - if they can close above a thick cloud closely after the bullish Kumo twist. The best entries can happen when multiple signals come at once.
I am speaking of LTC and ETH specifically and it could be that they are front running a bounce... the cloud on BTC is nowhere near either of those metrics. Looks primed for one final dead cat bounce to trap in the last set of FOMO buyers who still have money before the rug gets pulled out from under their feet. Judging by social media there are still plenty of morons who have money and the market will remedy that before this bottom is found. Bitcoin dominance is at resistance (~50%) and appear to have just created a lower low, which is a strong signal of a potential alt bounce.
Again, if you want this bear market to end that this the last thing you want. We need BTC to break that resistance and get back over 80%.


BTCUSD - Bullish Dream BTCUSD looks like it'll soon follow ETH in its bullish moving ways.
ETH has broken out of an ascending triangle, after being bullish at resistance. BTC is painting a similar picture, and I fully expect it to do the same.
The targets are highlighted above. We're looking good so far.
Ultimate Target = $5500

BTCUSD - Simple BULLISH Inverse H/S - ExpectationThis is what I expect BTCUSD to do to start the New Year off
We are still quite oversold on macro timeframes, and this Inverse H/S everyone is watching is painting out like a work of art. This is what I expect to happen.
In the event the price breaks through the neckline (~$4300), long the bullish retest and enjoy the gains up to $5500!
Happy New Years!

Bitcoin - The Greatest Bear trap coming next(?)Update for Bitcoin:
The current state of Bitcoin is showing quite a lot of similarities than what we saw in June.
Back in then the price already had formed a bullish divergence which many people believed would had lead to an instant upward movement. Instead it got rejected by the resistance level and retested the previous low level which lead to an upward movement. Shorts were opened during this dip and it lead to failures.
Currently it's forming a bullish divergence, is at the bottom of the channel and it's getting rejected by the previous resistance level.
According this fractal study that I have created it's going to test the previous low and which makes bears to open more shorts but instead leads to an uptrend.
Keep in mind that fractal studies are generally showing different possibilities and what could happen if it follows something very similar what has happened in the past. Different market scenarios are never exactly a like but there might be changes due to the various reasons.
Trade careful out there!
If you come up with any questions feel free to ask!
Things to Remember:
Stop-loss orders are strongly recommended.
Fomos likely lead to a loss.
Do your homework before investing or trading.
DISCLAIMER:
Please be aware this is not financial advice. You are responsible for your trading and investing decisions. It is highly recommended to do your own research before investing in anything.
Yarr

BTCUSD Simple Bull Pennant/Flag - Dec 28thThis is a smaller time frame bullish continuation pattern that seems to be playing out.
Look for a touch of $4200+
This recent move is extremely bullish. The macro inverse h/s is surely playing out with a bigger target of ($5500).
Keeping things simple.
Stay safe.

BTCUSD Inverse H/S - Christmas EditionBTCUSD painting a very clear Inverse H & S pattern, on a fairly large time frame. A bull's dream in the making.
All eyes on this, to see if it plays out, we're 75% through forming this right shoulder
A target of $5500 in sight if this works out.
Keepin' things simple
Trade Safe, Happy Holidays!

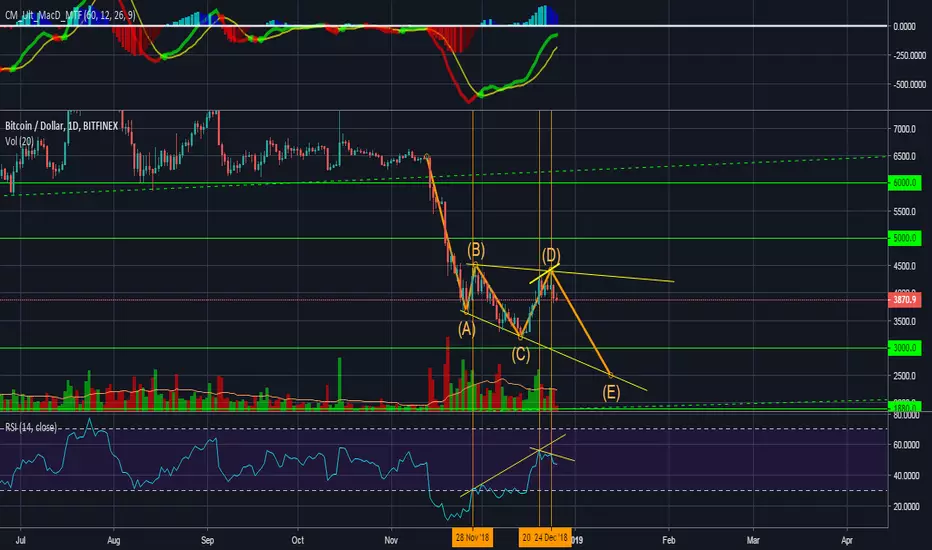
The Game of Bitcoin - Shorting BTCUSDBITFINEX:BTCUSD
Multiple divergences at the daily time frame shown with the yellow trend lines. $3800 crucial support. If this breaks, we are going down.
* Not an investment advice.
Revenge of the Bitcoin BullsShorts are at 42,000 a record high meanwhile we are currently sitting right above the 200 Weekly MA. Sentiment is extremely low but we must keep in mind that we are long overdue for bounce and with this many short outstanding and strong support nearby; it makes for a good set-up for bulls.
As of typing we are at $3500, the next rally could easily blow past $4,000 with many shorts liquidated and I think it'll likely happen pretty soon.

9EMA crossing 20EMA for BTCUSD shorts1. 9EMA crossing 20EMA
2. Bearish divergence noted in both RSI / MACD / Stoch
Bullish. At least for short term.

Can bitcoin be bullish short term?With all these bear market it seems that bitcoin could be bulish short term. We have clear divergance in the rsi and a channel that seems to be at the bottom.
What do ou think about this, do you see something else?
