BITCOIN's Trump effect: The 2025 PARABOLIC FINALE is coming!Bitcoin (BTCUSD) has completed 3 straight green 1W candles, making an impressive start into Q2 2025. But is it a coincidence or systemic behavior of technical trends?
It certainly is no coincidence the structure that the market has with Trump under President. Q1 has been undoubtedly disastrous due to the Trade War fueled by back and forth tariffs. But this is a pattern we've seen before and more specifically in Trump's 1st Term during Q1 2017.
As you can see, BTC was again under heavy volatility during Trump's 1st Term Q1, even though the correction wasn't as hard initially. What's more interesting however, is that in both Terms, the U.S. Dollar Index (DXY, blue trend-line) topped in Q1 and started collapsing. In 2017 that was the catalyst that fueled BTC's insane Parabolic Rally for the rest of the year.
Can the current Dollar collapse kick-start a rally for the rest of 2025? If the Trade War stabilizes, it certainly looks so. It is no coincidence that in 2017 Trump came out storming that the Dollar was too high just like he states now that the Interest Rates are too high, pressuring the Fed to cut.
So what do you think? Is the rest of 2025 destined to be as strong as 2017? Feel free to let us know in the comments section below!
-------------------------------------------------------------------------------
** Please LIKE 👍, FOLLOW ✅, SHARE 🙌 and COMMENT ✍ if you enjoy this idea! Also share your ideas and charts in the comments section below! This is best way to keep it relevant, support us, keep the content here free and allow the idea to reach as many people as possible. **
-------------------------------------------------------------------------------
💸💸💸💸💸💸
👇 👇 👇 👇 👇 👇
Btcusdsignals

BTC/USD) Short Setup: Triple Top Formation Targeting 86,023 USD You’re seeing a potential Head and Shoulders structure (or at least a triple top) — with the orange circles marking failure to break higher around $95K.
The neckline (support) is slightly diagonal down toward the $94K region.
A breakdown is anticipated once the neckline fails.
2. EMAs Interaction:
30 EMA (red) is currently flattening, showing weakening momentum.
200 EMA (blue) is far below, around 88,181 USD, acting as a major support zone — and it aligns with the projected EA TARGET POINT.
EMA compression usually precedes a strong move.
3. Zones and Key Price Levels:
Entry Point: ~95,145.60 USD → high-probability short sell.
Stop Loss: ~96,000–96,957 USD → protects against unexpected breakout.
Target: ~86,023 USD → aligns with past accumulation zone and EMA200.
4. Risk/Reward Ratio:
Potential reward is about 9–10%.
Risk (from entry to stop) is about 1–2%.
Excellent Risk/Reward (>4:1).
5. Momentum and Volume (implied, not shown):
Given the topping pattern and lack of higher highs, buying momentum is weakening.
If volume increases on a breakdown, confirmation will be strong.
📊 Strategic Points:
Aspect Analysis
Trend Still bullish, but topping signs visible
EMA Behavior Short-term EMA flattening, long-term EMA rising slowly
Pattern Formed Triple Top / Head and Shoulders
Risk/Reward Very good (>4:1)
Recommendation Short bias around entry level, with strict stop-loss
⚡ Quick Trading Plan:
Entry: Short at ~$95,145
Stop Loss: ~$96,000–96,957
Target: ~$86,023

BITCOIN $140k will come sooner than you think!Bitcoin (BTCUSD) eventually made the strong rebound we've been talking about on the highly important Support cluster of: a) the 1W MA50 (blue trend-line), b) the former All Time High (ATH) trend-line and c) the Higher Lows Zone of the current Bull Cycle.
This Triple Hold Move is expected to produce the strongest rally of the Bull Cycle, the Parabolic Rally. But even if it is similar to the 'weakest' rally of this Cycle, then we should be expecting at least a +92.94% rise from the bottom, which translates to a price marginally above $140000. And that could come as early as this August.
So do you think we'll be seeing a rally at least as strong as last year's? Feel free to let us know in the comments section below!
-------------------------------------------------------------------------------
** Please LIKE 👍, FOLLOW ✅, SHARE 🙌 and COMMENT ✍ if you enjoy this idea! Also share your ideas and charts in the comments section below! This is best way to keep it relevant, support us, keep the content here free and allow the idea to reach as many people as possible. **
-------------------------------------------------------------------------------
💸💸💸💸💸💸
👇 👇 👇 👇 👇 👇

BTCUSDT 1W AnalysisBTC ~ 1W Analysis
#BTC It is necessary to wait until this pattern is successfully broken to confirm a sustained bullish trend.

BTC TO THE MOON! or no?)I am closely analyzing Bitcoin’s (BTC) recent price action following its decisive break above the critical $88,700 resistance level. This breakout has shifted market dynamics, and several scenarios now appear plausible based on current structure and momentum:
Pullback and Continuation: BTC may experience a corrective move back to the $88,000–$89,000 zone, likely retesting the breakout level as support. For this bullish scenario to remain valid, BTC must reclaim and close above the prior monthly high (PMH) by the end of the current monthly candle, signaling strong buyer commitment and paving the way for further upside.
Immediate Advance with Later Correction: Alternatively, BTC could continue its ascent toward the PMH, potentially encountering resistance at this key level. A rejection here might trigger a retracement to the $88,000–$89,000 range, where buyers could step in to defend the newly established support.
Bearish Breakdown: Should BTC fail to hold above $88,000, a breakdown below this level could accelerate selling pressure, targeting the $83,000 region. Such a move would likely liquidate a significant number of leveraged long positions, amplifying volatility and potentially resetting the market for a deeper correction.
At the time of this analysis, BTC is trading at approximately $91,234, with a 24-hour high of $91,898 and a low of $90,123 as of April 24, 2025, reflecting heightened volatility post-breakout. Traders should monitor price action around the aforementioned levels, particularly the $88,000–$89,000 zone and the PMH, as these will be critical in determining the next directional move. Risk management remains paramount in this high-probability setup.

BTC may drop back to 90,000 pointsBTC is likely to pull back to around 90,000 points before starting to rebound.
In terms of capital flow, the upward momentum of XAU/USD has been temporarily halted ⏸️, and a large amount of capital is rapidly flowing into the virtual currency market 💸! As the leader of virtual currencies, Bitcoin has undoubtedly become an important destination for capital inflows 🌟. The injection of a large amount of capital has directly driven a significant surge in the price of BTC 📈. Capital chases profits just like water flows 🌊. Against the backdrop of the phased adjustment in the gold market, Bitcoin, with its unique technological attributes and market vitality, has attracted the attention of many investors, laying a solid capital foundation for its subsequent price increase 🏗️.
At the macro policy level, Trump's remarks have had a strong impact on the financial market 😲! His change in attitude towards Fed Chairman Powell has triggered the reallocation of market funds 🔄. When he previously threatened to remove Powell, investors' concerns about the Fed's policy intensified, and they flocked to the gold market for hedging, pushing up the gold price 🚀. However, Trump's latest statement that he will not fire Powell and his call for interest rate cuts have alleviated some of the investors' anxiety, prompting funds to flow back into US dollar - denominated assets 📉. It should be noted that during this process, some of the funds withdrawn from the gold market have not fully returned to traditional US dollar assets but have flowed into the virtual currency field such as Bitcoin 💥. As an emerging digital asset, Bitcoin has both certain hedging and speculative attributes, and has become a new safe haven and value - added target for funds 💰.
In international trade, Trump has shown signs of easing in the trade negotiations with China and is trying to reach an agreement quickly to reduce tariffs (although not to zero) 🤝. The past uncertainty in trade relations was one of the important factors driving up the gold price ⚠️. With the expected easing of trade tensions, potential future trade easing measures may suppress the market demand for gold as a safe haven asset ⏳. In contrast, the Bitcoin market is less directly affected by trade policies. Instead, due to its characteristics such as decentralization and global circulation 🌐, it has gained more favor during the process of capital reallocation. When the attractiveness of traditional safe haven assets declines, the scarcity and innovation of Bitcoin make it a new choice for investors to diversify risks and pursue returns 🎯, further stimulating the market demand for BTC 📈.
⚡⚡⚡ BTCUSD ⚡⚡⚡
🚀 Sell@92000 - 92500
🚀 TP 91000 - 90000
The market has been extremely volatile lately 📈📉 If you can't figure out the market's direction, you'll only be a cash dispenser for others 💰

BTC/USD) breakout up trand analysis Read The ChaptianMr SMC Trading point update
bullish analysis of Bitcoin (BTC/USD) on the 4-hour timeframe, showing a potential breakout and rally scenario. breakdown:
---
1. Market Structure:
Downtrend Channel: Price has been moving within a falling channel.
Double Bottom Pattern: Marked by two green arrows — a bullish reversal signal.
Breakout Attempt: Price is testing the upper trendline and 200 EMA (~$83,952), suggesting possible breakout.
---
2. Key Zones:
FVG (Fair Value Gap): Around $78,678 — a demand zone where price could retest before moving higher.
Breakout Confirmation Zone: ~$85,130 — breaking above this with volume signals strength.
Target Point: $95,206 — an upside target projecting ~31.77% gain from the breakout.
---
3. Indicators:
200 EMA: Currently acting as resistance. Break above it confirms bullish momentum.
RSI: Around 60 — pointing upward with bullish divergence from recent lows, showing increasing buying pressure.
---
4. Scenarios:
Scenario 1 (Bullish Continuation):
Breaks above trendline and 200 EMA.
Retest (optional) and then heads toward $95,206 target.
Scenario 2 (Retest First):
Price dips into the FVG/demand zone.
Finds support and launches upwards, confirming a strong base.
Mr SMC Trading point
---
Summary of the Idea:
This is a buy setup on breakout or on pullback:
Aggressive Entry: Break and close above $85,130.
Safe Entry: Pullback into $78,678 area (FVG).
Target: $95,206
Risk Zone: Below $78,000 (invalidates bullish structure).
Pales support boost 🚀 analysis follow)

Safe-haven funds continue to drive BTC higher.Yesterday, Bitcoin approached $94,000 with bulls maintaining strength, and $95,000 may become the next target. As a high-quality safe-haven asset, Bitcoin is currently still supported by uncertainties surrounding U.S. trade policies and the Federal Reserve's interest rate path. In trading operations, the strategy of going long on pullbacks should still be adhered to, with attention paid to the support level at $90,000 below.
BTCUSD
buy@93K-94K
tp:95K-96k
I hope this strategy will be helpful to you.
When you find yourself in a difficult situation and at a loss in trading, don't face it alone. Please get in touch with me. I'm always ready to fight side by side with you, avoid risks, and embark on a new journey towards stable profits.

Risk-averse funds drive BTC higher.The sharp collapse of the DXY has triggered violent fluctuations in the global monetary system. As risk aversion heats up, investors are adjusting their asset allocations, with substantial capital flowing into "digital gold," which has enabled BTC to break last week's sideways consolidation and initiate an upward trend.
BTCUSD
buy@86500-87500
tp:88500-89500
I hope this strategy will be helpful to you.
When you find yourself in a difficult situation and at a loss in trading, don't face it alone. Please get in touch with me. I'm always ready to fight side by side with you, avoid risks, and embark on a new journey towards stable profits.

BITCOIN Most POWERFUL Signal Activated—Former ATH IS NOW SUPPORTBitcoin (BTCUSD) completed two straight green 1W candles and has started off this week equally impressive, approaching 4-week Highs! This is a direct consequence of the 1W MA50 (blue trend-line) holding as a Support, similar to what happened on the last two Higher Lows of the 3-year Channel Up on August 05 2024 and September 11 2023.
The hidden catalyst perhaps behind this strong move may be the fact that the April 07 2025 Low, besides the 1W MA50, it also rebounded on the former All Time High (ATH) Resistance Zone (red), which now turned into Support (green). This is the Zone that started with the November 08 2021 Cycle High and rejected BT on March 11 2024, April 08 2024, June 03 2024 and July 29 2024.
As long as this critical Support cluster (1W MA50, 2021 ATH Zone) holds, we are expecting the 1W MACD to form a new Bullish Cross, the first since October 14 2024, which technically confirmed the new Bullish Leg of the 3-year Channel Up.
In fact all previous 3 Bullish Legs got confirmed by a 1W MACD Bullish Leg and the minimum the rose by was +105.30%. As a result, after the Bullish Cross is confirmed, we will be expecting to see at least $150000 on this current bull run.
But what do you think? Can this hugely important Support cluster lead Bitcoin to $150k? Feel free to let us know in the comments section below!
-------------------------------------------------------------------------------
** Please LIKE 👍, FOLLOW ✅, SHARE 🙌 and COMMENT ✍ if you enjoy this idea! Also share your ideas and charts in the comments section below! This is best way to keep it relevant, support us, keep the content here free and allow the idea to reach as many people as possible. **
-------------------------------------------------------------------------------
💸💸💸💸💸💸
👇 👇 👇 👇 👇 👇

BTCUSDT 1D Analysis UpdateBTC ~ 1D Analysis Update
#BTC Alright let's continue this bullish, a minimum of $ 130,000 - $ 150,000 in 2025.

"Bitcoin vs Tether" Crypto Market Heist Plan (Scalping/Day)🌟Hi! Hola! Ola! Bonjour! Hallo! Marhaba!🌟
Dear Money Makers & Robbers, 🤑💰✈️
Based on 🔥Thief Trading style technical and fundamental analysis🔥, here is our master plan to heist the "Bitcoin vs Tether" Crypto Market. Please adhere to the strategy I've outlined in the chart, which emphasizes short entry. Our aim is the high-risk Green MA Zone. Risky level, oversold market, consolidation, trend reversal, trap at the level where traders and bullish robbers are stronger. 🏆💸"Take profit and treat yourself, traders. You deserve it!💪🏆🎉
Entry 📈 : "The vault is wide open! Swipe the Bearish loot at any price - the heist is on!
however I advise to Place sell limit orders within a 15 or 30 minute timeframe most nearest or swing, low or high level for Pullback Entries.
Stop Loss 🛑:
📌Thief SL placed at the nearest/swing High or Low level Using the 4H timeframe (81000) Day/Scalping trade basis.
📌SL is based on your risk of the trade, lot size and how many multiple orders you have to take.
Target 🎯: 70000 (or) Escape Before the Target
"Bitcoin vs Tether" Crypto Market Heist Plan (Scalping/Day Trade) is currently experiencing a Bearish trend.., driven by several key factors.👇👇👇
📰🗞️Get & Read the Fundamental, Macro, COT Report, On Chain Analysis, Sentimental Outlook, Intermarket Analysis, Future trend targets... go ahead to check 👉👉👉🔗🔗
Detailed Point Recap 📋
Fundamentals 📊: Strong network + adoption ✅ offset regulatory risks ⚠️—moderately bullish 📈.
Macro 🌍: Inflation aids BTC 🥇, but tight policy/USD weigh ⚖️—mixed 🤔.
COT 📈: Institutional longs 📈 vs. leverage risks ⚡—cautiously bullish ✅.
On-Chain 🔗: LTH bullishness 📈 vs. STH selling 📉—leans positive but capped ⚖️.
Intermarket 🔄: Short-term bearish (equity/USD) 📉, long-term hedging 📈—mixed ⚖️.
Sentiment 😊: Neutral across cohorts ⚖️—lacking conviction 🤷.
Trends 🎯: Short-term downside ($70K) 📉 vs. long-term upside ($129K) 📈—context-driven 🔮.
Outlook 🌟: Neutral now ⚖️, tilting bearish short-term 📉, bullish long-term 📈.
⚠️Trading Alert : News Releases and Position Management 📰 🗞️ 🚫🚏
As a reminder, news releases can have a significant impact on market prices and volatility. To minimize potential losses and protect your running positions,
we recommend the following:
Avoid taking new trades during news releases
Use trailing stop-loss orders to protect your running positions and lock in profits
💖Supporting our robbery plan 💥Hit the Boost Button💥 will enable us to effortlessly make and steal money 💰💵. Boost the strength of our robbery team. Every day in this market make money with ease by using the Thief Trading Style.🏆💪🤝❤️🎉🚀
I'll see you soon with another heist plan, so stay tuned 🤑🐱👤🤗🤩

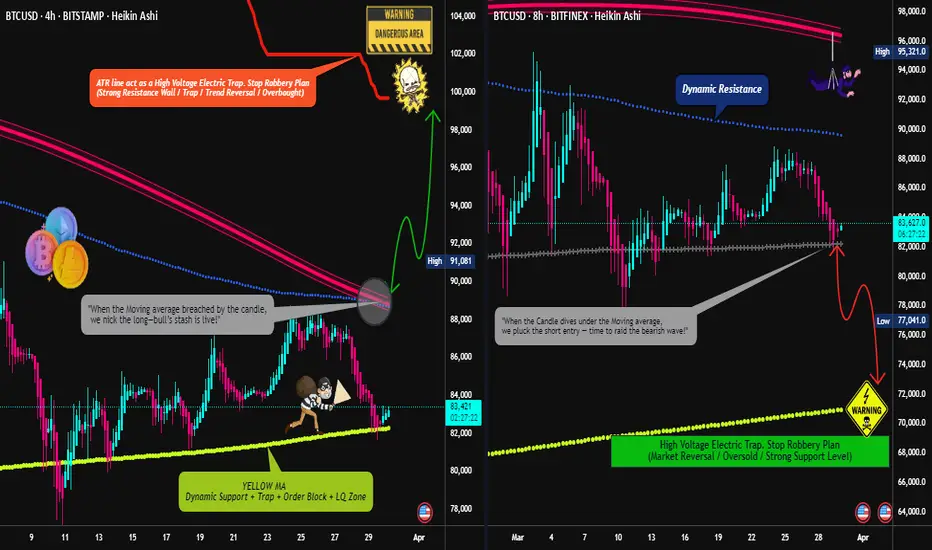
BTC/USD "Bitcoin vs U.S.Dollar" Crypto Market Heist (Swing/Day)🌟Hi! Hola! Ola! Bonjour! Hallo! Marhaba!🌟
Dear Money Makers & Robbers, 🤑💰✈️
Based on 🔥Thief Trading style technical and fundamental analysis🔥, here is our master plan to heist the BTC/USD "Bitcoin vs U.S.Dollar" Crypto Market. Please adhere to the strategy I've outlined in the chart, which emphasizes long entry and short entry. 🏆💸Be wealthy and safe trade.💪🏆🎉
Entry 📈 :
"The loot's within reach! Wait for the breakout, then grab your share - whether you're a Bullish thief or a Bearish bandit!"
🏁Buy entry above 89000
🏁Sell Entry below 81000
📌However, I recommended to place buy stop for bullish side and sell stop for bearish side.
Stop Loss 🛑:
🚩Thief SL placed at 84000 for Bullish Trade
🚩Thief SL placed at 88000 for Bearish Trade
Using the 4H period, the recent / swing low or high level.
SL is based on your risk of the trade, lot size and how many multiple orders you have to take.
Target 🎯:
🏴☠️Bullish Robbers TP 99000 (or) Escape Before the Target
🏴☠️Bearish Robbers TP 72000 (or) Escape Before the Target
BTC/USD "Bitcoin vs U.S.Dollar" Crypto Market Heist Plan is currently experiencing a neutral trend,., driven by several key factors.
📰🗞️Get & Read the Fundamental, Macro, COT Report, On Chain Analysis, Sentimental Outlook, Intermarket Analysis, Future trend targets.. go ahead to check 👉👉👉🔗
⚠️Trading Alert : News Releases and Position Management 📰 🗞️ 🚫🚏
As a reminder, news releases can have a significant impact on market prices and volatility. To minimize potential losses and protect your running positions,
we recommend the following:
Avoid taking new trades during news releases
Use trailing stop-loss orders to protect your running positions and lock in profits
💖Supporting our robbery plan 💥Hit the Boost Button💥 will enable us to effortlessly make and steal money 💰💵. Boost the strength of our robbery team. Every day in this market make money with ease by using the Thief Trading Style.🏆💪🤝❤️🎉🚀
I'll see you soon with another heist plan, so stay tuned 🤑🐱👤🤗🤩
BITCOIN's secret catalyst. The Gold-to-Crypto Rotation Is ComingBitcoin (BTCUSD) is attempting to form a new medium-term bottom here, following the Tariffs-led sell-off of the past 2 months. While the crypto market is consolidating and accumulating, the Gold market is smashing every historic All Time High (ATH) after the other.
This is not the first time we see this divergence between Gold and BTC and this is what historically delivers what we call 'Gold-to-Crypto Rotation'. This happens when Gold peaks, making its Bull Cycle Top, initiating a capital transition to BTC, hence starting the final rally of its Bull Cycle.
This has already taken place 3 times in its short history and Gold's sheer ferocity of the 2025 rally, indicates that we may possibly be about to repeat another one.
So what do you think is Gold about to top and offer a mass exodus a capital to Bitcoin, hence kickstarting a massive rally? Feel free to let us know in the comments section below!
-------------------------------------------------------------------------------
** Please LIKE 👍, FOLLOW ✅, SHARE 🙌 and COMMENT ✍ if you enjoy this idea! Also share your ideas and charts in the comments section below! This is best way to keep it relevant, support us, keep the content here free and allow the idea to reach as many people as possible. **
-------------------------------------------------------------------------------
💸💸💸💸💸💸
👇 👇 👇 👇 👇 👇

BITCOIN just triggered the ultimate post-Halving BUY SIGNAL!Bitcoin (BTCUSD) hit last week the top of the green Gaussian Channel (GC), a key indicator as last time it did (September 02 2024), kickstarted the massive 2024 rally towards the end of the year.
In fact, it can be argued that when BTC makes contact with the GC during a Bull Cycle, it is the ultimate pull-back Buy Signal after Halving events. More specifically, during the previous Cycle and after the May 2020 Halving, the price touched the GC three times (August 31 2020, July 19 2021 and September 20 2021), all of which were the most optimal pull-back Buy Entries as Bitcoin rebounded instantly.
So far during this Cycle and after the April 2024 Halving, this is the 2nd time the GC is tested. As mentioned the first also initiated an instant rebound. As a result, the current GC test is technically considered a very strong buy opportunity for the remainder of the Cycle, which based on the Time Cycles of the last 2 Cycle Tops, it should peak around October 06 2025.
So what do you think? If buying now towards a potential October 2025 Top, the perfect opportunity? Feel free to let us know in the comments section below!
-------------------------------------------------------------------------------
** Please LIKE 👍, FOLLOW ✅, SHARE 🙌 and COMMENT ✍ if you enjoy this idea! Also share your ideas and charts in the comments section below! This is best way to keep it relevant, support us, keep the content here free and allow the idea to reach as many people as possible. **
-------------------------------------------------------------------------------
💸💸💸💸💸💸
👇 👇 👇 👇 👇 👇

Bitcoin Bearish Reversal Setup: Rising Wedge Breakdown Targeting1. Entry Point:
Marked around $86,853, this is where a potential short (sell) trade might have been initiated.
2. Stop Loss:
Placed above $88,783, protecting the trade in case the market goes against the position.
3. Target Point (Take Profit):
Aiming down toward $74,443.76, suggesting a large bearish move is anticipated.
4. EMA Indicators:
30 EMA (Red Line) at ~$84,271: Indicates short-term trend.
200 EMA (Blue Line) at ~$83,496: Indicates long-term trend.
Price is currently trading above the 200 EMA but slightly below the 30 EMA, showing mixed short-term momentum.

BITCOIN Sell everything in October!Yep, kind of a clickbait title but it doesn't fail to serve justice to this very important Bitcoin (BTCUSD) chart.
Today's analysis displays in the most illustrative way the extremely tight symmetry between BTC's Cycles and how this can help us time our Sell at the Top of the Cycle and equally have the patience to buy as close to the next Bottom as possible.
As you see, in the past +10 years since the 2014 Bear Cycle, every Cycle has almost identical time ranges/ durations. All three Bear Cycles since then, lasted for approximately 1 year, and both Bull Cycles for almost 3 years (152 weeks, 1064 days to be exact). More specifically, the last two Bear Cycles were exactly 1 year long, the 2018 one started on the week of December 11 2017 and ended on December 10 2018 and the next Bear Cycle started on November 15 2021 and ended on November 07 2022. So it's been December-to-December and November-to-November Bear Cycles respectively.
If this high degree of symmetry continues to hold, counting 1064 days from the last Cycle Bottom o November 07 2022, gives a time estimate for the next Cycle Top on (the week of) October 06 2025. If also that holds for the Bear Cycle, expect an October-to-October duration, with an approximate bottom on October 12 2026.
So Sell everything up to October 2025 and Buy back as we get close to October 2026 is the strategy?
Feel free to let us know in the comments section below!
-------------------------------------------------------------------------------
** Please LIKE 👍, FOLLOW ✅, SHARE 🙌 and COMMENT ✍ if you enjoy this idea! Also share your ideas and charts in the comments section below! This is best way to keep it relevant, support us, keep the content here free and allow the idea to reach as many people as possible. **
-------------------------------------------------------------------------------
💸💸💸💸💸💸
👇 👇 👇 👇 👇 👇

BTC/USD Short Setup – Triple Top Reversal with EMA Confirmation Entry Point (Sell): Around $85,699.52
Stop Loss: $86,741.44 (above resistance zone)
Target (Take Profit): $82,982.09
This provides a Risk-Reward Ratio of approximately 1:2, a commonly acceptable ratio in trading.
📈 Indicators:
EMA 30 (Red) is currently above the EMA 200 (Blue), indicating bullish momentum—but this setup anticipates a trend reversal.
If price breaks below the EMAs, that would confirm bearish strength.
🧠 Conclusion:
This setup is based on:
A strong resistance zone,
Bearish reversal pattern (triple top),
Risk management via stop loss and take profit levels.
If you're trading this:
Wait for confirmation with a bearish candlestick below the EMAs or a break of recent support.
Manage position size based on stop distance and your account risk tolerance.

Shorting Analysis on Bitcoin - Fxdollars- {15/04/2025}Educational Analysis says that BTCUSD may give countertrend opportunities from this range, according to my technical analysis.
Broker - BITSTAMP
So, my analysis is based on a top-down approach from weekly to trend range to internal trend range.
So my analysis comprises of two structures: 1) Break of structure on weekly range and 2) External pushback to fill the remaining fair value gap
Let's see what this pair brings to the table for us in the future.
Please check the comment section to see how this turned out.
DISCLAIMER:-
This is not an entry signal. THIS IS ONLY EDUCATIONAL PURPOSE ANALYSIS.
I have no concerns with your profit and loss from this analysis.
I HAVE NO CONCERNS WITH YOUR PROFIT OR LOSS,
Happy Trading, Fx Dollars.

BITCOIN's ultimate VIX bottom signal-Last time gave +100% profitBitcoin (BTCUSD) is attempting to make yet another green day, yesterday not only did it close above its 1D MA50 again but was also the 4th green day in the last 6. This attempt is showing that the trend is gradually shifting again towards long-term bullish but today we'll present to you another one, this time in relation to the Volatility Index (VIX).
BTC's (orange trend-line) recent rise is naturally on a negative correlation with VIX (red trend-line) which is currently pulling back after it's most aggressive spike since the COVID flash-crash (March 2020).
Their ratio BTCUSD/VIX (blue trend-line) made a very interesting contact with the Higher Lows trend-line that has been holding since the August 24 2015 Low, which was the bottom of the 2014 Bear Cycle. Since then it made Higher Lows on March 16 2020, August 05 2024 and the most recent, April 07 2025. Every time it was a bottom indication and a massive rally followed. The 'weakest' of all was the previous one, which 'only' gave a +105% rise approximately. Based on that, there is no reason not to expect BTC to hit at least $150k by the end of this Bull Cycle.
Do you think that's a plausible target? Feel free to let us know in the comments section below!
-------------------------------------------------------------------------------
** Please LIKE 👍, FOLLOW ✅, SHARE 🙌 and COMMENT ✍ if you enjoy this idea! Also share your ideas and charts in the comments section below! This is best way to keep it relevant, support us, keep the content here free and allow the idea to reach as many people as possible. **
-------------------------------------------------------------------------------
💸💸💸💸💸💸
👇 👇 👇 👇 👇 👇

BTCUSD Today's strategyYesterday, the price of Bitcoin increased, but the trading volume decreased, weakening the short-term upward momentum. However, in the long run, the market has sufficient liquidity. The active trading of a large number of investors supports price discovery, and it is likely to drive up the price when there are favorable factors.
It should be noted that the cryptocurrency market is highly volatile and uncertain. Although we are bullish on the price of Bitcoin today, unexpected factors may change its trend. When making investment decisions, investors should assess their risk tolerance and operate with caution.
BTCUSD
buy@83500-84500
tp:85500-86500
I hope this strategy will be helpful to you.
When you find yourself in a difficult situation and at a loss in trading, don't face it alone. Please get in touch with me. I'm always ready to fight side by side with you, avoid risks, and embark on a new journey towards stable profits.

BITCOIN's 1D MA50 Flip = GREEN LIGHT for the NEXT BIG PUMP!Bitcoin (BTCUSD) closed Saturday's 1D candle above the 1D MA50 (blue trend-line) for the first time in more than 2 months (since February 03)! The 1D MA50 got tested and rejected the price 6 times since then. At the same time, the price marginally broke above the Lower Highs trend-line that started on the January 20 All Time High (ATH).
This is the most powerful short-term bullish combination as it was staged on a Bullish Divergence 1D RSI, which is on Higher Lows against the bearish trend's Lower Lows. Technically such break-outs immediate Target is the 2.0 Fibonacci extension, which now happens to be just below the $100k mark at $99500. In not such a coincidental fashion, that is he last Resistance level that run through February 05 - 21 before BTC's strong tariff sell-off.
So do you think the 1D MA50 break is the green light for a $99500 rally? Feel free to let us know in the comments section below!
-------------------------------------------------------------------------------
** Please LIKE 👍, FOLLOW ✅, SHARE 🙌 and COMMENT ✍ if you enjoy this idea! Also share your ideas and charts in the comments section below! This is best way to keep it relevant, support us, keep the content here free and allow the idea to reach as many people as possible. **
-------------------------------------------------------------------------------
💸💸💸💸💸💸
👇 👇 👇 👇 👇 👇

At present, a selling phenomenon has emergedAt present, a selling phenomenon has emerged😰, and a large number of traders are waiting for the market to open⏰.
When other markets open on Monday, the situation of a large amount of capital flowing out to other trading fields also deserves attention. 😟
Especially the flows to the XAU/USD and USOIL markets, or other foreign exchange markets. 💱 The movement of funds to these areas might be influenced by economic news, geopolitical events, or simply portfolio re - balancing by investors. 📰
💰💰💰 BTCUSD 💰💰💰
💰💰💰 BTCUSD 💰💰💰
🎯 Sell@84000 - 84500
🎯 TP 82500 - 81500
Recently, the market has been extremely volatile 😱, which has led to the clearing of many traders' accounts or significant losses 😫. You can follow my signals and gradually recover your losses and achieve profitability 🌟💪.
Traders, if you're fond of this perspective or have your own insights regarding it, feel free to share in the comments. I'm really looking forward to reading your thoughts! 🤗
