Bitcoin (BTC/USD) Long Trade Setup – Breakout Strategy with TargCurrent Price: $80,724.28
Entry Point: $80,671.23 (just above current price)
Stop Loss: $78,052.44
Target Point: $88,573.60
Resistance Point: $82,260.90
📈 Trend & Moving Averages
EMA 30 (red): $80,220.87 — Short-term trend.
EMA 200 (blue): $80,788.61 — Long-term trend.
The price is currently between the EMAs, indicating potential indecision or a shift in trend. A break above both EMAs with momentum would confirm bullish strength.
🔑 Trade Setup Summary
Element Level
Entry 80,671.23
Stop Loss 78,052.44
Target (TP) 88,573.60
Resistance 82,260.90
Risk-Reward ~1:2.7 (approx)
📊 Analysis & Expectations
Bullish Bias: The chart suggests a long trade with a breakout strategy.
Volume and momentum confirmation will be key above resistance.
Resistance at 82,260.90 may cause a brief pullback before continuation to the target.
The stop loss is well-placed below a support zone and the most recent swing low.
✅ What to Watch For
Break and close above EMA 200 and resistance at 82.2K.
Bullish volume increase on breakout.
Price action around the entry zone (wait for confirmation candle if unsure).
Btcusdsignals

BTCUSD Daily Trend Analysis is BullishAccording to my momentum analysis, BTCUSD confirmed Bullish trend on April 12, 2025 with entry price at 83624 and stop-loss at 74373. It is likely to continue the trend till 91980 and if breaks and closes above 91980, there is a possibility of hitting the target at 102754.

BTCUSDT 1DBTC ~ 1D Analysis
#BTC Let us now hope for a decisive breakout of the bullish pattern, signaling a potential end to this downtrend.

BITCOIN Can it start an insane rally on CHEAP MONEY??Bitcoin (BTCUSD) seems to be at a point where it last was at the beginning of its current Bull Cycle in October 2022. And that's the point where the Global Liquidity Cycle Indicator (black trend-line) bottomed and started rising, confirming the more on Higher Lows.
This huge buy formation has been present on every BTC Cycle, usually at its bottom (but on the 2015 case, a little after) and signaled the huge monetary supply into the global markets, which translates into rising prices and rallies.
This is the first time we see the same rising liquidity formation twice in a Cycle. Can this be the driving force that BTC needs for its final and strongest parabolic rally of the Cycle towards the end of the year?
Feel free to let us know in the comments section below!
-------------------------------------------------------------------------------
** Please LIKE 👍, FOLLOW ✅, SHARE 🙌 and COMMENT ✍ if you enjoy this idea! Also share your ideas and charts in the comments section below! This is best way to keep it relevant, support us, keep the content here free and allow the idea to reach as many people as possible. **
-------------------------------------------------------------------------------
💸💸💸💸💸💸
👇 👇 👇 👇 👇 👇

BITCOIN Are we back in business?Bitcoin (BTCUSD) made a miraculous comeback yesterday as it rebounded with force almost +12% from its session Low, following the 90-day tariff pause news. This rebounded has been performed on both the 1W MA50 (blue trend-line), which has been the key long-term Support of this Bull Cycle, but also on the previous High line, which is the trend-line coming from the previous Higher High of the Bull Cycle that has now turned Support.
As you see, during every Bull Cycle correction, this previous High line held both times before and it is doing so this time also. This justifies the incredible symmetry of this Bull Cycle but it doesn't only stop on the uptrend structure but goes back to the downtrend structure of the Bear Cycle. As you see, the extension of those previous High lines intersect the Lower Highs of the Bear Cycle. Symmetry at its very best.
At the same time, back to the current Bull Cycle, we see that the Vortex Indicator (VI) has already diverged, which has been consistent to both previous bottoms.
As far as what the target of this potential rebound/ rally can be, both previous main rallies hit at least the 1.618 Fibonacci extension. That sits now at $175000.
So do you think this Double Support rebound combo is putting BTC back in Bull Cycle business for a rally to $175k? Feel free to let us know in the comments section below!
-------------------------------------------------------------------------------
** Please LIKE 👍, FOLLOW ✅, SHARE 🙌 and COMMENT ✍ if you enjoy this idea! Also share your ideas and charts in the comments section below! This is best way to keep it relevant, support us, keep the content here free and allow the idea to reach as many people as possible. **
-------------------------------------------------------------------------------
💸💸💸💸💸💸
👇 👇 👇 👇 👇 👇

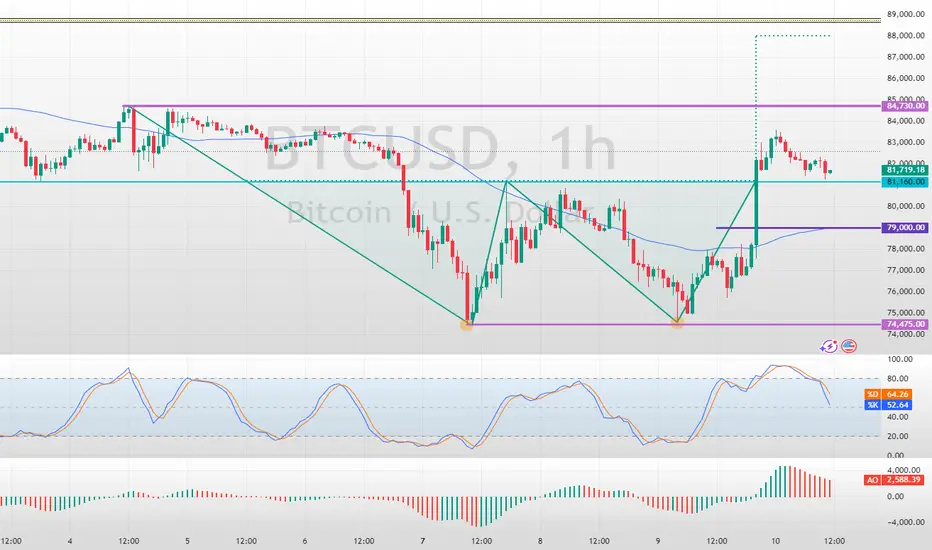
Bitcoin Double Bottom Pattern Came into PlayFenzoFx—Bitcoin jumped upward from $74,475 support as expected due to the formation of a double bottom pattern on the 1-hour chart, which is a bullish signal.
As of this writing, the price is stabilizing and testing the $81,160 mark as support. However, the 50-SMA on the 1-hour chart serves as the pivot point between the bull and bear market.
The next bullish target could be $84,730, followed by $88,000 if BTC holds above the discussed moving average.
Trade BTC/USD Swap Free at FenzoFx Decentralized Broker
BTC/USD Bullish Breakout Setup – Targeting $85,477 with 5.62% UpThe price has recently surged above both the 30 EMA (red) and 200 EMA (blue), signaling a strong bullish move.
The EMAs are beginning to turn upward, particularly the 30 EMA, suggesting short-term bullish momentum.
Key Levels Identified
Entry Zone (Purple Support Zone):
Around $80,105 – a potential buy zone after a pullback.
Labeled with STOP LOSS, indicating the invalidation level if price drops below this zone.
Target Zone (Purple Resistance Zone):
Around $85,477 – this is the target level, marked as “EA TARGET POINT”.
Offers a potential move of +5.62% or 4,551.83 points.
Price Action
Price broke above a previous resistance (now support) and has pulled back slightly.
The projected move suggests a bullish continuation after a minor pullback and consolidation.
Risk-Reward
Good risk-reward ratio implied with the large gap between the stop loss and target.
Stop loss is tight, just below the purple support zone (~$80,105).
Projection
The blue lines and annotations suggest a bullish play, with an expected upward movement after retesting the support.
✅ Possible Trade Idea
Buy Zone: ~$80,105 (on a confirmed retest)
Stop Loss: Slightly below $80,105
Target: ~$85,477
Expected Move: +5.62%
🔍 Additional Notes
Keep an eye on price behavior around the support zone—confirmation (e.g., bullish candle pattern or rejection wick) strengthens the entry.
The strong move leading to the breakout suggests high momentum, which could mean limited pullback.
News or macro developments could invalidate technicals—be aware of external factors.

BITCOIN Can a USD sell-off save the Cycle?Bitcoin (BTCUSD) is hanging on its 1W MA50 (blue trend-line) amidst the market chaos and especially following last night's stronger 104% trade tariffs to China from the U.S.
This is a simple yet powerful classic chart, displaying Bitcoin against the U.S. Dollar Index (DXY, black trend-line). This shows the long-term negatively correlated pattern they follow on their Cycles.
Every time DXY entered an aggressive sell-off in the final year of the 4-year Cycle, Bitcoin started its final parabolic rally of its Bull Cycle. This time the DXY peaked exactly at the start of the year (2025) and is on a selling sequence up until today but due to the ongoing Trade War, BTC not only didn't rise but is on a correction too.
Can an even stronger DXY sell-off save the day and complete the 4-year Cycle with a final rally? Feel free to let us know in the comments section below!
-------------------------------------------------------------------------------
** Please LIKE 👍, FOLLOW ✅, SHARE 🙌 and COMMENT ✍ if you enjoy this idea! Also share your ideas and charts in the comments section below! This is best way to keep it relevant, support us, keep the content here free and allow the idea to reach as many people as possible. **
-------------------------------------------------------------------------------
💸💸💸💸💸💸
👇 👇 👇 👇 👇 👇

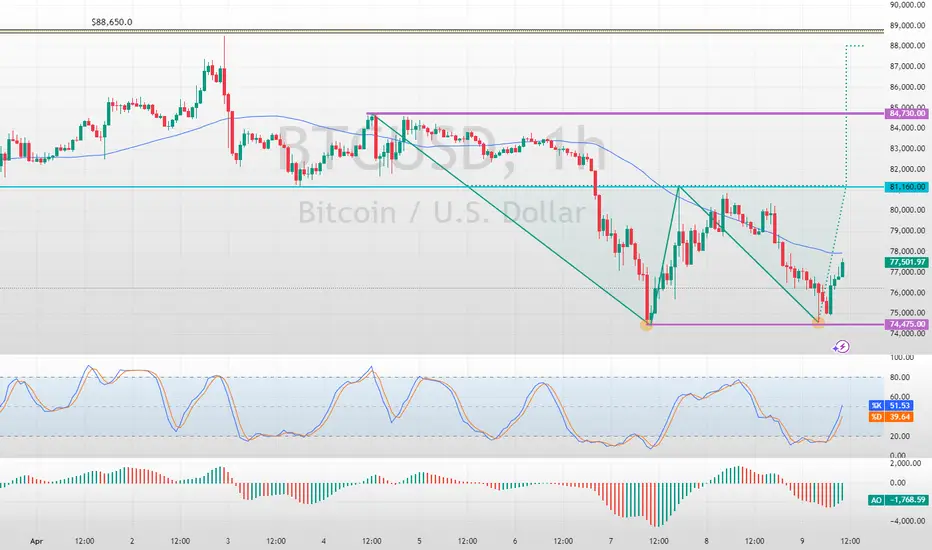
Bitcoin Formed a Double Bottom Bullish PatternFenzoFx—Bitcoin formed a double bottom bullish pattern. A consolidation phase toward $81,160 is imminent if the price holds above $74,475.
>>> Trade BTC/USD, swap free at FenzoFx Decentralized Forex Broker.
BTCUSD hourly trend analysis for April 09, 2025BTCUSD made a double bottom formation. Any upward move will test the resistance at 80,047 and there is a strong support at 73,481. The Timing indicator is bullish from April 10th onwards. Trade with stop loss.

BTC/USD) Bullish reversal analysis Read The ChaptianSMC Trading point update
This is a bullish reversal analysis on BTC/USD (Bitcoin to USD) on the 4-hour chart, suggesting a potential long opportunity after a sharp corrective move.
---
Key Breakdown of the Chart:
1. Strong Downward Move with Potential Reversal:
Bitcoin experienced a sharp drop from the 88k region to ~74,387.50, now hitting a key demand zone (marked as "Orderblock").
2. Bullish Reaction Expected:
From the Orderblock support zone, a bullish reversal is anticipated.
The projected move aims to fill the imbalance and test the target zone between 87,152.94 and 88,557.14.
3. RSI Oversold:
RSI is around 32.27, indicating oversold conditions and adding confluence for a potential bounce.
4. EMA (200):
The 200 EMA lies around 85,153.85, which may act as dynamic resistance on the way up.
Mr SMC Trading point
5. Price Target:
The expected upside move is approximately +13,722.85 points (+18.75%), aiming for the supply zone above 87k.
---
Conclusion / Trade Idea:
Entry Zone: Near 74,387.50, the orderblock/demand area.
Target Zone: 87,152.94 – 88,557.14
Bias: Bullish short- to mid-term reversal.
Confluences: Oversold RSI, clean support zone, potential trendline bounce, and price inefficiency above.
---
Pales support boost 🚀 analysis follow)

BITCOIN Is it still on track with past Cycles??Bitcoin (BTCUSD) saw a strong correction last week as well as early trade yesterday on Monday, along with all major stock markets, but had an equally impressive round on Wall Street opening, which keeps it so far above its key 1W MA50 on a potentially weekly closing.
So the critical question now is this: Will it continue the pattern of past Cycles and give one more major rally in 2025?
Well based on the BTC Rainbow Waves, it is still on track and actually in a similar situation as July 2013 when after a 3-month correction/ pull-back sequence, it got back to the Blue Buy Zone and near the Fair Value green trend-line.
As you can see all Cycles peaked on the Red Zone and so far on this Cycle we haven't even reached the 1st orange trend-line. Based on the Time Cycles, the next peak should be around November 2025 and if the price action confirms the Rainbow Wave model again, the closest level to the Red Zone by then would be around $180000.
Do you think that amidst the trade war chaos, that's a realistic expectation? Feel free to let us know in the comments section below!
P.S. I am attaching a snapshot below in case the waves aren't displayed properly on the chart above:
-------------------------------------------------------------------------------
** Please LIKE 👍, FOLLOW ✅, SHARE 🙌 and COMMENT ✍ if you enjoy this idea! Also share your ideas and charts in the comments section below! This is best way to keep it relevant, support us, keep the content here free and allow the idea to reach as many people as possible. **
-------------------------------------------------------------------------------
💸💸💸💸💸💸
👇 👇 👇 👇 👇 👇

Bitcoin Holding Strong — Next Stop: $150K?BTCUSDT Technical analysis update
BTC price is currently retesting its major support zone, which was previously a strong resistance area, now acting as support at the $70K–$75K level. The price has just touched the $75K support zone, and we can expect a consolidation above the $70K level followed by a potential bounce back or a V-shaped recovery from the current level.if we see a strong bounce from the current support level, the next potential target could be around $150K

Will BITCOIN prove to be resilient amidst this market crash??Bitcoin (BTCUSD) just hit its 1W MA50 (red trend-line) for the first time since September 06 2024, while completing the first 1D Death Cross since August 09 2024. This is a critical double combo development as last time those conditions emerged it was a bullish signal.
Despite the theoretically bearish nature of the Death Cross, the last one on 1D was formed just four days after the market's previous major long-term bottom of August 05 2024. That bottom was exactly on the level that the market hit today, the 1W MA50.
The 1W RSI sequences among the 2 fractals are identical and if it wasn't for the abysmal negative market fundamentals regarding the back-and-forth tariffs, that would be an automatic long-term buy entry, the 3rd on of this Bull Cycle.
The only condition we can technically rely on right now, amidst the stock market crash, is for the weekly candle to close above the 1W MA50, as it did on August 05 2024. In that case and of course if and only if the trade war gets under control (and/ or the Fed makes an urgent rate cut), we can expect a new long-term Bullish Leg to begin towards $150k and above.
Failure to address those concerns and a 1W candle close below the 1W MA50, can result into a stronger sell-off towards $50000 and the next long-term technical Support level of the August 05 2024 Low (49150). That would also be a major Support cluster as the 1W MA200 (gray trend-line) is just below that level (and holding since October 16 2023) and by the time of the drop, the market may test that as well.
So what do you think? Will BTC turn out to be resilient amidst this market crash or will it follow suit and decline towards $50k? Feel free to let us know in the comments section below!
-------------------------------------------------------------------------------
** Please LIKE 👍, FOLLOW ✅, SHARE 🙌 and COMMENT ✍ if you enjoy this idea! Also share your ideas and charts in the comments section below! This is best way to keep it relevant, support us, keep the content here free and allow the idea to reach as many people as possible. **
-------------------------------------------------------------------------------
💸💸💸💸💸💸
👇 👇 👇 👇 👇 👇

BTCUSD LONG Rebound BTCUSD Rebound until 78.60 Fibbonacci level and after that sell until 1h orderblock downside.

BITCOIN Bollinger squeeze and 1D Death Cross aiming at $150kBitcoin (BTCUSD) will complete today a 1D Death Cross (1D MA50 crossing below the 1D MA200). A technically bearish pattern in theory but in practice it has been one of the greatest buy signals during the 2023 - 2025 Bull Cycle.
** Bollinger Squeeze, 1D Death Cross, 1W MA50 **
As you can see, since the long-term Channel Up started with the November 21 2022 Bear Cycle bottom, we have had another two 1D Death Crosses. Both took place on the Channel Up bottoms (September 04 2023 and August 05 2024), serving as Higher Lows for the pattern. At the same time, the price had a test (or close) of the 1W MA50 (red trend-line), while the Bollinger Bands (blue cloud) have already started to squeeze.
This squeeze is critical as it was even present during the November 21 2022 Bear market bottom, having started a little earlier on October 31 2022. In fact the squeeze started earlier on all three bottom phases and even on the current price action we are seeing so far a Bollinger Squeeze since March 17 2025, a little after the near test of the 1W MA50.
** The Transition Month **
In typical cyclical manner, each year had one Channel Up bottom. This bottom process (consisting of the Bollinger Squeeze, 1D Death Cross and 1W MA50 test) technically appears once a year. We call this month 'Transition Month', which is the necessary phase that BTC spends to go from the bottom to the new Bullish Leg of the Channel Up. In 2022 that month was December, in 2023 it was September and in 2024 August. Since all bottom conditions have been met this time also, we expect April to be the 2025 Transition Month.
** What's next? **
As far as the next leg up in concerned, all 3 previous Bullish Legs rose by at least +100% from the bottom. Since March 10 was the close test of the 1W MA50, we can consider that the bottom from which to measure the +100% leg up. That suggests that BTC will hit at least $150000 on the next top.
But what do you think? Has this Bollinger Squeeze, 1D Death Cross, 1W MA50 Triple Combo just priced the new bottom? And if yes, will April be the Transition Month for the new Bullish Leg to $150k? Feel free to let us know in the comments section below!
-------------------------------------------------------------------------------
** Please LIKE 👍, FOLLOW ✅, SHARE 🙌 and COMMENT ✍ if you enjoy this idea! Also share your ideas and charts in the comments section below! This is best way to keep it relevant, support us, keep the content here free and allow the idea to reach as many people as possible. **
-------------------------------------------------------------------------------
💸💸💸💸💸💸
👇 👇 👇 👇 👇 👇

BTCUSD hourly trend analysis for April 04, 2025It is in a bearish trend. Sell signal has confirmed the Stop Loss at 83382. This pair has a strong support at 82074 and 80900.

BITCOIN is exactly where it's supposed to be.Bitcoin (BTCUSD) is under heavy pressure lately due to the trade tariffs but as long-term investors, we shouldn't let this volatility affect us.
The MVRV has been one of the most consistent cyclical Top (sell high) and Bottom (buy low) indicators giving only a maximum of two optimal signals in each Cycle and it shows that the market is nowhere near a Top.
On the contrary the MVRV has spend the first 3 months of the year correcting from the 0.382 Fibonacci level to the 0.236. This is the exact same score it had i March 2017. Even in the other two Cycles that wasn't this low on Fibonacci levels, it still made a correction, flashing a red signal.
As the 1W MA50 (blue trend-line) continues to support, there are far more greater probabilities that the market will recover, turning the recent trade volatility into the best buy opportunity of 2025.
As far as a Cycle Top is concerned, it has always been an excellent exit signal when the MVRV hit the 0.786 Fib.
So do you think that will be the case? Feel free to let us know in the comments section below!
-------------------------------------------------------------------------------
** Please LIKE 👍, FOLLOW ✅, SHARE 🙌 and COMMENT ✍ if you enjoy this idea! Also share your ideas and charts in the comments section below! This is best way to keep it relevant, support us, keep the content here free and allow the idea to reach as many people as possible. **
-------------------------------------------------------------------------------
💸💸💸💸💸💸
👇 👇 👇 👇 👇 👇

Bitcoin (BTC/USD) Technical Analysis: Breakout or Rejection at K200 EMA (Blue Line): 84,124 – This is a long-term trend indicator.
30 EMA (Red Line): 83,925 – A short-term trend indicator.
Key Levels
Resistance Point: Around 83,925 (marked in blue).
Support Zone: Around 82,184 (Stop Loss zone).
Target Point: 88,197, indicating a potential 6.34% upside.
Potential Trade Setup
Scenario 1 (Bullish Case):
If price breaks above resistance (83,925) and EMA 200, then a move towards 88,197 is expected.
A breakout confirmation might lead to an uptrend continuation.
Scenario 2 (Bearish Case):
If price rejects at resistance (83,925) and falls back below the support zone (82,184), a downward move could happen.
Pattern Analysis:
The chart suggests a potential accumulation phase before a breakout.
Possible retest of resistance before a rally.
Conclusion
Bullish above 83,925, targeting 88,197.
Bearish below 82,184, with potential downside.
Price action near the 200 EMA is crucial for the next move.

BITCOIN This is where the most aggressive part begins.Bitcoin (BTCUSD) has turned sideways amidst the tariffs implementation today and on the longer picture (1W time-frame) it remains supported just above the 1W MA50 (blue trend-line). On this chart we display our Parabolic Growth Channel (PGC), which is the long-term Zone where BTC is a buy opportunity.
Throughout the market's historic Cycles, the time when BTC was supported above the 1W MA50 but still within its PGC was known as an Accumulation Phase (blue ellipse) before the final parabolic rally of the Cycle and its eventual Top (green Arc).
Based on this model, so far we haven't seen any such rally, despite the undoubtedly strong rallies of October 2023 - March 2024 and October 2024 - December 2024. Only the March 2024 and then the recent Tops can be counted as marginal breaches above the PGC and it's been no surprise that the market corrected back inside the Buy Zone but remained supported by the 1W MA50.
As long as it does, the probabilities of that final, most aggressive Cycle rally get stronger. On the last Cycle the peak was priced just above the 1.618 Fibonacci extension. That is currently a little below $170k and that is why our final Target is just below at $160000. Also right now we are marginally below the 0.618 Cycle top-to-top Fib, which is in line to where all previous final Cycle parabolic rallies started.
So do you think the 1W MA50 will now push BTC to its final Cycle rally? Feel free to let us know in the comments section below!
-------------------------------------------------------------------------------
** Please LIKE 👍, FOLLOW ✅, SHARE 🙌 and COMMENT ✍ if you enjoy this idea! Also share your ideas and charts in the comments section below! This is best way to keep it relevant, support us, keep the content here free and allow the idea to reach as many people as possible. **
-------------------------------------------------------------------------------
💸💸💸💸💸💸
👇 👇 👇 👇 👇 👇

Bitcoin (BTC/USD) Short Trade Setup: Resistance Rejection & TargThis chart is a Bitcoin (BTC/USD) 15-minute price chart from TradingView, showing a potential short trade setup based on technical analysis. Here’s a breakdown of the key elements:
1. Resistance Zone & Short Setup
The purple highlighted area represents a resistance level around $85,358.
Price is consolidating within this resistance zone, suggesting a potential reversal.
The expected scenario involves a price rejection from this resistance, leading to a downward move.
2. Moving Averages
EMA (200, blue line) at $83,433: A long-term trend indicator suggesting a strong support zone.
EMA (30, red line) at $84,657: A short-term trend indicator, currently above the price, indicating a potential bearish setup if the price moves below it.
3. Target & Stop-Loss Le

BTCUSD Trading StrategyBTCUSD has experienced a significant decline. While the indicators have yet to show signs of stabilization or a trend reversal, the price action on the candlestick chart indicates that there is support in the range of 82,000-80,000. Therefore, I believe it is an opportune moment to position for a long trade within this range, exercising patience as we await a price rebound to achieve the TP1/TP2 targets.

BTCUSD hourly chart projection till April 03, 2025BTCUSD looks bearish with the given Support and Resistance levels. Once the Dynamic Signal confirms the sell entry with stop loss and targets, that makes the best point to enter into the trade.
