BTCUSDT

Bitcoin risingBitcoin had 2 bullish divergences on daily TF , now its rising and 98k is not that hard to reach IMO

BTCUSDT 1D Analysis UpdateBTC ~ 1D Analysis Update
#BTC Alright let's continue this bullish, a minimum of $ 130,000 - $ 150,000 in 2025.

Consolidation Divergence - Range Trading StrategyLast week, BTC continued to oscillate in the 83K-86K range. Technically, the daily MACD showed increasing volume but a deviation from the price. At the same time, the Bollinger Bands narrowed sideways, and the market entered a typical "pre-breakout momentum" stage.
Before an effective breakthrough, you can rely on the range to sell high and buy low, strictly set stops, and pay close attention to changes in volume and energy and confirmation of the breakthrough direction.
BTCUSD
sell@86500-85500
tp:84500-83500
buy@83000-84000
tp:85000-86000
I hope this strategy will be helpful to you.
When you find yourself in a difficult situation and at a loss in trading, don't face it alone. Please get in touch with me. I'm always ready to fight side by side with you, avoid risks, and embark on a new journey towards stable profits.

BTC - Ready for a FLUSH?BTC has acquired liquidity both sides, lets see closing 88.9k on day can make way lots of things! Eventually 83.1k is my main targets!

BTCUSD update 13.04.2025 H1After reaching the main internal liquidities from the previous publication, I expect a correction to the specified level, possibly lower. There is always a stop loss and it is higher. This is more an attempt to work out the previous idea
Best regards, EXCAVO

Next Volatility Period: Around April 25-29
Hello, traders.
If you "Follow", you can always get new information quickly.
Please click "Boost" as well.
Have a nice day today.
-------------------------------------
(BTCUSDT 1W chart)
The key is whether it can receive support near the OBV Line indicator (84349.94) on the 1M chart and rise above the M-Signal indicator on the 1W chart.
-
(1D chart)
(Movement in a wide range)
If you look at the lines drawn with multiple lines, you can see that it is currently moving sideways within the section that the fingers are pointing to.
It may seem a bit complicated, but the key is in which direction the finger points out.
(Narrow range movement)
After the volatility period of around April 14-17, there is a possibility that the short-term trend will change.
The next volatility period is expected to be around April 25-29 (up to April 24-30).
Therefore, the point of interest is whether it will fall below the M-Signal indicator on the 1D chart and show a downward trend, or rise above the M-Signal indicator on the 1W chart and show an upward trend.
In other words, you need to look at whether it will rise along the trend line (2) or fall along the trend line (4).
-
As I said before, if the StochRSI indicator is above 50, it is better to focus on finding a selling point.
The reason is that even if it rises, the upward trend is likely to be limited.
If the trading volume increases explosively when it shows support at a certain support and resistance point or section, it is possible that it will lead to a large increase, but it is a rare case, so it is better to refrain from expecting it.
-
Thank you for reading to the end.
I hope you have a successful transaction.
--------------------------------------------------
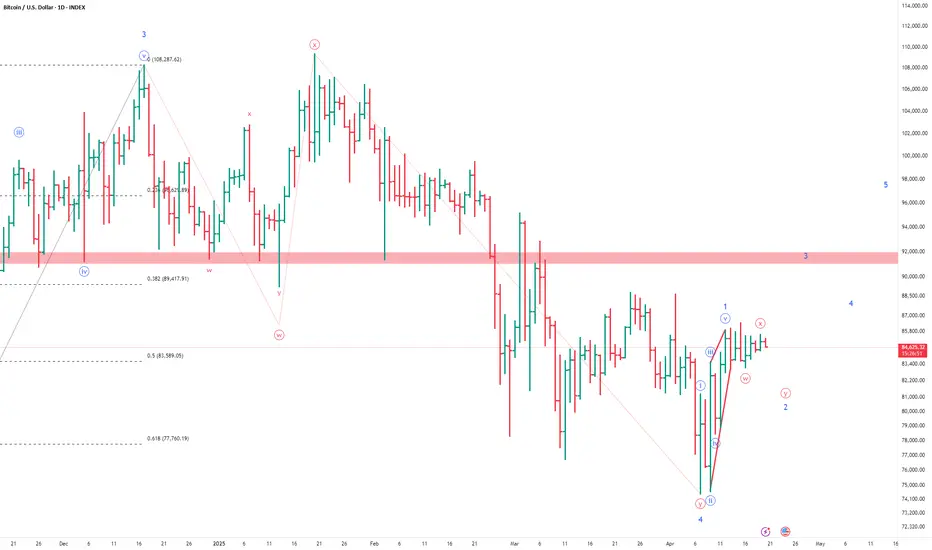
- Here is an explanation of the big picture.
I used TradingView's INDEX chart to check the entire section of BTC.
I rewrote it to update the previous chart while touching the Fibonacci ratio section of 1.902 (101875.70) ~ 2 (106275.10).
(Previous BTCUSD 12M chart)
Looking at the big picture, it seems to have maintained an upward trend following a pattern since 2015.
In other words, it is a pattern that maintains a 3-year bull market and faces a 1-year bear market.
Accordingly, the upward trend is expected to continue until 2025.
-
(Current BTCUSD 12M chart)
Based on the currently written Fibonacci ratio, it is displayed up to 3.618 (178910.15).
It is expected that it will not fall again below the Fibonacci ratio of 0.618 (44234.54).
(BTCUSDT 12M chart)
Based on the BTCUSDT chart, I think it is around 42283.58.
-
I will explain it again with the BTCUSD chart.
The Fibonacci ratio ranges marked in the green boxes, 1.902 (101875.70) ~ 2 (106275.10) and 3 (151166.97) ~ 3.14 (157451.83), are expected to be important support and resistance ranges.
In other words, it seems likely that they will act as volume profile ranges.
Therefore, in order to break through these ranges upward, I think the point to watch is whether they can receive support and rise near the Fibonacci ratios of 1.618 (89126.41) and 2.618 (134018.28).
Therefore, the maximum rising range in 2025 is expected to be the 3 (151166.97) ~ 3.14 (157451.83) range.
In order to do that, we need to see if it is supported and rises near 2.618 (134018.28).
If it falls after the bull market in 2025, we don't know how far it will fall, but based on the previous decline, we expect it to fall by about -60% to -70%.
Therefore, if it starts to fall near the Fibonacci ratio 3.14 (157451.83), it seems likely that it will fall to around Fibonacci 0.618 (44234.54).
I will explain more details when the bear market starts.
------------------------------------------------------

Which altcoins hold the potential to conquer the crypto market?Have you ever heard of ISO 20022?
Do you know what this standard is all about?
Which tokens have adopted or are compliant with this standard?
ISO 20022 is an international standard for the exchange of financial data between financial institutions, banks, corporations, and other entities. Developed by the International Organization for Standardization (ISO), its purpose is to provide a universal language for financial messaging on a global scale.
Hello✌
Spend 3 minutes ⏰ reading this educational material. The main points are summarized in 3 clear lines at the end 📋 This will help you level up your understanding of the market 📊 and Bitcoin💰.
🎯 Analytical Insight on Bitcoin: A Personal Perspective:
Bitcoin is currently near a strong trendline and a solid daily support level. I’m expecting it to break the $90,000 mark, a key psychological level, within the next few days. My main target is at least a 7% increase, reaching $90,500.
📈
Now , let's dive into the educational section, which builds upon last week's lesson (linked in the tags of this analysis). Many of you have been eagerly waiting for this, as I have received multiple messages about it on Telegram.
🔍 What Is ISO 20022 and Why Should Traders Care?
Have you come across ISO 20022 and wondered what it really means in the world of finance and crypto? It’s not just a technical standard—it could be a major bridge between traditional finance and blockchain-based assets.
🌐 A Global Standard for Financial Messaging
ISO 20022 is an international protocol developed by the International Organization for Standardization. It defines a universal language for exchanging financial data between institutions—banks, governments, payment networks, and corporations.
💡 Key Features of ISO 20022
• Uses XML-based message formatting—both machine and human-readable
• Covers multiple financial areas: payments, securities, trade, treasury, and cards
• Highly flexible and extendable to future innovations
• Designed to reduce processing errors and boost interoperability worldwide
📈 Why It’s Becoming a Big Deal
With increasing digitization, the global financial system is shifting toward unified communication standards. Major infrastructures like SWIFT are already migrating to ISO 20022 to future-proof their operations.
🪙 The Crypto Connection
Some cryptocurrencies have been developed to align with ISO 20022 standards. This means they have the potential to integrate directly into regulated financial systems—making them more likely to be adopted by banks and governments.
✅ ISO 20022-Compliant Cryptocurrencies (As of 2024)
• XRP (Ripple)
• XLM (Stellar)
• XDC (XinFin)
• IOTA
• ALGO (Algorand)
• QNT (Quant)
• HBAR (Hedera Hashgraph)
🤝 Why Compliance Matters
If traditional finance fully adopts ISO 20022, only tokens that meet its criteria will likely be considered for official integration. This could have huge implications for utility, regulation, and long-term value.
🧠 Strategic Insight for Investors
Incorporating ISO 20022-compliant assets into your portfolio isn’t just about trends—it’s about positioning yourself for future financial system evolution. These tokens may play a key role in bridging the gap between DeFi and TradFi.
However , this analysis should be seen as a personal viewpoint, not as financial advice ⚠️. The crypto market carries high risks 📉, so always conduct your own research before making investment decisions. That being said, please take note of the disclaimer section at the bottom of each post for further details 📜✅.
🧨 Our team's main opinion is: 🧨
ISO 20022 is a global financial messaging standard designed to streamline data exchange between banks and institutions. It's becoming crucial as traditional systems like SWIFT adopt it for greater efficiency. Several cryptocurrencies, including XRP, XLM, and ALGO, are ISO 20022-compliant, positioning them for future integration with mainstream financial systems. This compliance could lead to wider adoption by banks and governments, making them more valuable long-term. 🚀
Give me some energy !!
✨We invest countless hours researching opportunities and crafting valuable ideas. Your support means the world to us! If you have any questions, feel free to drop them in the comment box.
Cheers, Mad Whale. 🐋

"Bitcoin vs Tether" Crypto Market Heist Plan (Scalping/Day)🌟Hi! Hola! Ola! Bonjour! Hallo! Marhaba!🌟
Dear Money Makers & Robbers, 🤑💰✈️
Based on 🔥Thief Trading style technical and fundamental analysis🔥, here is our master plan to heist the "Bitcoin vs Tether" Crypto Market. Please adhere to the strategy I've outlined in the chart, which emphasizes short entry. Our aim is the high-risk Green MA Zone. Risky level, oversold market, consolidation, trend reversal, trap at the level where traders and bullish robbers are stronger. 🏆💸"Take profit and treat yourself, traders. You deserve it!💪🏆🎉
Entry 📈 : "The vault is wide open! Swipe the Bearish loot at any price - the heist is on!
however I advise to Place sell limit orders within a 15 or 30 minute timeframe most nearest or swing, low or high level for Pullback Entries.
Stop Loss 🛑:
📌Thief SL placed at the nearest/swing High or Low level Using the 4H timeframe (81000) Day/Scalping trade basis.
📌SL is based on your risk of the trade, lot size and how many multiple orders you have to take.
Target 🎯: 70000 (or) Escape Before the Target
"Bitcoin vs Tether" Crypto Market Heist Plan (Scalping/Day Trade) is currently experiencing a Bearish trend.., driven by several key factors.👇👇👇
📰🗞️Get & Read the Fundamental, Macro, COT Report, On Chain Analysis, Sentimental Outlook, Intermarket Analysis, Future trend targets... go ahead to check 👉👉👉🔗🔗
Detailed Point Recap 📋
Fundamentals 📊: Strong network + adoption ✅ offset regulatory risks ⚠️—moderately bullish 📈.
Macro 🌍: Inflation aids BTC 🥇, but tight policy/USD weigh ⚖️—mixed 🤔.
COT 📈: Institutional longs 📈 vs. leverage risks ⚡—cautiously bullish ✅.
On-Chain 🔗: LTH bullishness 📈 vs. STH selling 📉—leans positive but capped ⚖️.
Intermarket 🔄: Short-term bearish (equity/USD) 📉, long-term hedging 📈—mixed ⚖️.
Sentiment 😊: Neutral across cohorts ⚖️—lacking conviction 🤷.
Trends 🎯: Short-term downside ($70K) 📉 vs. long-term upside ($129K) 📈—context-driven 🔮.
Outlook 🌟: Neutral now ⚖️, tilting bearish short-term 📉, bullish long-term 📈.
⚠️Trading Alert : News Releases and Position Management 📰 🗞️ 🚫🚏
As a reminder, news releases can have a significant impact on market prices and volatility. To minimize potential losses and protect your running positions,
we recommend the following:
Avoid taking new trades during news releases
Use trailing stop-loss orders to protect your running positions and lock in profits
💖Supporting our robbery plan 💥Hit the Boost Button💥 will enable us to effortlessly make and steal money 💰💵. Boost the strength of our robbery team. Every day in this market make money with ease by using the Thief Trading Style.🏆💪🤝❤️🎉🚀
I'll see you soon with another heist plan, so stay tuned 🤑🐱👤🤗🤩

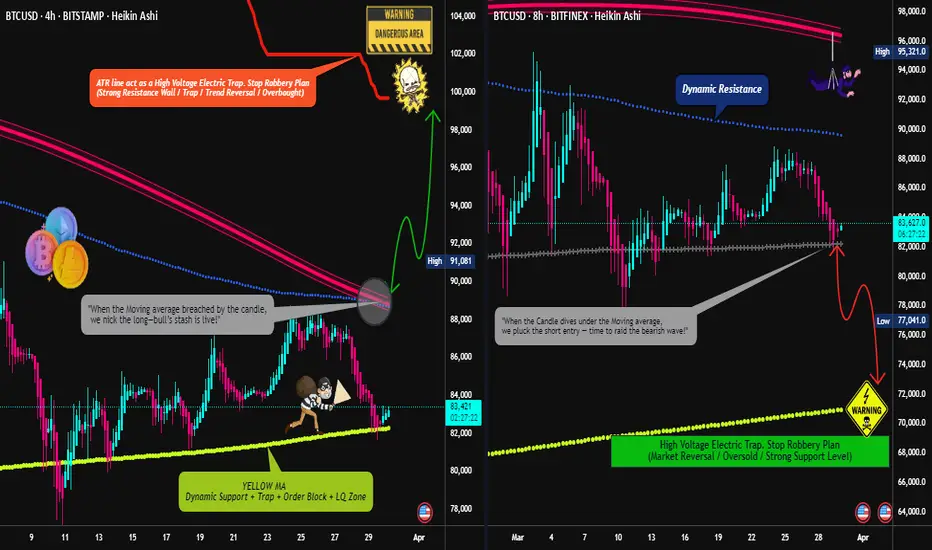
BTC/USD "Bitcoin vs U.S.Dollar" Crypto Market Heist (Swing/Day)🌟Hi! Hola! Ola! Bonjour! Hallo! Marhaba!🌟
Dear Money Makers & Robbers, 🤑💰✈️
Based on 🔥Thief Trading style technical and fundamental analysis🔥, here is our master plan to heist the BTC/USD "Bitcoin vs U.S.Dollar" Crypto Market. Please adhere to the strategy I've outlined in the chart, which emphasizes long entry and short entry. 🏆💸Be wealthy and safe trade.💪🏆🎉
Entry 📈 :
"The loot's within reach! Wait for the breakout, then grab your share - whether you're a Bullish thief or a Bearish bandit!"
🏁Buy entry above 89000
🏁Sell Entry below 81000
📌However, I recommended to place buy stop for bullish side and sell stop for bearish side.
Stop Loss 🛑:
🚩Thief SL placed at 84000 for Bullish Trade
🚩Thief SL placed at 88000 for Bearish Trade
Using the 4H period, the recent / swing low or high level.
SL is based on your risk of the trade, lot size and how many multiple orders you have to take.
Target 🎯:
🏴☠️Bullish Robbers TP 99000 (or) Escape Before the Target
🏴☠️Bearish Robbers TP 72000 (or) Escape Before the Target
BTC/USD "Bitcoin vs U.S.Dollar" Crypto Market Heist Plan is currently experiencing a neutral trend,., driven by several key factors.
📰🗞️Get & Read the Fundamental, Macro, COT Report, On Chain Analysis, Sentimental Outlook, Intermarket Analysis, Future trend targets.. go ahead to check 👉👉👉🔗
⚠️Trading Alert : News Releases and Position Management 📰 🗞️ 🚫🚏
As a reminder, news releases can have a significant impact on market prices and volatility. To minimize potential losses and protect your running positions,
we recommend the following:
Avoid taking new trades during news releases
Use trailing stop-loss orders to protect your running positions and lock in profits
💖Supporting our robbery plan 💥Hit the Boost Button💥 will enable us to effortlessly make and steal money 💰💵. Boost the strength of our robbery team. Every day in this market make money with ease by using the Thief Trading Style.🏆💪🤝❤️🎉🚀
I'll see you soon with another heist plan, so stay tuned 🤑🐱👤🤗🤩
$FLM/USDT Breakout AlertAfter a strong accumulation phase, CSE:FLM just broke out of a descending trendline with volume confirmation!
Entry: 0.0154
SL: 0.0137
Target: 0.0269
Price broke above the trendline + 50ema, signalling a potential trend reversal.
Bullish momentum is building; eyes are on the next key level!
Are you riding this breakout? 👀

BTC & ETH Weekly Forecast – Will Week 16 Bring a Breakout?🔍 Weekly Outlook – Week 16, 2025
• BTC remains below the daily Ichimoku Cloud.
• Volatility (BBWP) is at historical lows — potential breakout setup.
• ETH hovering above key EVWMA zones
• If BTC enters the cloud, 92K becomes a valid short-term target.
• ETH needs to reclaim 1600+ to sustain bullish momentum.
📌 This is a quick overview of my weekly analysis.
I explore the full setup across 1D, 4H, and 12H timeframes,
with Ichimoku, BBWP, and EVWMA discussed in detail elsewhere.

Could this be beginning of 5th wave up in Bitcoin?Being cautiously optimistic - I can see a potential leading diagonal formation followed by 3-3 legs which could be legs w-x of w-x-y or w-x-y-x-z .
Only time will tell if this is what I think it is o it evolves into another corrective rise followed by further downside.
CHFJPY TECHNICAL AND FUNADEMENTALS DETAILS ANALYSISCHFJPY has just broken out of a long-term descending channel on the daily chart, currently trading near 174.09. This breakout is technically significant, as it marks the end of a prolonged downtrend and suggests the beginning of a potential bullish reversal. The price action shows a clean breakout above the upper channel resistance, followed by a healthy retest—textbook price behavior when momentum shifts to the upside. With this structure flip, we are now positioning for a continuation towards the 182.40 zone, which aligns with a previous key resistance and measured move projection.
This breakout is supported by strong fundamentals. The Swiss Franc remains firm, driven by Switzerland’s resilient economic data and the Swiss National Bank’s cautious monetary stance. Meanwhile, the Japanese Yen continues to struggle as the Bank of Japan maintains its ultra-loose policy, despite recent signs of inflation picking up. The yield differential and risk-on sentiment are weighing heavily on JPY, making it an ideal quote currency for this bullish CHF move. Traders are increasingly favoring CHFJPY in the current macro landscape due to this divergence.
What makes this setup even more attractive is the clean technical structure paired with a favorable risk-reward ratio. The stop below the retest area around 171.63 offers tight risk management, while the upside potential toward 182.40 presents a strong 1:3+ R/R swing opportunity. These types of breakouts—especially after extended consolidation—often lead to trend-following momentum plays that institutions favor.
CHFJPY is now on many watchlists across TradingView due to this breakout from a descending channel, which is a highly searched pattern by technical traders. This pair is poised to deliver a profitable swing trade backed by both technical strength and macro alignment. If momentum continues, we could see a strong bullish leg throughout Q2.

BTCUSDT hitting daily resistance but eying weekly resisatnce 98kBTCUSDT has bounced well from weekly support WS1 and currently heading towards daily resistance DR1 around 87k-88k zone. Once it breaks this, the next target would be weekly resistance WR1 which is the next resistance on its way. This resistance is sitting around 95k-98k zone. I think, the price is eying that zone and in coming days and week we will see the price trading there. However, this WR1 zone would definitely make the price push back on firts hit. But the price will definitely make another go there before either breaking of giving up for a while again. The resistance WR1 will be the only obstacle before the price can hit all time high and beyond again. Therefore, this weekly resistance will not give the way easy as this will be a strong supply zone. But I would not worry much once the price reaches there. This will evnetually signal that we are going beyond ATH and further higher. It would be just a bit of struggle there and some consolidation and some boring price action for a while, and then there will be clear sky.

Bitcoin Bottom- i saw many traders using vrvp or vpvr like and claiming BTC will go 10k.
- They just don't know how to use this tool and didn't understand how it works.
- if u don't know how to use a tool, simply don't use it. so less people's will rekt. this is an advanced trading tool.
- The Timeline of those tools are VERY IMPORTANT, they cannot be set up from 2015 or 2013.
What happened when BTC was Bearish :
- Actually when BTC dipped from 30,000$ ish, the columns started in the vrpv darker zone ( Less Demand )
- BTC reached 20,000$ and columns started to grow ( Demand Zone but Fear "Retailers" )
- Then dipped 17,500$ and the columns diminished size ( Good Demand " Smart Money" )
- This is at this point that you can detect a BOTTOM Zone. ( Darker zones + Small Columns )
Then what happened when BTC was Bullish :
- if you watch VRVP when BTC was growing you will notice the inverse.
- The Main demand was around 30,000$.
- BTC Reached 50,000$ and VRVP started to be darker ( More Demand impulse "FOMO" ).
- Then BTC reached 70,000$ ( No Demand ). ( Darker zones + Small Columns )
- i will post an exemple under this post to show a bad use of VRVP/VPVR. please don't use it that way.
Happy Tr4Ding !

Bitcoin Monitoring- This is not a trade setup.
--------------------------------------------
- Zones to keep close surveillance :
--------------------------------------------
- 25,200$
- 27,300$
--------------------------------------------
Happy Tr4Ding!

BTC Diamond Ser ?- While bears see bearish pennants, I see diamonds in the rough.
- I remain bullish, not due to the price, but for the sake of humanity.
- This isn’t an analysis, just a light-hearted joke, so please don’t roast me too hard! 🙏.
- Remember, diamonds are forever.
- Hodl!
Happy Tr4Ding!

BTC | FAKE REVERSAL - Here's WhyI'm not convinced of the recent "bullish" price action. In fact, I say it's likely the calm before the next bearish move down.
In a downtrend, there are a few tale tell signs that the price has gone into full bear mode . In this video, I discuss two of them.
Make sure you catch up on ALTCOINS, and their ideal buying zones HERE 👀👇
__________________
BINANCE:BTCUSDT

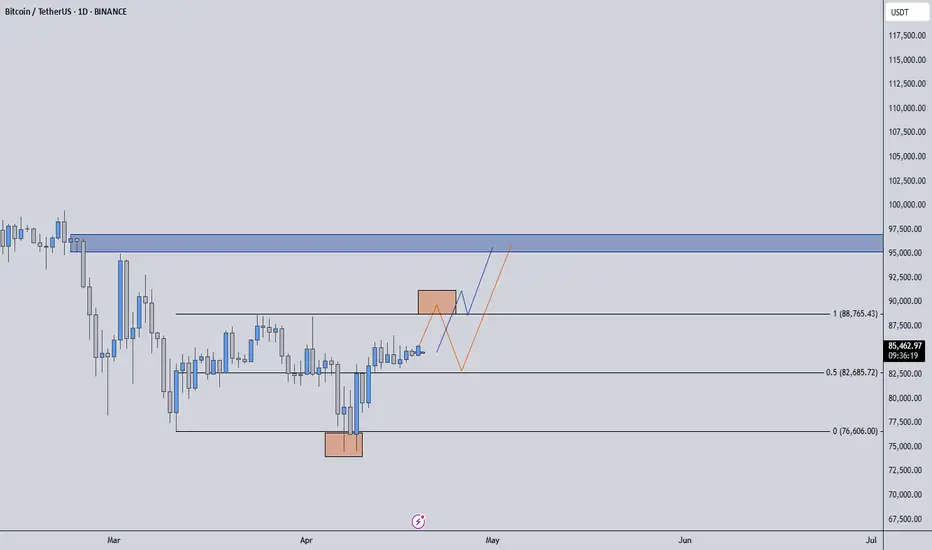
Short-Term View Flips Bullish - Key Scenarios to WatchAfter carefully reviewing both macroeconomic sentiment and on-chain developments, my bias for this holiday period has shifted from short to long. Here's why.
🌐 Macro Shifts Supporting the Market:
The recent tone from the U.S. indicates a willingness to sit at the negotiation table with China, a gesture that could ease geopolitical uncertainty and risk aversion.
Key data released suggests that a recession is no longer an imminent concern. Markets love stability, and this could inject short-term confidence into risk assets, including Bitcoin.
📈 My Updated Short-Term Outlook: Based on this new backdrop, I see two main scenarios unfolding:
Clean Break and Hold Above Key Resistance:
If BTC breaks out of the current consolidation zone and holds above the resistance with volume and LTF confirmation, we could see a quick move toward the next major liquidity zone. I will be watching volume flow and delta behavior closely for confirmation before entering.
Shallow Pullback Before Takeoff:
If price retraces slightly into a local support (likely a previous breakout zone), and buyers hold it, this could offer a perfect dip-buy opportunity. This would be my preferred setup for a high-RR long position.
🚨 Stay Flexible, Not Emotional: While I'm leaning long now, I will never insist on a biased view. If key levels break down and LTF shows weakness, I’ll shift accordingly. My strength comes from adaptability — and that’s what separates consistent traders from the crowd.
📌 Follow closely, I only track coins with massive volume increases and strong order flow signals, so every setup is filtered for high potential.
📌I keep my charts clean and simple because I believe clarity leads to better decisions.
📌My approach is built on years of experience and a solid track record. I don’t claim to know it all but I’m confident in my ability to spot high-probability setups.
📌If you would like to learn how to use the heatmap, cumulative volume delta and volume footprint techniques that I use below to determine very accurate demand regions, you can send me a private message. I help anyone who wants it completely free of charge.
🔑I have a long list of my proven technique below:
🎯 ZENUSDT.P: Patience & Profitability | %230 Reaction from the Sniper Entry
🐶 DOGEUSDT.P: Next Move
🎨 RENDERUSDT.P: Opportunity of the Month
💎 ETHUSDT.P: Where to Retrace
🟢 BNBUSDT.P: Potential Surge
📊 BTC Dominance: Reaction Zone
🌊 WAVESUSDT.P: Demand Zone Potential
🟣 UNIUSDT.P: Long-Term Trade
🔵 XRPUSDT.P: Entry Zones
🔗 LINKUSDT.P: Follow The River
📈 BTCUSDT.P: Two Key Demand Zones
🟩 POLUSDT: Bullish Momentum
🌟 PENDLEUSDT.P: Where Opportunity Meets Precision
🔥 BTCUSDT.P: Liquidation of Highly Leveraged Longs
🌊 SOLUSDT.P: SOL's Dip - Your Opportunity
🐸 1000PEPEUSDT.P: Prime Bounce Zone Unlocked
🚀 ETHUSDT.P: Set to Explode - Don't Miss This Game Changer
🤖 IQUSDT: Smart Plan
⚡️ PONDUSDT: A Trade Not Taken Is Better Than a Losing One
💼 STMXUSDT: 2 Buying Areas
🐢 TURBOUSDT: Buy Zones and Buyer Presence
🌍 ICPUSDT.P: Massive Upside Potential | Check the Trade Update For Seeing Results
🟠 IDEXUSDT: Spot Buy Area | %26 Profit if You Trade with MSB
📌 USUALUSDT: Buyers Are Active + %70 Profit in Total
🌟 FORTHUSDT: Sniper Entry +%26 Reaction
🐳 QKCUSDT: Sniper Entry +%57 Reaction
📊 BTC.D: Retest of Key Area Highly Likely
📊 XNOUSDT %80 Reaction with a Simple Blue Box!
📊 BELUSDT Amazing %120 Reaction!
I stopped adding to the list because it's kinda tiring to add 5-10 charts in every move but you can check my profile and see that it goes on..
The Road to The Mooni like to make some graphs like that when peoples are in Dispair mode.
- i used a modified ADX indicator with a Monthly Timeframe ( thanks to the creator by the way )
- Look at the Mountains and tell me when in past bullruns we stopped at 100 ? - Never -
- The Highest Point is 160+
That said my advice for now is : " You don't really care if TheKing will back to 20k, what you have to care is the Highest point TheKing will reach! "
- Don't Think it's the end of this bullrun
- Don't Listen Fuders
- Use indicators for the Long Term
- Believe in Trends and cycles movements
- Believe in the future of cryptos
- Believe in TheKing because Theking cannot die.
Happy Tr4Ding !

Bitcoin are you Worried ?Everything is in chart.
- Like i said many times, more you look from far, more it's easy to predict the future.
- This Monthly Chart combinated with indicators show you how BTC moved in 2016-2017 BullRun so keep eyes open and you will find the way for 2020-2021.
- We cannot compare a Bullrun from 400$ to 20,000$ with a Bullrun From 4000$ to 3XX,XXX+$, the chart will be exponential. We are now playing with big numbers.
- imo right now we are in fake bear market stage, this stage happened also in 2016-2017 pre-bullrun ( but Numbers were smallers...), whales are just trying to create fear and remove retails investors.
- Actual stage could be a Consolidation Phase, if Whales see there's a lack of interest, they will push BTC up, or we could get a quick fast Trap to 20,000$ if Whales feel Retails not fear enough (Not sell their BTC).
- 100 000$ Target is still very preservative, past this stage it will be the FOMO Stage to go Higher!
TheKing is dead??? Long live TheKing!! :D
Happy Tr4Ding !

BTC: Inverse Head & Shoulder Breakout (Time to go All-in) BTC Market Outlook (Multi Timeframe Analysis)
First of all, according to the higher timeframes (Weekly & Monthly), BTC is still in a bullish trend.
However, on the Daily timeframe, structure remains bearish — but we’re now seeing multiple bullish confluences building up:
Inverse Head & Shoulders breakout on Daily TF
Bearish Order Block has been broken, turning into a bullish breaker
On the Shorter Timeframe, we’ve got CHoCH (Change of Character) confirmation
Sell-side liquidity (SSL) has already been swept
All of these factors indicate that this could be a strong long opportunity, possibly the "mother of all buy setup.
Oh, and don’t forget to say thank you later. 😉 BYBIT:BTCUSDT
