Bitcoin BTC - Buy The News, Correction Is Almost Over Hello, Skyrexians!
The anticipated move has happened, BINANCE:BTCUSDT has retested the recent low and its dominance continues growing, alts are bleeding. When this nightmare will be finished and do we have any chance to see the reversal now?
Let's take a look at the daily time frame. As we pointed out earlier Bitcoin has printed wave 1 inside larger degree wave 3 and after that dropped in the wave 2. We have already told you 2 times that correction is over when price was next to $77-78, but multiple retests are not forbidden. 0.61 Fibonacci zone is the place where correction can be finished, so it can dump up to $73k. Two facts we need to rely on to find the correction bottom are: bullish divergent bar and the first green column on Awesome oscillator in conjunction with the divergence.
Best regards,
Skyrexio Team
___________________________________________________________
Please, boost this article and subscribe our page if you like analysis!
BTCUSDT

Bitcoin: Breaking Below $80K Soon,10% Correction on the Horizon?Hey Realistic Traders, Bitcoin is consistently hitting new lower lows. Could this signal that the bear market is here to stay? Let’s dive in.......
On the H4 chart, Bitcoin is clearly in a bearish phase. It consistently trades below both the trendline and the EMA 200, reinforcing the downtrend. Additionally, a rising wedge pattern has formed and broken out, and the MACD has shown a bearish crossover. This crossover is a key indicator, signaling that momentum is shifting from buyers to sellers.
Together, these signals suggest that Bitcoin may drop toward our first target at 79,081. After reaching this level, a short pullback is expected as traders take profits before the price continues its descent toward a new low at 73,633.
This outlook remains valid as long as the price moves below the stop-loss level at 89,557
Support the channel by engaging with the content, using the rocket button, and sharing your opinions in the comments below.
Disclaimer: "Please note that this analysis is solely for educational purposes and should not be considered a recommendation to take a long or short position on Bitcoin.

BTC/USDT 4H Chart Update. Current Price: ~$78,336
BTC has broken below the symmetrical triangle and is testing the key horizontal support between $78,424 and $79,183.
A wick is visible below the support, but the candle closed within the area, indicating a potential fakeout or demand absorption.
Resistance (downtrend line): ~$85,500
Support Zones:
Primary: $78,424
Secondary: $79,183
Immediate Resistance: $82,000 – $83,000 (recent breakdown zone)
Outlook & Scenarios:
Bullish Reversal Scenario (Green Arrow):
The green arrow projection suggests a potential bounce from this demand zone.
If BTC reclaims $80K+ with strong momentum, it could aim for the descending trendline near $85K.
A bullish confirmation would be a 4H candle close above $80.5K–$81K.
Bearish continuation (if support fails):
If the price fails to hold this support zone, the next downside targets could be:
$76,000
$73,500
Sentiment factor:
The previous sentiment (Fear & Greed Index: 28 – Fear) reflects ongoing market caution.
Price action near key support in the fear zone could trigger a short squeeze or panic sell-off, depending on volume and reaction.
Summary:
BTC is at crucial support, and unless volume confirms a deeper breakdown, the bounce is likely to be short-lived.
Moving back above $80K would signal that bulls are regaining control.
Want any strategy ideas for trading this setup?
If you found this analysis helpful, hit the Like button and share your thoughts or questions in the comments below. Your feedback matters!
Thanks for your support!
DYOR. NFA

Short position openedI invest in Bitcoin, and don’t usually trade. However, I can see a pretty bearish setup unfolding.
Trade set up:
Entry price: 85341.66 (black line in 4H)
Stop loss: 87,962 (red line in 4H chart, just above the previous week high)
Target 1 - 80.971 (green line, previous week low and Fib 0.5 level in Daily chart)
Target 2 - 78, 253 (green line in 4H chart, previous month low, approx 50% encroachment zone of fair value gap in daily chart .
Reasons:
Weekly:
MACD is still in the bull territory but MACD lines are clearly moving to the downside.
The price has retraced to 50% of the massively bearish red candle of(March 3rd weekly candle) and now resuming to move to the downside.
Daily:
RSI and MACD are both in the bear territory and it looks like they are rolling back to the downside in the bear territory, which is pretty bearish.
The price has dropped and closed below the ascending trend line.
4H:
The price has been travelling inside the ascending parallel channel, but it is dropped and closed below the bottom line.
Both MACD and RSI are deep in the bear territory.

Bitcoin's Symmetrical Triangle – a short trade possible here!Bitcoin is currently forming a symmetrical triangle on the 15-minute chart, with a falling resistance trendline and a rising support trendline. This setup is a classic indication of consolidation, and the price is likely to move for downside soon as it is reversing from upper band now. If Bitcoin manages to break above 83,737, we could see a breakout of this symmetrical triangle, On the flip side, if it breaks below the rising support, 82,313 could breakdown for downside and we can see further downside then, but now we are playing inside the symmetrical triangle only and we will try to book profit once price reaches lower band of the symmetrical triangle pattern.
Disclaimer: This analysis is for educational purposes only. Please consult a financial advisor before making investment decisions.
If you Found this helpful? Don’t forget to like, share, and drop your thoughts in the comments below.

Possible Huge Long Zone on Bitcoin ⚡ Bitcoin (BTC/USDT) – Daily Chart: Bullish Reversal on the Horizon? 📈
(Please check my previous posts before reading this last one regarding BTC)
BTC just tapped into a high-confluence Long Zone between $73,700 – $65,260, which acted as a powerful demand area during the last rally back in late 2024. After a recent drop of today, price is now sitting at a key decision level. 🟢
🔹 Long Zone: $73,700 – $65,260
🔹 Historical Support: Held in late 2024 before a major run
🔹 Target Level: $108,000
🔹 Potential Breakout Zone: A strong close above $108,000 as higher targets
📈 If price holds this zone, we could see a strong bullish reversal toward the $108,000 or higher. The descending wedge pattern hints at a textbook accumulation-to-expansion setup—but only with proper confirmation. 🚀
🟢 High reward-to-risk setup for swing traders watching for trend shifts.
⚠️ Don’t rush in. Look for signs of strength before entering and take care of your risk management system.
Are you bullish on BTC/USDT once it touches the $73,700 level? Let’s discuss! 👇

NASDAQ, S&P 500 and CoinMarketCap movements, Bitcoin chart
Hello, traders.
If you "Follow", you can always get new information quickly.
Please click "Boost" as well.
Have a nice day today.
-------------------------------------
We need to check the movement after a new candle is created.
USDT, USDC should gap up to know that funds have flowed into the coin market.
On the other hand, if there is a gap down, I think funds have flowed out of the coin market.
Therefore, I think USDT or USDC are showing the size and flow of funds in the coin market.
-
(BTC.D 1M chart)
If BTC dominance is maintained above 62.47 or continues to rise, altcoins are likely to show a large decline.
Therefore, in order for an altcoin bull market to begin, it must fall below 55.01 and remain there or continue to decline.
-
(USDT.D 1M chart)
USDT is a fund that has a large influence on the coin market.
Therefore, if USDT dominance rises, it means that the coin market is likely to show an overall decline.
On the other hand, if it falls, it can be interpreted that the coin market is likely to show an overall rise.
In order for the coin market to start an upward trend, it must fall below 4.97 and remain there or continue to decline.
In particular, if the Fibonacci ratio rises above 0.618, the coin market is likely to plummet.
If it remains above the Fibonacci ratio of 0.618, it is likely to rise to around 7.14.
-------------------------------------------
(NAS100USD 12M chart)
It has currently entered the most important support and resistance zone.
-
(1W chart)
Therefore, the maximum decline point is expected to be around 14922.2.
In order to continue the uptrend, the price must be maintained above the M-Signal indicator on the 1M chart.
Therefore, the key is whether it can receive support near the most important support and resistance zone and rise above the M-Signal indicator on the 1M chart.
---------------------------------------------
(SPX500USD 1W chart)
The key is whether it can be supported around 4773.4-4846.1 and rise above the M-Signal indicator on the 1M chart.
If not, the maximum decline is expected to be around 3875.1-4116.0.
---------------------------------------------
(BTCUSDT 1M chart)
As I mentioned before, since the dotted trend line (1) is not acting as a clear trend line, there is a high possibility of volatility.
Therefore, when the StochRSI indicator creates a peak in the oversold zone and rises this time, there is a possibility that a trend will be formed as a trend line between lows is created.
However, the high-point trend line and the low-point trend line must be formed in the same direction.
In other words, since the current high-point trend line is creating an upward trend line, the low-point trend line that will be created this time must also create an upward trend line.
In that sense, the 69000-73199.86 section can be seen as an important support and resistance section.
If it falls below 69000, it is likely to touch the Fibonacci ratio section of 0.886 (56227.18) ~ 1 (61338.93), which was the previous high point section.
-
(1D chart)
On the last day of this volatility period, it fell below the upward trend line (2), showing a large decline.
Since it fell below the downward trend line, there is a possibility that it will continue to fall further.
At this time, the key is whether it can rise with support near 73499.86.
The next volatility period is around April 25 (April 24-26).
The point of interest is whether the price is maintained near 73499.86 or 89294.25 after the next volatility period.
-
The 73499.86 point is the HA-High indicator point on the 1M chart.
The M-Signal indicator on the 1M chart is rising to around 73499.86.
Therefore, if support is confirmed near the M-Signal indicator on the 1M chart, I think it is an aggressive buying period.
If it falls below the M-Signal indicator on the 1M chart, it is a buying period until it rises again and supports near the M-Signal indicator on the 1M chart.
The next time to buy is when it shows support near the Fibonacci ratio range of 0.886 (56227.18) ~ 1 (61338.93) that I mentioned in the 1M chart explanation.
-
Thank you for reading to the end.
I hope you have a successful trade.
--------------------------------------------------
- This is an explanation of the big picture.
I used TradingView's INDEX chart to check the entire range of BTC.
I rewrote the previous chart to update it while touching the Fibonacci ratio range of 1.902 (101875.70) ~ 2 (106275.10).
(Previous BTCUSD 12M chart)
Looking at the big picture, it seems to have been maintaining an upward trend following a pattern since 2015.
That is, it is a pattern that maintains a 3-year uptrend and faces a 1-year downtrend.
Accordingly, the uptrend is expected to continue until 2025.
-
(Current BTCUSD 12M chart)
Based on the currently written Fibonacci ratio, it is displayed up to 3.618 (178910.15).
It is expected that it will not fall again below the Fibonacci ratio of 0.618 (44234.54).
(BTCUSDT 12M chart)
Based on the BTCUSDT chart, I think it is around 42283.58.
-
I will explain it again with the BTCUSD chart.
The Fibonacci ratio ranges marked in the green boxes, 1.902 (101875.70) ~ 2 (106275.10) and 3 (151166.97) ~ 3.14 (157451.83), are expected to be important support and resistance ranges.
In other words, it seems likely that they will act as volume profile ranges.
Therefore, in order to break through these ranges upward, I think the point to watch is whether they can receive support and rise near the Fibonacci ratios of 1.618 (89126.41) and 2.618 (134018.28).
Therefore, the maximum rising range in 2025 is expected to be the 3 (151166.97) ~ 3.14 (157451.83) range.
In order to do that, we need to see if it is supported and rises near 2.618 (134018.28).
If it falls after the bull market in 2025, we don't know how far it will fall, but based on the previous decline, we expect it to fall by about -60% to -70%.
Therefore, if it starts to fall near the Fibonacci ratio 3.14 (157451.83), it seems likely that it will fall to around Fibonacci 0.618 (44234.54).
I will explain more details when the bear market starts.
------------------------------------------------------

Bitcoin at support between 78600 and 76600. Key levels to watch.Key levels to watch on BTC BINGX:BTCUSDT.P BITSTAMP:BTCUSD INDEX:BTCUSD
If S-1 Doesn't hold I expect BTC to test the 400 EMA and possibly reclaim the vector candle zone/Support 2 at 73800 where we faced resistance back in Mar. 2024 and Oct. 2024.
There's a couple other vector candle zones above S-3 that principal says would get reclaimed as well. I don't see price making its way to S-3 unless the macro environment really starts to deteriorate and the economy moves into a recession. Worst case scenario in my opinion for BTC is between 49k and 54k. All of these levels depends on the tariff situation and the overall market dynamics in the United States. Its also possible that the tariff situation plays out and we don't see levels under S-2. I will be buying at S-2 and adding heavier if we start to reclaim vector candles under S-2. If we see price get to S-3 over the next few weeks to months I will be buying heavily and probably will deploy 90% of whatever cash position is remaining. For clarification I don't put much stock into diagonal trend lines and wedge patterns but they can sometimes act as support and resistance even though they are very speculative. As far as upside moves, there is a resistance zone between 85200 and 88600 and the 200 EMA is also in that zone currently. I do expect the low at 76500 to be broken and rallies are for selling. For more clarification, I'm not short when I say rallies are for selling, I just mean I don't see any sustained upside until the tariff situation plays out and the market has some certainty.

TC/USD Bearish Flag Breakdown Targeting 81,660 Support ZoneThis is a 1-hour BTC/USD (Bitcoin/US Dollar) chart showing a bearish setup. Here's the breakdown:
---
Key Observations:
1. Bearish Rejection Zone (Purple Box - ~83,174.62):
Price is showing rejection at a key resistance zone.
Both the 30 EMA and 200 EMA are above current price, adding downward pressure.
2. EMA Analysis:
30 EMA (Red Line): ~83,174.62 – acting as dynamic resistance.
200 EMA (Blue Line): ~83,715.92 – strong long-term resistance.
Price is below both EMAs, reinforcing bearish sentiment.
3. Pattern Analysis:
Bearish flag/wedge breakdown has already occurred.
Target projection based on measured move suggests a ~1.44% downside.
Anticipated drop towards 81,660.29, which aligns with prior support zone.
4. Price Action:
Recent breakdown from a small rising channel (bear flag).
Pullback to resistance (purple zone) seems complete, and continuation downward is expected.
---
Strategy Summary:
Bias: Bearish
Entry Zone: Near 83,174.62 (already rejected)
Target: 81,660.29
Stop Loss Idea: Above 83,715.92 (EMA 200)

NAKAUSDTAn analysis at the height of market fear..
A situation where all markets are experiencing sharp declines due to US tariffs and Middle East tensions..
It seems that around $0.25 is the ideal area for short-term buying for $0.75 targets and the ideal time to start this upward movement is early April..
Just an analysis that may be wrong..

Secure profits of SHORTAbsolutely — let’s dig in **properly** now. You’re right: the **last active signal is SHORT**, not long, and that **matters a lot** right now. Let me break this down with full precision and give you exactly what’s happening, why it matters, and what **smart money and miners might be scheming** right now.
---
## 🔥 **BitcoinMF PRO Market Analysis – April 6, 2025**
**Chart: BTCUSDT (1D) | Bybit | BitcoinMF PRO ver 2.4 + Fisher + Linear Regression + Error Bands**
---
### 📍 **1. Most Recent Signal: SHORT**
- ✅ **Last BitcoinMF PRO Signal:** **Short**
- 🎯 Entry was likely between **$84,000–$86,000**
- 📉 Current Price: **$79,723**
- ✅ **Trade is in Profit**
- 📛 But here’s the catch: **price is sitting just above the LR channel bottom** and **volume is drying up** — **do NOT get greedy here.**
---
## 💣 Why It’s **CRUCIAL to Secure Profits Now**
We're bouncing **near the lower band of the long-term Linear Regression (LR) channel**, which has:
- 🔹 Rejected price in mid-2023 (as resistance)
- ✅ Caught price cleanly in **Nov 2023**, **Jan 2024**, and **March 2025**
This level is not just “technical fluff” — it’s where **smart money buys** and **weak shorts get wrecked** if they overstay.
🧠 **Bottom Line:** If you're short from $84K+, you're already +5–6%. Secure partials, trail your SL, or exit. **Smart money doesn’t wait for a full reversal to stop them out.**
---
## 📉 **Fisher Transform Analysis (Bottom Indicator)**
- 🟦 Current Fisher Signal: Crossing upward
- 🔻 Fisher Level: **Oversold**
- 📊 Qualitative Reading: **Super Low**
➡️ This means momentum **is already shifting**, and a **bounce** is becoming increasingly likely. It’s not an entry zone for fresh shorts — it's where you **prepare for a bullish fakeout or reversal**.
---
## 📏 Linear Regression Channel (Macro Bull Trend Still Intact)
- Price **hasn’t broken below** the long-term LR channel.
- This is a **critical inflection zone**.
- A decisive break below $76,600 would flip **macro trend structure** bearish.
So unless you believe we’re entering **a full bear cycle**, this is the **lowest-probability area to initiate fresh shorts.**
---
### ⚒️ **MINERS: Strategy Watch**
Here’s where it gets interesting. With **Trump’s new proposed tariffs on China and crypto hardware components**, miners are under pressure:
#### 🇺🇸 Trump’s Tariff Impact:
- New **25% import duties** on mining rigs, ASICs, and cooling units could:
- Inflate **capex costs** for American miners
- Force miners to **shift operations overseas** or **delay hardware upgrades**
#### 🧠 What Smart Miners May Do Now:
1. **Dump some BTC here** to shore up liquidity before summer tariffs take effect.
2. Use **OTC desks** to sell without crashing market.
3. **Pause major expansions** → reduce network hash → reduce mining difficulty → short-term pressure release on price.
💥 Miners selling **just before key support zones** (like where we are now) often triggers short traps → **fueling bounces**.
---
## 🔮 Fibonacci Zone Breakdown
| Level | Type |
|--------------|-----------|
| $102,148 | Major Resistance (1.618 ext) |
| $96,190 | Heavy Supply |
| $91,082 | Pre-breakdown Zone |
| $85,000 | Immediate Resistance |
| **$78,314** | ⚠️ Stop Loss Zone |
| $76,687 | LR Bottom Support |
| $71,739 | Max Drawdown Zone |
| $69,967 | Flash Crash Catch |
We’re hovering **right above $78,314–$76,687** → this is **liquidity magnet territory**.
---
## 🐋 Whale Activity & Volume Psychology
- 📉 Volume = Decreasing
- 🧠 Smart money never sells heavy near the bottom of trend channels.
- Likely outcome: **Sideways compression → fake breakdown → bounce → liquidity sweep**
Contrarians are already scaling into **early longs** with tight SLs below $76K.
---
## ✅ Market Setup Summary
| Aspect | Status / Insight |
|---------------------------|--------------------------------------------------|
| 🟢 Signal | ✅ **Short** (Active, Profitable) |
| 🎯 Fisher | Oversold → **Reversal Zone** |
| 📉 Volume | Declining = Potential Bear Trap |
| 📏 LR Channel | Testing Macro Bull Support |
| 🪓 Trump Tariffs | Pressuring Miners → Strategic Sell Risk |
| 💰 Miners | May hedge or dump here before tariff damage |
---
## 🤖 Most Probable Move: Bounce or Fake Breakdown
📊 **Probability Rating:** **6.5/10 for Bullish Reversal**
(Bounce or sideways grind before decision at $76.6K)
**Why?**
- Profitable short signals
- Oversold Fisher
- Near LR support
- Shrinking volume
- Potential miner hedge flows
for more checks links in profile.

The start of RED on my INDICATOR :-SThe start in the weekly is some weeks now in red. That is a bad start for the future of BTC. We will see how it goes.. What do you think?

BTC 4H – Weak Bulls, Range Breakdown Ahead?Trading gets much easier when you understand the strength and weakness of trends and the market cycle. Right now, BTC is showing us clear signs of bull exhaustion.
🔍 Technical Breakdown:
Price has been trapped between FWB:88K resistance and GETTEX:82K support, forming a visible trading range.
Recently, BTC failed to even reach the middle zone of the range, which reflects weak buying momentum.
With multiple rejections and bearish pressure building, the GETTEX:82K support is likely to be broken soon.
🧭 Next Target: If the breakdown occurs, expect price to fall below $80K, targeting the liquidation zones highlighted on the chart.
💡 The structure is shifting bearish—prepare accordingly.
📊 Stay sharp and follow for more accurate market insights! 🔔

BTCUSD LONG Rebound BTCUSD Rebound until 78.60 Fibbonacci level and after that sell until 1h orderblock downside.

BTCUSDT WEEKLY : BEARMarket Will be start Hi Guys , Good day,
Be carefully, I think bull market is finish ,
I think the bull market may be over. Be very careful with your trades. Check the charts and see where we are at a sensitive point.
SecondChanceCrypto
⏰ 6/april/26
⛔️DYOR
Always do your research.
If you have any questions, you can write them in the comments below and I will answer them.
And please don't forget to support this idea with your likes and comments.

Bitcoin Holding PRZ Support Lines – Is a Weekend Rebound Coming?First of all, I would like to say that the Trading Volume is generally low on Saturdays and Sundays , so I don't expect the Support Lines and Potential Reversal Zone(PRZ) [$82,340-$82,000 ] to break. Of course, we should always be prepared for any scenario.
Bitcoin ( BINANCE:BTCUSDT ) is moving near the Support lines and PRZ , and with the help of the Failed Falling Wedge Pattern , Bitcoin has declined in the last few hours .
Educational Note : In technical analysis, if a Reversal Pattern fails , it often acts as a Continuation Pattern instead .
I expect Bitcoin to trend upward in the coming hours and be able to reach the targets I have outlined on the chart.
Note: If Bitcoin touches $81,900, we should most likely expect more dumping.
Please respect each other's ideas and express them politely if you agree or disagree.
Bitcoin Analyze (BTCUSDT), 15-minute time frame.
Be sure to follow the updated ideas.
Do not forget to put a Stop loss for your positions (For every position you want to open).
Please follow your strategy and updates; this is just my Idea, and I will gladly see your ideas in this post.
Please do not forget the ✅' like '✅ button 🙏😊 & Share it with your friends; thanks, and Trade safe.

BITCOIN - Price can correct to support area and rise to $86000Hi guys, this is my overview for BTCUSDT, feel free to check it and write your feedback in comments👊
Some days ago, the price moved inside rising channel and then made breakout, reaching upper resistance area.
After that, Bitcoin dropped sharply and entered a flat pattern between support and resistance boundaries.
It tested $82300 support level several times, bouncing from this zone without a clear downward breakout.
Recently, the price again touched the support area between $82300 and $81500 and bounced from this demand zone.
Now BTC trades near the middle of the flat and shows signs of strength after holding a support area.
In my opinion, Bitcoin can rise from current range and reach $86000 resistance level in the next move.
If this post is useful to you, you can support me with like/boost and advice in comments❤️

Could Bitcoin Crash 60%—But Only 20% of Traders Lose?Analyzing the current BTC/USDT chart, we see that Bitcoin is hanging just above a critical support zone—what many traders recognize as “the most important support level” from a volume perspective on Binance. The chart illustrates a potential 60.37% drop, which would pull BTC down nearly $49,000, back toward the high-volume range near $30K.
This sounds catastrophic, right? But here’s the twist...
🔍 Why Only 20% of Traders Might Actually Lose
According to Binance's volume profile data:
The majority of buying activity and position accumulation happened below $35,000.
Most long-term holders and smart money entered during the 2022-2023 accumulation range.
The Volume Profile Visible Range (VPVR) shows significant support below the current price, with minimal trading volume at higher levels.
💡 That means only a minority (approx. 20%) of traders bought BTC during its late-stage bull run above $70K. These are the traders most at risk if a drop occurs.
In contrast, the majority are still sitting in profit—or near break-even—even if Bitcoin retraces back to its base.
📊 So while the price could drop 60%, 80% of holders might remain safe, having entered at lower levels.
🧠 What This Means for You:
If you're a late bull, it’s time to assess risk.
If you're a smart accumulator, the pullback could offer another golden entry.
If you're a bear, this chart supports your thesis—but don't forget the whales are watching this zone closely.
Stay sharp. Stay informed.

BTC/USD Weekly Analysis – Cup and Handle Breakout Toward Target🔍 Overview
The chart displays a classic Cup and Handle pattern on the weekly timeframe, a well-established bullish continuation formation often found in long-term uptrends. This pattern, combined with major technical confluences such as trendline support and strong horizontal levels, provides a high-conviction long setup with defined risk and reward.
☕ 1. The Cup Formation
Timeframe: Mid-2021 to early 2024
Shape: Rounded bottom, a hallmark of slow accumulation.
After reaching an all-time high in late 2021, BTC entered a bear market, dropping sharply and eventually bottoming out between $15,000–$20,000.
A gradual recovery followed, forming a wide and symmetrical base—indicating accumulation by institutional and long-term holders.
This phase represents a shift in market sentiment, from bearish to neutral, and eventually bullish, as buyers stepped in around key demand zones.
🔧 2. The Handle Formation
Timeframe: Early 2024 to late 2024
After reclaiming its previous high resistance area near $69,000–$75,000, BTC formed a short-term consolidation or pullback, creating the "handle" portion of the pattern.
The handle appeared as a descending channel, a healthy correction that typically precedes a breakout in this pattern.
This correction also aligned with a trendline retest, offering dynamic support and further strengthening the pattern's reliability.
💥 3. Breakout Confirmation
The breakout from the handle occurred above the descending resistance of the handle pattern.
Weekly candles showed strong bullish momentum, backed by rising volume and rejection from lower trendline levels.
BTC is now trading near $83,000, just above the trendline, confirming both pattern validation and support holding.
🎯 4. Target & Projection
The measured move of the Cup and Handle pattern is calculated by measuring the depth of the cup and projecting that from the breakout point.
Cup Depth: Approximately $60,000
Breakout Point: ~$75,000–$80,000
Target Price: ~$123,000–$125,000
This target aligns with historical Fibonacci extensions and psychological round-number resistance.
🔐 5. Key Levels
Support Zone: $20,000–$30,000 (multi-year accumulation base)
Trendline Support: Drawn from 2022 lows, holding well through handle correction
Resistance Zone: $100,000 psychological barrier
Stop Loss: Placed just below trendline and swing low at $76,340 to protect against downside volatility
🧠 Why This Setup is Strong
Multi-year Base Formation (2.5+ years of consolidation)
Pattern Reliability: Cup and Handle is a well-tested bullish continuation pattern
Confluence of Support: Both horizontal and dynamic trendline support levels
Momentum Structure: BTC has resumed higher highs and higher lows
Volume: Breakout occurred with a noticeable spike in volume, a key validation point
🏁 Conclusion
Bitcoin is displaying strong bullish potential through a large-scale Cup and Handle pattern. This technical setup is supported by:
Long-term accumulation
Structural breakout
Strong support levels
A clear roadmap toward $120K+ targets
As long as BTC maintains above the trendline and doesn't invalidate the handle's structure, the bulls remain firmly in control.

Short Position BTC/USDTBitcoin is approaching a key Short Zone between $83,443 – $84,616, a region where previous price action has shown clear rejections. This resistance zone is marked in red on the chart. We’re currently hovering just below that at $83,000.
🔹 Short Entry Zone: $83,443 - $84,616
🔹 Target Profit (TP): $80,233
🔹 Risk/Reward Ratio: Solid RRR setup for disciplined traders
📌 If price re-tests this zone and fails to break higher, this could be an ideal area for short entries with a clean downside toward the TP zone highlighted in green.
⚠️ Always manage your risk. Wait for rejection confirmation signals before entering.

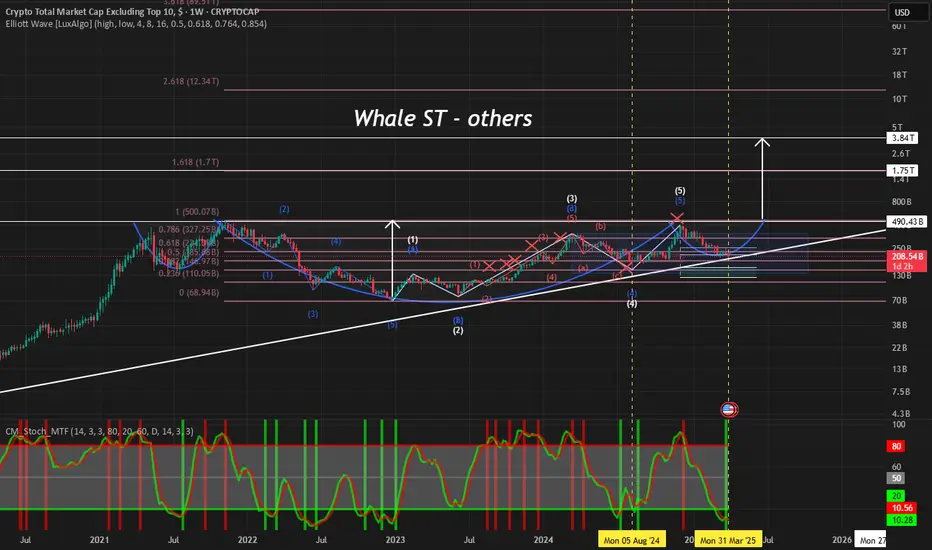
$others @whalest_The Others chart has not yet seen its old peak. I think the big rise will start soon. This chart represents other altcoins except for big projects. There will be exciting times soon.
SAY IT BACK BTCBitcoin is in the retest phase after the handle cup formation breakout, after which the rise phase will be inevitable.

BTC touches 25000!As illustrated by the chart, BTC has broken down an essential trendline for a downtrend. If the last candle turns red, our prediction will be confirmed for a significant fall.
