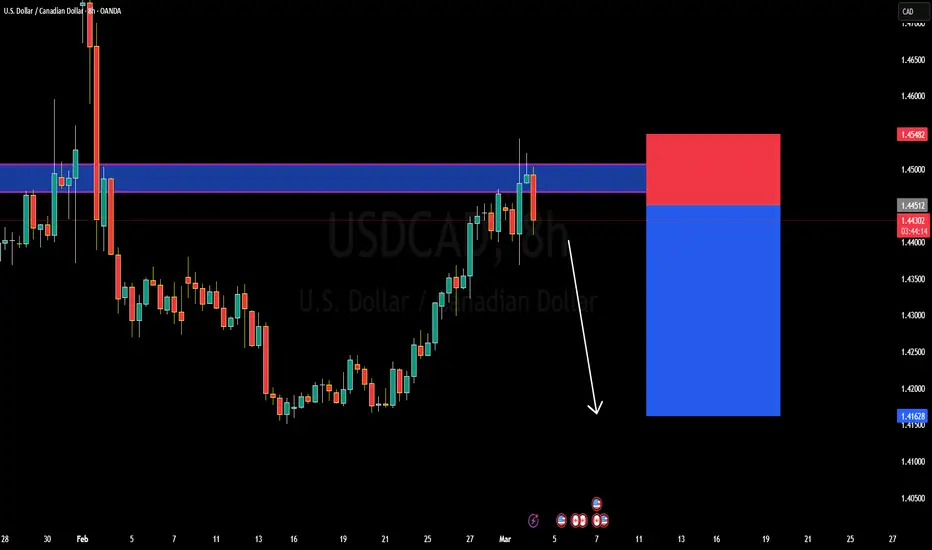
Why USDCAD Dropping? Technical and fundamentalsUSDCAD is currently trading around 1.44200, facing strong resistance at this level. The pair has tested this resistance multiple times and is showing signs of rejection, indicating a potential bearish reversal. If sellers gain control, we could see a downward move toward the 1.42200 target. This setup aligns with key technical patterns, suggesting that the rejection from resistance could drive further downside momentum.
From a technical perspective, the resistance level at 1.44200 has proven to be a strong barrier for buyers, leading to repeated pullbacks. If price fails to break above this zone, bearish pressure is likely to increase. A confirmed rejection with a strong bearish candlestick formation could provide further confirmation of a downtrend, making this a high-probability short setup.
Fundamentally, USDCAD’s movement is influenced by the strength of the US dollar and oil prices, as Canada’s economy is heavily linked to crude oil. Any rebound in oil prices could strengthen the Canadian dollar, adding to the bearish case for USDCAD. Additionally, market expectations regarding Federal Reserve interest rate policy and economic data releases could play a crucial role in shaping the pair’s next move.
In summary, USDCAD is facing significant resistance at 1.44200, with clear rejection signals indicating potential downside toward 1.42200. Traders should watch for further bearish confirmations while considering fundamental drivers like oil price fluctuations and central bank policies to validate the trade setup.
BTCUSDT
Bitcoin & Trump Effect: A Short-Term Pump or Sustainable Rally?Bitcoin ( CRYPTO:BTCUSD ) started to rise as I expected in the previous post , but Donald Trump helped double the momentum of Bitcoin yesterday. But the question here is whether the correction of Bitcoin is over or if this is an increase in the chance of exit.
Bitcoin is trying to break the Heavy Resistance zone($93,300_$89,250) .
According to the theory of Elliott waves , it seems that Bitcoin has succeeded in completing wave 4 and we should wait for wave 5 .
Note : Due to the high momentum of wave 3, it is possible that wave 5 is a truncated wave.
I expect Bitcoin to rise to at least $95,000 in the coming hours. The next target of Bitcoin can be Resistance lines and 100_SMA(Daily) .
What do you think about Bitcoin movement? Time to escape or wait for a new All-Time High(ATH) to be created?
Note: If Bitcoin goes below $89,000, we can expect Bitcoin to decline and the big CME Gap($91,610-$84,830) to be filled.
Please respect each other's ideas and express them politely if you agree or disagree.
Bitcoin Analyze (BTCUSDT), 1-hour time frame.
B e sure to follow the updated ideas.
Do not forget to put a Stop loss for your positions (For every position you want to open).
Please follow your strategy and updates; this is just my Idea, and I will gladly see your ideas in this post.
Please do not forget the ✅' like '✅ button 🙏😊 & Share it with your friends; thanks, and Trade safe.

levels to watch I previously mentioned that a broader market correction was highly likely, predicting that after the market coiled within the 95k-100k range, a downturn would be inevitable. The correction was expected to bring the market down to around 75k.
As we’ve seen, the market fell to 78k but has since rallied back to 92k. However, for the market to regain renewed momentum and strength, it would need to close above the 95k level. If that happens, there’s a possibility that the market could test the 108k range once again. On the other hand, if the market fails to break and hold above the 95k mark, sellers are likely to return, leading to a potential retest of the 75k level.

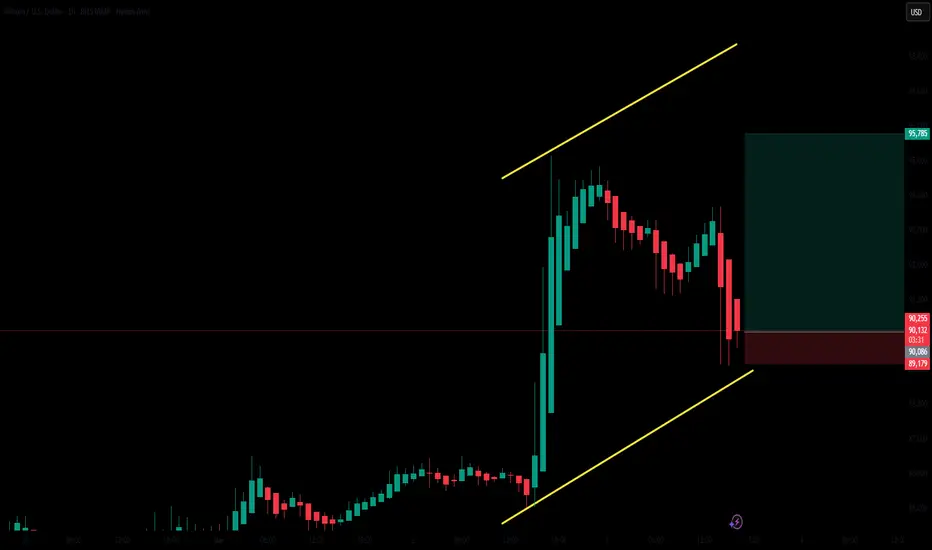
$RIO - Chart RequestThis is what I'm expecting from RIO, not something I'm holding
I'd be careful here, and you'd be much better holding a strong token than this one.
If the green box fails to hold, it's gone...

Bitcoin Final UpdateEverything on the charts...
Up to you now... Yes... I believe it's just Reaccumulation
Look at the previous posts for more explanation and all perspectives
I'm holding and I'm bullish...We will witness an alt season this year (those saying we won't will be proven wrong...)
BTC.D will fall and strong alts will rise (with massive returns)
Until Next Time...

BITCOIN - FAKE BREAKDOWNHello Traders !
The Bitcoin failed to break the support level (89000 - 92000).
The price formed a bullish candlestick pattern.
So, I expect a bullish move🚀
____________
TARGET: 104300🎯

Trump's Bombshell Strategic Reserve Announcement.Let's summarize the situation.
We were on the edge of slipping into a bear market, with CRYPTOCAP:BTC under heavy selling pressure and looking bearish on daily, hourly, and weekly timeframes.
A lot of people were caught off guard, selling their crypto to prepare for shorts and ending up sidelined—I was one of them, and I’m pissed. Since I live in Asia, I was asleep when it happened, and so was the entire Asian market.
Then, conveniently, Trump announced the strategic crypto reserve, which was originally scheduled for Friday to coincide with the White House crypto summit. Meanwhile, the tariffs are set to take effect on Tuesday.
On the global stage:
- The rejection of Zelensky has pushed Europe to react, with some leaders now considering sending troops to Ukraine. This could seriously complicate things for the Trump administration and potentially escalate into WWIII. No joke, this is a serious situation.
- Israel has decided to destroy Gaza completely and is now enforcing a full-scale siege, which will cause massive international backlash. The situation there never been so bad.
- Recession fears are mounting, and we can see markets starting to shake and correct.
And then Trump drops his crypto reserve announcement…
- This was a sloppy reveal—posted only on his own platform, not on X—which caused panic, as people scrambled to verify the source, thinking it was fake news.
- Even worse, the initial announcement didn’t mention Bitcoin or Ethereum! Instead, they listed CRYPTOCAP:XRP , Cardano, and Solana as part of the reserve, which made people think their accounts were hacked. Later, they corrected it, clarifying that CRYPTOCAP:BTC and CRYPTOCAP:ETH are at the "heart" of the reserve.
So yeah… Sunday night, completely unexpected, and poorly executed.
What does this mean for CRYPTOCAP:BTC ?
- Weekly timeframe: Nothing has changed—it’s still in a serious correction, and a 10% daily pump isn’t enough to reverse the trend. My previous analysis is still valid.
- Daily timeframe: The MACD has reset, and RSI is now in a neutral zone. This suggests a potential short-term pump over the next few days.
- Key levels: Supports at $91k and $80k are back, but $99k remains a major resistance and could reject $BTC.
- Leverage & liquidity: A massive $4.3 billion in longs has been built up, meaning we’re likely to retest the downside to liquidate them.
- CME gap: We just created a 10%+ CME gap, which will most likely be filled.
Conclusion:
Optimism is back, and we could see a short altseason as capital flows into altcoins, now that some are officially part of the U.S. national reserve.
BUT the global situation remains extremely concerning:
- War tensions in Europe and the Middle East
- Recession risks still on the table
- Uncertainty about how this crypto reserve will actually work
This is great news, but going all-in on longs at this point seems risky. How long will this momentum last? More than a week? I’m not sure.
Technically, the correction isn’t over. Unlike December 2024—when Trump’s election happened at the end of a correction, with a bullish MACD crossover—we are now at the START of a weekly correction, which could last until May 2025.
So yeah, fundamentally bullish, but technically, the correction still has room to go.

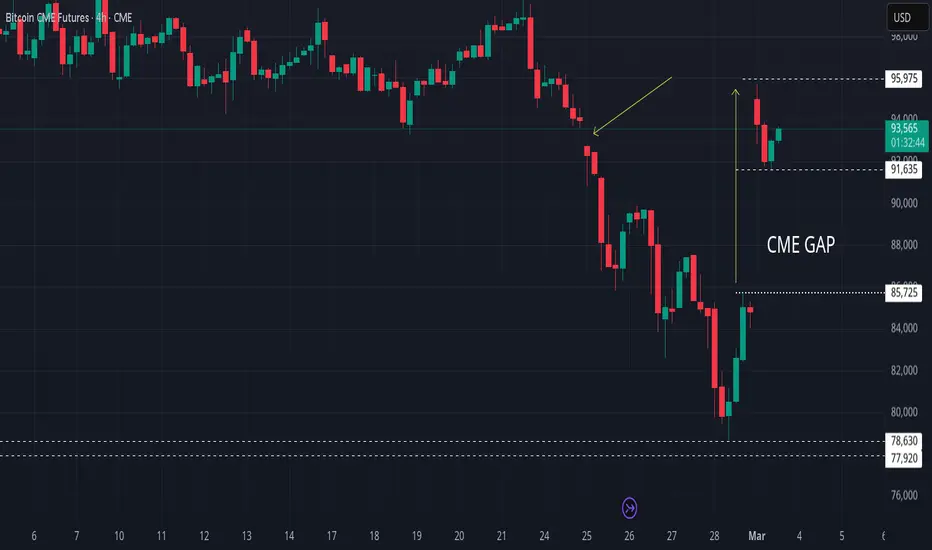
Bitcoin CME Gaps Wars UPDATEThat Gap that opened up so quickly over the weekemd...Nearly Full
I cannot wait to see which direction PA goes when we hit the Bottom of the Gap at around 85700
On a Short tem, PA has hit Support..........All eyes on the Gap

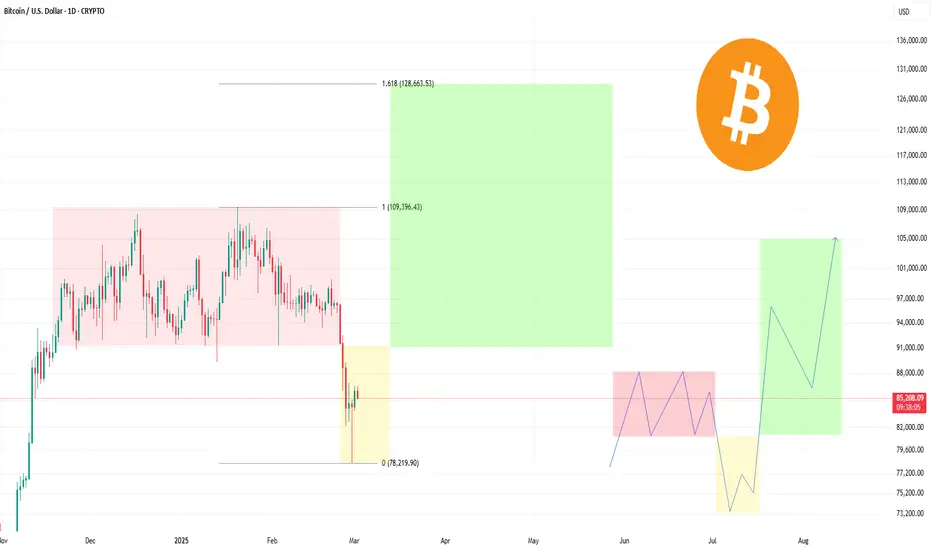
PO3 and Fibonacci: The Path to $128,000I've always been an advocate of analyzing data deeply and finding patterns where others see chaos. And today I want to share my perspective on one of the most exciting opportunities that are taking shape right now.
PO3 is not just an indicator, but a real key to understanding how the market shapes its moves. When you combine it with Fibonacci levels, a unique picture opens up in front of you that gives you a glimpse into the future. This is exactly the case when the data speaks for itself. Now, analyzing the current dynamics, I come to the conclusion that we can expect a significant rise in price to the level of 128,000 dollars. PO3 shows a clear direction and Fibonacci levels confirm the potential for such a move.
So, my prediction: $128,000 is not the limit of dreams, but a realistic goal that we can achieve. And those who understand this trend have a unique advantage.
Alex Kostenich,
Horban Brothers.
Bullish move on the 1 hour chart?There might be a possible bullish move on the 1 hour chart before a deep fall.
Stop loss: 89k
BTC | MASSIVE CORRECTION or BULLISH PATTERN?After the new of the recent ByBit hack, the entire market seems to have taken a dip.
(more on the bybit hack here:)
Luckily, seeing a 20% correction on Bitcoin isn't strange.. at all. It's actually quite common for the price to correct anywhere between 15% and 30%. The tell all sign will be whether or not we can reclaim the key support ABOVE 90k, otherwise we might be heading closer to that 30% dip.
Meanwhile.. another altcoin is approaching a key buy zone. Don't miss it, here:
_______________________
BINANCE:BTCUSDT

BTCUSDT: what happened and what will happenhello guys!
what do you think?!
will btc touch the blue area?!

93576.0-94742.35 : Uptrend conversion zone
Hello, traders.
If you "Follow", you can always get new information quickly.
Please also click "Boost".
Have a nice day today.
-------------------------------------
(BTCUSDT 1D chart)
The key is whether the price can maintain above the M-Signal indicator on the 1W chart and rise above 97226.92.
If it is supported near 93576.0-94742.35, it is expected to turn into an uptrend.
If not, it is important whether it is supported near 89294.25.
The reason is that if it falls below 89294.25 again, it is highly likely to eventually touch the M-Signal indicator on the 1M chart.
This volatility period is March 3-5.
-
Thank you for reading to the end.
I hope you have a successful trade.
--------------------------------------------------
- Big picture
I used TradingView's INDEX chart to check the entire range of BTC.
(BTCUSD 12M chart)
Looking at the big picture, it seems to have been in an upward trend since 2015.
In other words, it is a pattern that maintains a 3-year bull market and faces a 1-year bear market.
Accordingly, the bull market is expected to continue until 2025.
-
(LOG chart)
Looking at the LOG chart, you can see that the upward trend is decreasing.
Accordingly, the 46K-48K range is expected to be a very important support and resistance range from a long-term perspective.
Therefore, we expect that we will not see prices below 44K-48K in the future.
-
The Fibonacci ratio on the left is the Fibonacci ratio of the uptrend that started in 2015.
In other words, it is the Fibonacci ratio of the first wave of the uptrend.
The Fibonacci ratio on the right is the Fibonacci ratio of the uptrend that started in 2019.
Therefore, it is expected that this Fibonacci ratio will be used until 2026.
-
No matter what anyone says, the chart has already been created and is already moving.
How to view and respond to this is up to you.
When the ATH is updated, there are no support and resistance points, so the Fibonacci ratio can be used appropriately.
However, although the Fibonacci ratio is useful for chart analysis, it is ambiguous when used as support and resistance.
This is because the user must directly select the important selection points required to create Fibonacci.
Therefore, since it is expressed differently depending on how the user specifies the selection points, it can be useful for chart analysis, but it can be seen as ambiguous when used for trading strategies.
1st : 44234.54
2nd : 61383.23
3rd : 89126.41
101875.70-106275.10 (Overshooting)
4th : 134018.28
151166.97-157451.83 (Overshooting)
5th : 178910.15
-----------------

Bitcoin CME Gap Wars continue with a Bigger New Gap- what next ?
Last week we saw the Bitcoin PA Drop down and begin filling that existing CME gap, that had opened in Nov 2024
CME Gaps ALWAYS get filled I said. And they usualy do
PA got down to 78600 and bounced back up. It had NOT completely filled the Gap, leaving a gap from 78600 down to 77920.
This is a small gap But significant in that the BTC Bulls pushed PA up before the gap was filled....waving 2 fingers at he CME.
CME Closes for the Weekend and the price at close on Friday evening was around 85345
I thought we were going to see PA turn and drop back down to complete the Fill..I even had a Spot Buy order down there..
BUT NO - The Bulls arrived again and BANG-
When CME opened for the New weeks trading, Bitcoin was up at EXACTLY 95K
This had created a NEW gap, with the remains of the older one just below.
And so now, Whats next ?
Since then, PA dropped to 91635, Filling a more recent smaller gap and has since then, pushed back up higher.
When will the Bigger new Gap get filled ?
We have a number of possible scenarios and I think my preferred one is that we revisit the Lower levels, Fill the Gap and at the same time, continue to cool off that Still Bearish weekly MACD., whihc, once at Neutral, will have more than enough ability to push to s decent new Cycle ATH in Q4
Another option is that BTC PA ranges high, for Longer and Cools off that Weekly MACD, till around June, Leave the gap open for a later date
OR, PA Simply pushes to a New ATH now, exhausts itself and falls hard after, filling the Gap as it plunges to 65K or Lower.
Take your pick
The MACRO side of Xrypto now is noce but I do worry about how this cold all just make Bitcoin rise to Fast and go POP at the top
We need to continue the Slow Steady rise, maintain a balance and act like Adults..Not like Teenagers with a new Bag of Sweets.
Be REALLY careful righ tnow, But MAKE MONEY TOO But remain cautious.
This Gap WILL GET FILLED ONE DAY
BTC's Potential Up to 77K & Down to 130K? Here’s WhyBINANCE:BTCUSDT has both bullish and bearish scenarios in play now.
These days, the crypto market has been stagnant—no real pump, no real dump.
🔻 If it drops, how low will it go?
There’s a potential multiple-top pattern.
If CRYPTOCAP:BTC breaks below the neckline at $92,000 with volume—or fails to reclaim it—then the target drop sits at $77,000.
🚀 If it pumps, how high can it go?
A potential multiple-bottom pattern is forming.
If MARKETSCOM:BITCOIN breaks above the neckline at $107,000 with volume—or successfully retests it—then the target is $130,000.
🔥 Short-term strategy
The Feb 3rd candle had significant volume and has been a key resistance level multiple times.
This makes it a strong reference point for entries.
(See orange & light blue arrows.)
1️⃣ Long Setup
Entry trigger: $102,500 (Feb 3rd high)
Stop loss: $91,231 (Feb 3rd low)
2️⃣ Short Setup
Entry trigger: $91,231 (Feb 3rd low)
Stop loss: $102,500 (Feb 3rd high)
💡 Prices vary across exchanges. Use the prices from your trading platform.
🔴 Read my signature & publications for more info you don’t want to miss.
🔥 for more future script "guesses" like this!

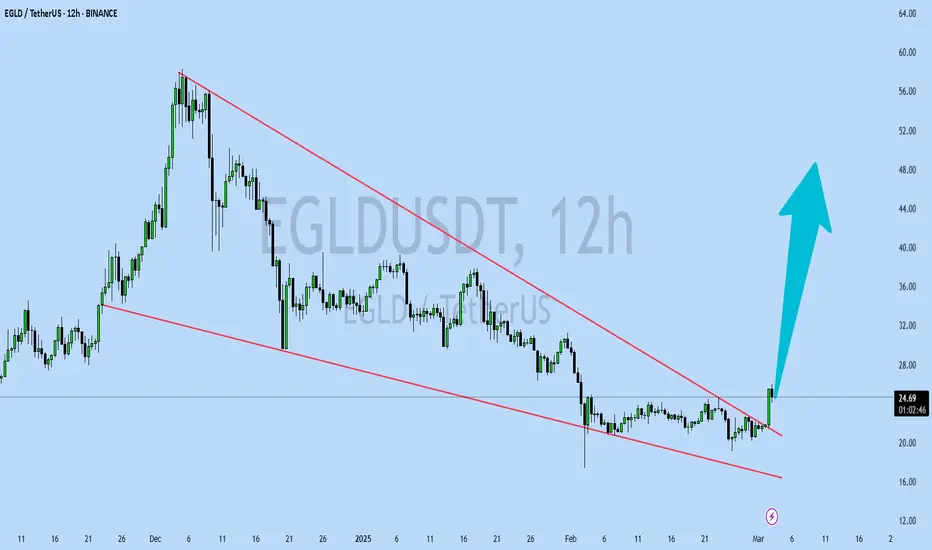
EGLDUSDT UPDATEEGLDUSDT is a cryptocurrency trading at $24.65. Its target price is $48.00, indicating a potential 90%+ gain. The pattern is a Bullish Falling Wedge, a reversal pattern signaling a trend change. This pattern suggests the downward trend may be ending. A breakout from the wedge could lead to a strong upward move. The Bullish Falling Wedge is a positive signal, indicating a potential price surge. Investors are optimistic about EGLDUSDT's future performance. The current price may be a buying opportunity. Reaching the target price would result in significant returns. EGLDUSDT is poised for a potential breakout and substantial gains.