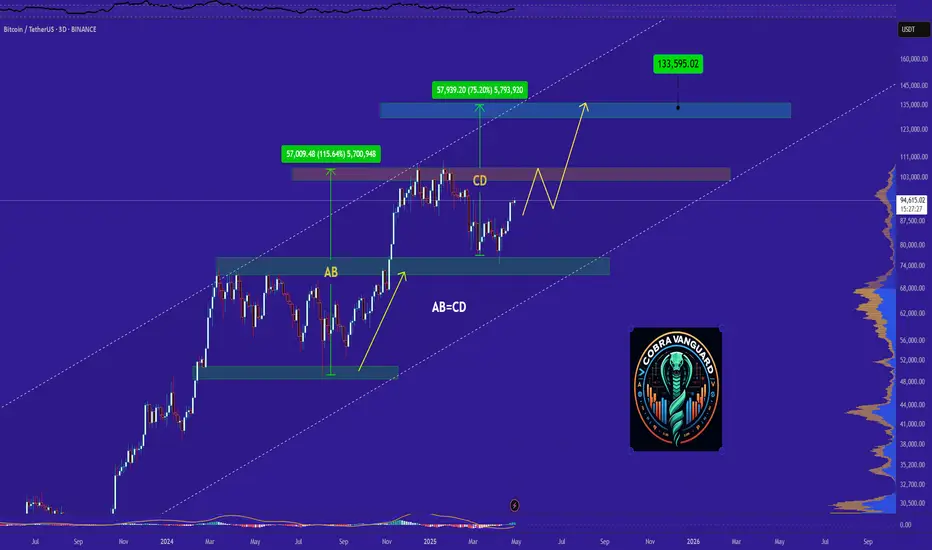
bitcoin road map !!!Chart is speaking itself...
Give me some energy !!
✨We spend hours finding potential opportunities and writing useful ideas, we would be happy if you support us.
Best regards CobraVanguard.💚
_ _ _ _ __ _ _ _ _ _ _ _ _ _ _ _ _ _ _ _ _ _ _ _ _ _ _ _ _ _ _ _
✅Thank you, and for more ideas, hit ❤️Like❤️ and 🌟Follow🌟!
⚠️Things can change...
The markets are always changing and even with all these signals, the market changes tend to be strong and fast!!
BTCUSDT

EURGBP DETAILED ANALYSIS TECHNICAL AND FUNDAMENTALSEURGBP is currently trading around 0.85, having completed a successful breakout and retest of the previous resistance-turned-support level. The price action aligns with a classic bullish continuation pattern, suggesting that the pair is poised for another upward move. My target for this bullish wave is 0.88, which corresponds to the next significant resistance zone.
Technical indicators support this outlook. The formation of a falling wedge pattern on the 4-hour chart has been confirmed, with the breakout leading to a sustained upward trajectory. The retest of the breakout level has held firm, indicating strong buyer interest and the potential for continued bullish momentum.
From a fundamental perspective, the euro is gaining strength due to improved economic indicators in the Eurozone, while the British pound faces headwinds amid ongoing fiscal policy uncertainties in the UK. This divergence in economic outlooks is contributing to the euro's relative strength against the pound, further supporting the bullish case for EURGBP.
In summary, the combination of technical patterns and fundamental factors suggests that EURGBP is well-positioned for a move toward 0.88. Traders should monitor key support levels to manage risk and look for confirmation of continued bullish momentum as the pair approaches the target zone.

Do you think I'm joking ???I might be wrong and this might never happen, but it might come true From a technical perspective!!!
Give me some energy !!
✨We spend hours finding potential opportunities and writing useful ideas, we would be happy if you support us.
Best regards CobraVanguard.💚
_ _ _ _ __ _ _ _ _ _ _ _ _ _ _ _ _ _ _ _ _ _ _ _ _ _ _ _ _ _ _ _
✅Thank you, and for more ideas, hit ❤️Like❤️ and 🌟Follow🌟!
⚠️Things can change...
The markets are always changing and even with all these signals, the market changes tend to be strong and fast!!
Bitcoin Upward Move Is Near
Bitcoin looks like it will have a temporary correction to the upside and then move higher after the interest rate announcement. The $110,000 mark is the main resistance that will be examined in the following analysis.

MAGICUSDT UPDATE
MAGIC Technical Setup
Pattern: Symmetrical Triangle Breakout
Current Price: $0.2253
Target Price: $0.290,
Target % Gain: 30.06%
Technical Analysis: MAGIC has broken out of a symmetrical triangle on the 4H chart with a strong green candle and volume spike, signaling bullish momentum and a potential 30% upside move.
Time Frame: 4H
Risk Management Tip: Always use proper risk management.

BTCUSD:Adopt range trading before the breakout.Given that a number of important data are about to be released intensively, the market volatility is rising sharply. Before a clear breakout signal in the price is formed, it is recommended that within the range of $93,000 - $96,000, the range trading strategy be flexibly applied: sell at highs, and then buy at lows to build positions when the price drops back to the support level, so as to seize the band trading opportunities in the volatile market. At the same time, strictly control the position size to prevent the risk of sudden and significant fluctuations triggered by the data release.
BTCUSD
buy@93000-93500
tp:95000-95500
sell@96000-95500
tp:94000-93500
In the future, we will continue to monitor the market changes and update the trading strategies in real time.
I am committed to sharing trading signals every day. Among them, real-time signals will be flexibly pushed according to market dynamics. All the signals sent out last week accurately matched the market trends, helping numerous traders achieve substantial profits. Regardless of your previous investment performance, I believe that with the support of my professional strategies and timely signals, I will surely be able to assist you in breaking through investment bottlenecks and achieving new breakthroughs in the trading field.

Would BTC ever touch 100k?This is 12H and based on pure pattern, Normally this pattern is made bullish where it would touch up, but while the market is moving, its shaking both the shorts and up-s liquidity, which means BTC would try to defy the pattern by rolling it dowm, remember when this type is made on big coins, it takes and falls down, however its based pure on PA

BTCUSDT 1W UpdateYes, history is likely to repeat itself, making it possible for Bitcoin to reach a new all-time high in the range of $130K to $150K this year.
Are you ready?

BTC Forming Bullish Pattern and Testing Red Resistance Zone 🚨 CRYPTOCAP:BTC Forming Bullish Pattern and Testing Red Resistance Zone 🚨
CRYPTOCAP:BTC has formed a bullish pattern and is currently testing a significant red resistance zone. A breakout above this level could confirm the bullish trend and signal further upward movement.
📈 Technical Overview:
Pattern: Bullish
Resistance Zone: Red area currently being tested.

Bitcoin's 215-Day Pattern: Another Breakout Loading?The Bitcoin chart shows a repeating pattern of consolidation lasting 215 days before each major upward breakout. This cycle has occurred multiple times over the past two years, with each accumulation zone followed by a strong bullish rally.
Currently, Bitcoin is once again emerging from a similar 215-day consolidation phase, suggesting the potential for another significant move to the upside if the pattern holds. If history repeats, we could see a target around $150K.
BINANCE:BTCUSDT CRYPTOCAP:BTC

BTC Correction Likely Before ATHBTCUSDT technical analysis update
BTC price could drop to the GETTEX:89K –$91K range before moving higher. There's a CME futures gap at $90.7K, which may act like a magnet. BTC has strong support around $90K and may see a small pullback before reaching a new all-time high.


BTC/USDT 1H Chart Analysis: Breakout Incoming?Hey traders! Let’s dive into this juicy BTCUSDT 1-hour chart. Bitcoin is teasing us with some serious action!
We’ve got a textbook symmetrical triangle pattern forming, with price consolidating tightly between converging trendlines. This is a classic setup for a big move — Bitcoin is coiling up like a spring, ready to explode!
The chart shows multiple phases of consolidation , with the latest triangle pushing BTC toward a critical decision point near the weekly high of $95,773.15 and the monthly high of $95,119.06.
The price is currently hovering around $95,000, testing resistance. A breakout above the upper trendline could send BTC soaring past $96,600, potentially targeting $97,200 or higher!
On the flip side, a rejection here might see it dip toward the daily low of $92,839.27 or even the lower trendline for support.
Key Levels to Watch:
Resistance: $95,773.15 (weekly high)
Support: $92,839.27 (daily low)
Breakout Target: $97,200+
Breakdown Target: $92,800
✉ What do you think — bullish breakout or bearish?
Drop your thoughts below!

Say hello to the $110k Bitcoin !The BTC will increase $15K and reach to the top of the wedge in the coming weeks .
Give me some energy !!
✨We spend hours finding potential opportunities and writing useful ideas, we would be happy if you support us.
Best regards CobraVanguard.💚
_ _ _ _ __ _ _ _ _ _ _ _ _ _ _ _ _ _ _ _ _ _ _ _ _ _ _ _ _ _ _ _
✅Thank you, and for more ideas, hit ❤️Like❤️ and 🌟Follow🌟!
⚠️Things can change...
The markets are always changing and even with all these signals, the market changes tend to be strong and fast!!

Bitcoin 6X Lev. Full PREMIUM Trade-Numbers —2nd Entry (PP: 540%)I will explain my thinking as usual so you can make an informed decision.
I believe Bitcoin will make a new advance. When there is a move that leads to the challenge of resistance or support, there is always a stop, a retrace or pullback before additional action. Bitcoin here stopped at 95,000, which is the first resistance from our previous trade-signal and did produce a retrace but it was extremely small. This is a bullish signal.
The fact that the action remains at resistance and this resistance continues to be challenged, is also a bullish signal. The more this resistance gets challenged the weaker it becomes.
Now, a 2nd entry is riskier than the first one of course because the action is more advanced but not everybody can enter perfectly at bottom prices nor at the same time.
We manage risk through capital allocation and relatively low leverage, which is actually pretty high.
See the full numbers and you will see that risk is low.
The stop goes below the low 13-Jan. 2025. The lowest after the final advance happened at $91,688 on 24-April. This is a relatively safe chart setup.
_____
LONG BTCUSDT
Leverage: 6X
1) $96,000
2) $93,000
3) $90,000
Targets:
1) $104,250
2) $120,000
3) $131,400
4) $143,300
5) $165,000
6) $181,000
Stop-loss:
Close weekly below $86,000
Potential profits: 540%
Capital allocation: 5%
_____
I think timing is good on this one. The next move can happen within days because consolidation has been happening already for an entire week without much change in price, clearly a continuation pattern. Volume being low at this point is also a signal of consolidation.
The fact that there is no volume indicates that the true bullish action is yet to start.
Bears not being present indicates that growth will happen long-term as the bearish cycle (the previous correction) is over.
I wishing you great luck and profits.
The market always offers a second chance, always.
Namaste.

GBPJPY DETAILED TECHNICAL AND FUNDAMENTALSGBPJPY is currently trading around the 191.00 zone, and price action is forming a classic bullish flag pattern on the 4H chart. This follows a strong impulse leg, suggesting a potential continuation to the upside. The consolidation is tight and healthy, showing market participants are preparing for a breakout. My upside target stands at 193.000, which aligns with the descending trendline resistance.
From a fundamental perspective, the British Pound remains supported by recent hawkish signals from the Bank of England, which is facing persistent inflation pressures. Meanwhile, the Japanese Yen continues to weaken across the board due to the Bank of Japan’s ultra-loose monetary stance and its defense of yield curve control, which makes it less attractive in a high-interest environment.
Technically, this setup aligns with key momentum indicators and market structure. If price breaks above the flag pattern with volume confirmation, we can expect buyers to take control, pushing price toward the 193.000 resistance zone. This level also coincides with a key liquidity area where prior sellers may be trapped.
Overall, GBPJPY continues to offer a solid bullish bias in the short term. The pair is fundamentally and technically aligned for a push higher. Breakout traders should monitor closely as the price approaches the upper trendline of the flag. This is one of the most watched JPY pairs right now—momentum is building.

BTCUSDTHello Traders! 👋
What are your thoughts on BITCOIN?
Bitcoin has reclaimed the $90K– GETTEX:92K zone after a sharp 32% correction from its all-time high, closing the week strongly above this critical area.
As long as price holds above $90,000, the primary bias remains bullish. The $90K– GETTEX:92K area now acts as a key support zone, ideal for pullback buying opportunities.
A breakout above $101,000 could trigger a strong acceleration toward the next major targets at $115K–$125K.
A weekly close below the green support zone would invalidate the bullish scenario and suggest caution.
What’s your outlook? Will Bitcoin maintain momentum and break $101K? Share your thoughts below!
Don’t forget to like and share your thoughts in the comments! ❤️

BTCUSD:Adopt range trading before the breakout.Given that a number of important data are about to be released intensively, the market volatility is rising sharply. Before a clear breakout signal in the price is formed, it is recommended that within the range of $93,000 - $96,000, the range trading strategy be flexibly applied: sell at highs, and then buy at lows to build positions when the price drops back to the support level, so as to seize the band trading opportunities in the volatile market. At the same time, strictly control the position size to prevent the risk of sudden and significant fluctuations triggered by the data release.
In the future, we will continue to monitor the market changes and update the trading strategies in real time.
I am committed to sharing trading signals every day. Among them, real-time signals will be flexibly pushed according to market dynamics. All the signals sent out last week accurately matched the market trends, helping numerous traders achieve substantial profits. Regardless of your previous investment performance, I believe that with the support of my professional strategies and timely signals, I will surely be able to assist you in breaking through investment bottlenecks and achieving new breakthroughs in the trading field.

Bitcoin Update: Sell or Wait?Hey traders and investors!
An interesting setup on Bitcoin.
On the 1H timeframe, the market is in a sideways range. The current initiative belongs to the sellers. A clear target is marked on the chart. We also have a seller Decision candle, and a seller zone has formed within its range — a strong signal for short setups.
However, on the daily timeframe, the buyers are still in control, and yesterday’s session closed with increased volume.
On the other hand, Friday also showed a volume spike — but without any meaningful result, and the same happened yesterday.
Sell or not? That’s the question...
The 94,900 level might give us the answer.
This analysis is based on the Initiative Analysis concept (IA).
Wishing you profitable trades!

BTC/USDT Technical Analysis. Current Price: ~$94,600
BTC has cleanly broken above the descending trendline resistance, a structure that capped price since mid-February.
This breakout was accompanied by a surge in volume and momentum — a strong bullish sign.
Golden Cross Area
A key technical confluence occurred where the 50-day MA (red) and the 200-day MA (green) were tested simultaneously, marked by the blue circle.
Price moved sharply upward after reclaiming both MAs, suggesting increased buying confidence — a textbook golden cross behavior, even if not a perfect cross yet.
Support & Resistance Flip
Previous resistance at the GETTEX:92K —$93K zone (highlighted in yellow) has now become support.
As long as BTC holds this zone, it suggests healthy consolidation and potential for a continued move up.
Trend Indicators:
50-Day MA (Red): Now curving upward — short-term bullish momentum is building.
200-Day MA (Green): Flattening and starting to rise, showing early signs of a shift in long-term trend direction.
The price is currently above both MAs, which is a key bullish condition.
Key Levels to Watch:
Immediate Resistance: $96,000–$97,500
Major Psychological Barrier: $100,000
Support Zone: $91,500–$92,500
Stronger Support (if broken): $84,000–$85,000 near the MAs
If the price continues to hold above the breakout zone and consolidates well, the next upside target will be $ 100 K.
Failing to hold the GETTEX:92K zone could invite a pullback toward the MAs around $85K — a zone where bulls may step in again.
Final Thoughts:
BTC is showing signs of renewed bullish momentum after breaking key resistance and reclaiming critical MAs. However, confirmation through consolidation and volume is essential to sustain higher levels.
Structure remains bullish unless we see a breakdown below ~$85K with volume.
DYOR. NFA. Stay sharp.

Millions Of Trades Liquidated —Bitcoin Flash Jump Beyond $100KMillions of people are about to get liquidated. The thing is that they set up their orders so that liquidation only happens above 100K and they think they will be able to close their position before Bitcoin reaches that level if it doesn't break down.
First, Bitcoin is not breaking down. Just notice that every time there is any type of bearish action it is quickly bought.
Second. No, no second that's all.
Bitcoin is set to grow and will do so in a flash. Rather than a flash crash, a flash advance.
Bitcoin always surprises so prepare because this is what will happen. Rather than going down as the majority actually expect, Bitcoin will break-up and do so strong, so strong that there will be no time to react. People will be caught in the shock and while they wait to look around and see what happens, Bitcoin will be moving up.
Instead of $100,000, it will go to $102,000 or $104,000 or higher just to make sure that all the over-leveraged are kicked out before additional growth.
This is just a friendly reminder.
Pray for the dead bears and people without a clue, they are about to lose everything, for them, it will be tough.
On our side though... Enjoy the profits as they come.
Namaste.

Bitcoin still defying gravity. Can it hold and continueBTC is flagging out at the previously defined point of interest. Although there are signs of bullish divergence market structure has yet to provide enough evidence that a retracement is in effect. However, the chart shows a volume gap below that presents an opportunity.
Full TA: Link in the BIO

BTCUSD:Wait for a breakthroughToday, the price of BTC strongly broke through the threshold of $93,000. Subsequently, it started a rebound trend. After consolidating near $95,500, it failed to further break through the resistance level of $96,000 and dropped back to around $94,000. It may fall again and break below the support level of $93,000.
The breakthrough of these two key price levels will serve as an important dividing line for the subsequent trend of BTC, indicating the direction of its future price movement.
Special Reminder: A number of important economic data will be intensively released this week, and market volatility is likely to increase significantly. It is recommended that everyone trade with caution and strictly control risks.
I am committed to sharing trading signals every day. Among them, real-time signals will be flexibly pushed according to market dynamics. All the signals sent out last week accurately matched the market trends, helping numerous traders achieve substantial profits. Regardless of your previous investment performance, I believe that with the support of my professional strategies and timely signals, I will surely be able to assist you in breaking through investment bottlenecks and achieving new breakthroughs in the trading field.
