BTCUSD SellBitcoin 1 hour chart, consolidation between 91900-94600 levels. Now we have sell signal and target is support zone. Risk reward 1/3
BTCUSDT

Bitcoin Blasts to $95,800: Next Stop $96,500?Bitcoin is on FIRE! Just hit $95,800 & climbing in a perfect rising channel!
Breakout after breakout — next stop $96,500?
Check the 1H chart but beware of potential pullbacks!

Bitcoin Forming Head & Shoulders – Watch for a Fake-OutPattern Formation: A complex Head and Shoulders structure is forming:
Left Shoulder ✅
Double Head ✅
Right Shoulder forming 🔄
Resistance Zone: The price is currently near a strong resistance area (around $87,000–$88,000).
This zone is likely to act as a ceiling and reject the price.
Expected Move (Blue Arrows):
shows a possible fake breakout above the resistance.
Then, a strong drop is expected, targeting:
First support near $78,000

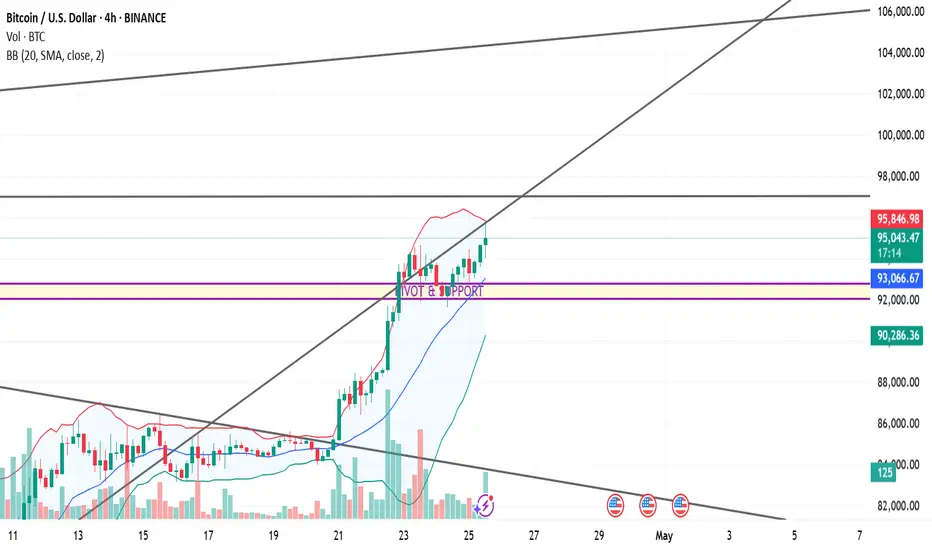
Bitcoin Technicals & FundamentalsBitcoin/US Dollar (BTC/USD)
Price Action Observations:
Trend: Strong bullish trend — price is above the middle Bollinger Band and riding the upper band.
Current Price: ~$95,410 (as of the chart time).
Immediate resistance near the upper Bollinger Band (~$95,921).
A major horizontal resistance is at around $98,000 (thick black line).
Local pivot/support zone marked around $92,400 – $93,100 (purple horizontal lines).
20-SMA (middle BB) acts as dynamic support (~$93,085).
Stronger support around $90,200 (lower BB).
Volume increasing on the bullish candles after the breakout around the 21st-22nd April.
Higher volume on green candles suggests genuine buying interest — not just a low-volume rally.
Bollinger Bands: Bands are expanding — classic signal for a volatile move.
Price is walking the upper band → continuation pattern as long as price doesn't break below the 20-SMA.
Trendlines: Ascending trendline beneath the current price → confirming higher lows.
There is a larger upper channel line sloping upwards targeting ~$105,000–$106,000.
Bias: Strong Bullish
Above 92,400–93,100 pivot zone = bullish structure maintained.
Immediate target: $98,000
Stretch target: $100,000 - $105,000 (upper channel resistance)
Invalidation: If price closes below ~$92,000 (break below pivot + mid-BB).
Fundamental Analysis (as of April 25, 2025):
If US Dollar (DXY) is weakening, it favors Bitcoin.
Fed policies — if there’s talk of rate cuts or holding rates steady, Bitcoin rallies.
Halving hype: Bitcoin halving happened earlier in 2024. Historically, it leads to a delayed but strong rally about 12-18 months later — we are now entering that "parabolic" zone.
ETF Inflows: BTC ETFs launched earlier have been drawing huge institutional interest.
Supply Shock: Fewer Bitcoins available on exchanges post-halving = price pressure upwards.
Global uncertainty (recession fears, wars, bank failures) = safe-haven demand for BTC.
Bitcoin being seen as "digital gold" strengthens its position.
My Final View:
Bitcoin remains in a strong bullish structure technically and fundamentally.
As long as it holds above ~$92,000–$93,000 zone, expect moves toward $98,000–$100,000+. A deeper retrace to $90,200 could still maintain the bull trend, but below that would signal weakness.
BTCUSDT - Wedge Break, Pullback - Long at 86,500BTCUSDT | From Bearish to Bullish – Wedge Break, Pullback - Long at 86,500 & 108 000 Target
If you recall my April 7th and 10th ideas:
and
Both setups have played out beautifully: BTC has rallied into our zones and now looks ready for a controlled retracement before the next leg higher.
1. Chart Structure & Context
Pattern: Five-month descending wedge (Nov ’24 – Apr ’25) marked by progressively lower highs & lows.
Breakout: Early May delivered a decisive close above the upper blue trendline—shifting control from bears to bulls.
Key Retest: The optimal pullback level is the demand block at ≈ 86 500 USDT, left behind by the swift breakout.
2. Key Levels to Watch
95 000 USDT – Resistance turned pullback trigger. Expect initial seller defense here.
86 500 USDT – Primary demand zone. High-probability long entry for mid-term positions.
108 000 USDT – Prior all-time daily swing high and next logical upside target.
3. Trade Plan
Patience: Wait for price to stall around 95 000 USDT and roll over.
Entry: Seek bullish price-action signals in the 86 500 USDT zone.
4. Targets & Path Forward
Short-term: A retest of 95 000–96 200 will fuel a deeper refill into 86 500, your high-odds long zone.
Mid-term: Defending 86 500 and reclaiming the former downtrend line will establish a higher-low on the daily—paving the way to 108 000 USDT.

Bitcoin can make small correction and then continue to growHello traders, I want share with you my opinion about Bitcoin. Earlier, the price of price was consolidating for quite some time inside a broad upward wedge. The market found consistent support near the buyer zone, forming a solid foundation for future growth. After several rebounds, the bulls pushed BTC higher, and the pair exited the support area with a clean breakout. The movement above the current 86000 support level was accompanied by a strong bullish impulse, confirming the breakout from the wedge and validating the upward momentum. The price respected the structure of the wedge well, reacting to both the resistance and support lines along the way. After the breakout, Bitcoin reached a new high near 94000, where it turned around slightly, indicating the beginning of a local correction. Now BTC is hovering just above the broken wedge, and I believe a short-term decline, likely before continuing further upward. Given the wedge's structure, the bounce from the buyer zone, and the breakout with confirmation, I remain bullish on Bitcoin. My TP1 remains at 97000 points, which corresponds to the next key resistance above the current price range. Please share this idea with your friends and click Boost 🚀

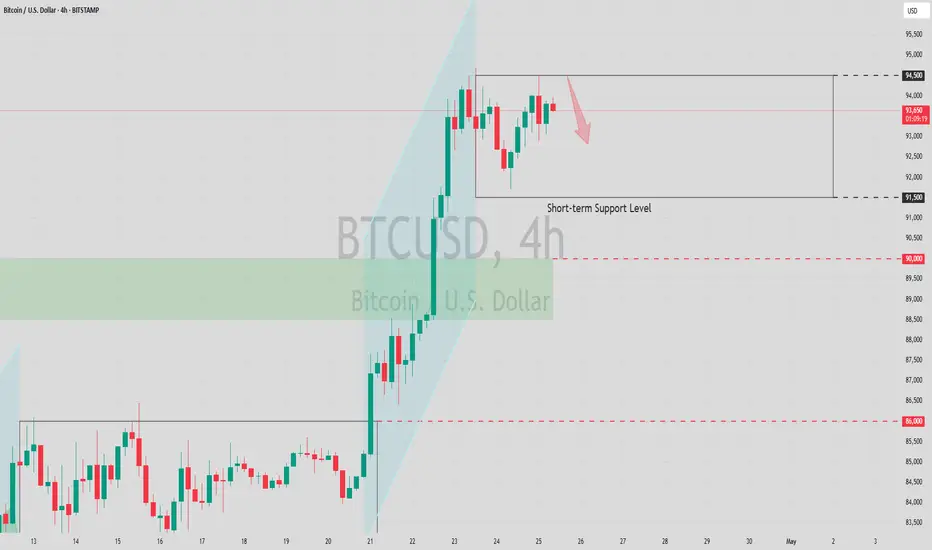
Short-term shorting opportunities emergeBTC encountered significant resistance near $94,500 during this week's rally, and short-selling operations can be attempted when approaching this price level.
BTCUSD
sell@94000-94500
tp:93000-92500
I hope this strategy will be helpful to you.
When you find yourself in a difficult situation and at a loss in trading, don't face it alone. Please get in touch with me. I'm always ready to fight side by side with you, avoid risks, and embark on a new journey towards stable profits.
$WIF Breakout Confirmed 🚨 SEED_WANDERIN_JIMZIP900:WIF Breakout Confirmed?
Dogwifhat has officially broken out of the descending channel and is trading above key resistance with strong momentum.
If bulls hold this zone, we could be eyeing major upside moves.
Key targets:-
• $0.774
• $1.474
• $3.006
• $4.659
SL: $0.305 | Entry: CMP
Is this the start of SEED_WANDERIN_JIMZIP900:WIF ’s next moon mission? 🌕
DRYO, NFA

AUDNZD BULLISH OR BEARISH DETAILED ANALYSISAUDNZD has finally broken out of a well-formed falling wedge pattern on the 12H timeframe, signaling a potential bullish reversal. After a sustained downtrend, price consolidated within the wedge, indicating decreasing bearish momentum. The recent breakout confirms buyer strength and opens the door for a fresh upside swing. The current price sits around 1.072, and based on technical structure and projected pattern targets, we could be heading towards the 1.105 zone.
From a fundamental standpoint, the Australian Dollar is gaining support due to rising commodity demand and hawkish tones from the RBA, hinting at a possibility of sustained higher interest rates. On the other hand, the New Zealand Dollar has been under pressure due to softer-than-expected CPI data and growing speculation that the RBNZ might be done with its tightening cycle. This divergence in central bank stance adds fuel to the AUDNZD bullish narrative. Today’s macro releases show stable Australian employment data and a dip in New Zealand’s retail figures, which further supports the bullish view.
This setup offers a solid risk-to-reward ratio, especially with a clean invalidation below 1.062. If the momentum sustains, price may accelerate quickly toward the 1.105 target. Market participants should also keep an eye on DXY (US Dollar Index) correlations and global risk sentiment, which could amplify volatility across AUD and NZD pairs.
As a professional trader, I’ll be monitoring price action closely near lower timeframes for confirmation entries and managing the trade with dynamic stop-loss adjustments. This breakout is technically clean, fundamentally supported, and strategically aligned with the current macro backdrop – making it a high-probability swing setup worth sharing.

$BTC - Road to $140K#Bitcoin will hit $140K but needs to firstly close above GETTEX:87K and above $109K with a mandatory retest of $106.5K DYOR.
Perfect retest of previous resistance as support backs my idea for the next bull run, although the aforementioned terms are obligatory.

BTCUSDT 1W AnalysisBTC ~ 1W Analysis
#BTC It is necessary to wait until this pattern is successfully broken to confirm a sustained bullish trend.

BTCUSD 4 - hour Chart AnalysisBTCUSD 4 - hour Chart Analysis
I. Trend Judgment
From the 4 - hour chart, BTCUSD is on an upward trend, consolidating at relatively high levels. Despite price fluctuations, bulls are still in control to some extent 🐂.
II. Key Levels
Support Area: The 90,000 - 91,500 range is a key support zone. The price has rebounded here multiple times, suggesting strong buying interest. If it drops back, it could be a buying opportunity 📈. 86,000 and 83,000 are additional lower - level supports.
Resistance Area: 95,000 is the resistance area. The price has faced hurdles here. If bullish momentum strengthens, breaking this could open up more upside 🚀.
III. Trading Strategies
Long - position Strategy: When the price retreats to the 90,000 - 91,500 support area and a bullish candlestick shows up, consider going long. Place stop - loss below the support and aim for 95,000. If broken, higher levels may follow 💰.
Short - position Strategy: Near 95,000, if a bearish candlestick appears with rising volume, try a small short position. Set stop - loss above resistance and target 91,500 - 90,000 ⬇️.
⚡⚡⚡ BTCUSD ⚡⚡⚡
🚀 Sell@95000 - 94000
🚀 TP 92000 - 91000
🚀 Buy@91000 - 92000
🚀 TP 94000 - 95000
Accurate signals are updated every day 📈 If you encounter any problems during trading, these signals can serve as your reliable guide 🧭 Feel free to refer to them! I sincerely hope they'll be of great help to you 🌟

BTC is trading within the equilibrium zone and..Bitcoin is now trading within my equilibrium zone. This will be one to watch for clues about the broader market, as it's currently leading the way.
Good luck, and always use a stop-loss!

BTC Approaches Breakout Zone in Ascending Triangle – Key Resist,📈 Chart Overview
Instrument: BTC/USD
Timeframe: Likely 4H or Daily
Indicators Used:
EMA 50 (Red) – 84,924.30
EMA 200 (Blue) – 85,558.47
🔍 Key Technical Observations
1. Ascending Triangle Formation
The chart shows a clear ascending triangle, a bullish continuation pattern.
Flat resistance zone: Around $88,700–$89,000.
Higher lows forming a solid upward sloping trendline, suggesting increasing buying pressure.
2. Price Above Key EMAs
Current price: $88,779.43, which is above both the 50 EMA and 200 EMA.
This indicates bullish momentum as price breaks above dynamic resistance levels.
3. Volume Consideration (Missing)
While volume is not visible on the chart, an ideal breakout from an ascending triangle should be accompanied by increasing volume to confirm validity.
🔄 Possible Scenarios
✅ Bullish Breakout
A confirmed breakout above $89,000 with strong volume can lead to a measured move toward:
Target = Triangle height ≈ $13,000 → Potential target: $101,500 – $102,000
Next resistance levels to watch: $92,000, $95,000, and $100,000 psychological zone.
❌ Fakeout or Rejection
If BTC gets rejected at resistance, watch for:
Retest of support trendline (~$86,000).
EMA 50 and 200 as dynamic support around $84,900–$85,500.
Breakdown below the trendline may signal a short-term correction to $80,000–$82,500.
📊 Conclusion
BTC is at a crucial decision point. The ascending triangle suggests bullish potential, but a breakout confirmation is essential. Price is above both major EMAs, signaling strength, but a rejection from resistance could invite short-term bears.

Importance of HA-Low, HA-High indicators
Hello, traders.
If you "Follow", you can always get new information quickly.
Please click "Boost" as well.
Have a nice day today.
-------------------------------------
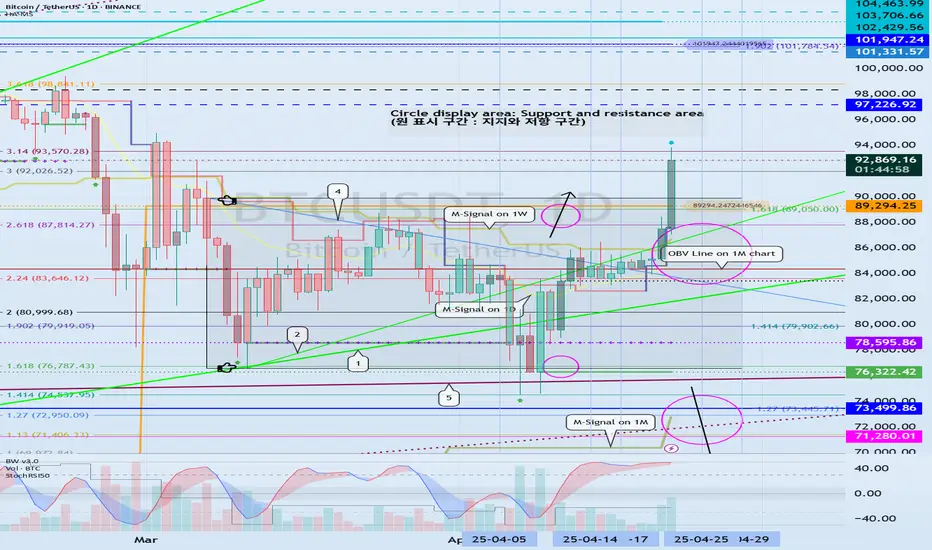
(BTCUSDT 1D chart)
I wonder if you think that BTC has turned into an uptrend as I mentioned before, as it has risen above 89294.25.
The previous idea is titled "Breakthrough trading starts with finding support and resistance points."
It is ideal to buy at the lowest price possible and sell at the highest price possible, but in order to do that, you need to constantly check the chart in real time.
Therefore, I think it is better to focus on finding the most ideal trading time.
Therefore, you should try to trade according to your own trading rules, that is, your trading strategy.
-
In that sense, my trading criteria are the HA-Low and HA-High indicators.
As you can see from the published formula, when the Heikin-Ashi chart shows an upward trend, the HA-Low indicator is created, and when it shows a downward trend, the HA-High indicator is created.
Therefore, if possible, you can think of a trading strategy to buy when it shows support near the HA-Low indicator, and sell when it shows resistance near the HA-High indicator.
If it falls below the HA-Low indicator, a stepwise downtrend may begin, and if it rises above the HA-HIgh indicator, a stepwise uptrend may begin.
Therefore, it is necessary to look at how long the HA-Low and HA-High indicators make a horizontal line.
Looking at the current chart, we can see that the HA-Low indicator was created at the 89294.25 point and the price fell, but the HA-Low indicator remained the same.
Therefore, even if it fell below the HA-Low indicator, it did not lead to a stepwise downtrend.
In order for a stepwise downtrend to lead, the HA-Low indicator must show a new shape as it falls.
-
The HA-High indicator on the 1D chart is formed at the 101947.24 point.
Therefore, the section that determines the trend again is expected to be around 101947.24.
However, since the HA-High indicator on the 1W chart is formed at the 97224.92 point, we must first check whether it can rise above this area.
-
OBV has broken through the upper line.
However, since there is a difference from the previous high, the point to watch is whether it can rise above the previous high.
Section A is the section where the lower point of the HA-High indicator box and the upper point of the HA-Low indicator box overlap.
Therefore, the key is whether it can receive support and rise in this section.
This is because it can be considered a volume profile section because it is a section where the influence of the HA-Low indicator and the HA-High indicator are simultaneously applied.
-
This volatility period is expected to be around April 25-29 (up to April 24-30).
If the StochRSI indicator falls from the overbought zone after this volatility period, then the support around 89294.25 is expected to be an important issue.
The movement of the StochRSI indicator and the price movement do not necessarily appear in the same direction.
Therefore, we recommend that you focus on finding a selling time when the StochRSI indicator is above the 50 point and on finding a buying time when it is below the 50 point.
-
The biggest disadvantage of the breakout trading mentioned earlier is that when it shows a downward trend, it is a split selling period.
In other words, when it rises from the point where the breakout trading was made and then shows a downward trend, it is the first selling period.
If you ignore this, you may suffer a loss or increase psychological anxiety, so you need to be careful.
Since the current HA-Low indicator is the standard for breakout trading, you will feel less psychological anxiety.
The reason is that the HA-Low indicator is created, which means that it has broken out of the low range.
When the price rises and breaks through the HA-High indicator, it feels different from when it breaks through the HA-Low indicator.
When the HA-High indicator breaks upward, it makes you think that it will rise more.
No matter how much you try to calm your mind and look at the chart with a third-party's eyes, it is not easy to stop thinking like that.
The HA-High indicator is created, which means that it has fallen from the high range.
Therefore, since rising above the HA-High indicator means that it has risen to the high range, it is not strange if it falls at any time.
However, as I mentioned earlier, the idea that it will rise more will be dominant, so there is a high possibility that FOMO will take effect.
In order to escape this psychological state, support and resistance points drawn on the 1M, 1W, and 1D charts are absolutely necessary.
It is necessary to make an effort to stabilize your psychological state by conducting a split transaction depending on whether there is support near the drawn support and resistance points.
-
Thank you for reading to the end.
I hope you have a successful transaction.
--------------------------------------------------
- This is an explanation of the big picture.
I used TradingView's INDEX chart to check the entire BTC section.
I rewrote it to update the previous chart while touching the Fibonacci ratio section of 1.902 (101875.70) ~ 2 (106275.10).
(Previous BTCUSD 12M chart)
Looking at the big picture, it seems to have maintained an upward trend following a pattern since 2015.
In other words, it is a pattern that maintains a 3-year upward trend and faces a 1-year downward trend.
Accordingly, the upward trend is expected to continue until 2025.
-
(Current BTCUSD 12M chart)
Based on the currently written Fibonacci ratio, it is displayed up to 3.618 (178910.15).
It is expected that it will not fall again below the Fibonacci ratio of 0.618 (44234.54).
(BTCUSDT 12M chart)
Based on the BTCUSDT chart, I think it is around 42283.58.
-
I will explain it again with the BTCUSD chart.
The Fibonacci ratio ranges marked in the green boxes, 1.902 (101875.70) ~ 2 (106275.10) and 3 (151166.97) ~ 3.14 (157451.83), are expected to be important support and resistance ranges.
In other words, it seems likely that they will act as volume profile ranges.
Therefore, in order to break through these ranges upward, I think the point to watch is whether they can receive support and rise near the Fibonacci ratios of 1.618 (89126.41) and 2.618 (134018.28).
Therefore, the maximum rising range in 2025 is expected to be the 3 (151166.97) ~ 3.14 (157451.83) range.
In order to do that, we need to see if it is supported and rises near 2.618 (134018.28).
If it falls after the bull market in 2025, we don't know how far it will fall, but based on the previous decline, we expect it to fall by about -60% to -70%.
Therefore, if it starts to fall near the Fibonacci ratio 3.14 (157451.83), it seems likely that it will fall to around Fibonacci 0.618 (44234.54).
I will explain more details when the bear market starts.
------------------------------------------------------
#BTC is stuck but Here's the simplified Plan!Bitcoin is currently trading between key levels:
Upper resistance: 93700
Lower support: 91670
We are stuck in this range, and a breakout above or below these levels will confirm the next move in the trend.
Right now, Bitcoin is holding the 50 EMA on the 30-minute chart. As long as this support holds, we could see a move towards 95k, after which we will reassess the chart.
Here are two possible scenarios if we hit 95,700 again:
We break above and target 100k
We face rejection and correct back to 88k. While this wouldn’t be a large correction, it could offer a very opportunistic entry point.
I’ll be sharing more insights and updates as the chart unfolds.
Follow me on all my socials (link in bio).
Drop your thoughts in the comment section and hit the like button if this is useful.
Thank you
#PEACE

BITCOIN NEXT MOVES!Bitcoin’s Next Move
In the long run, it's clear—Bitcoin is the new digital gold. Any dip at this stage is a potential opportunity. With over 7 years of experience in Bitcoin analysis, I believe in the bigger picture and long-term value.
If you'd like me to analyze or give insights on any other coin, feel free to ask. And don’t forget to follow for more crypto updates and analysis!

BTC/USDT Analysis: Following the Scenario
Hello everyone! This is CryptoRobotics' trader-analyst with your daily market breakdown.
Yesterday, Bitcoin came just short of testing the $95,000–$96,700 resistance zone (accumulated volumes) and began to pull back. Most likely, we will see more significant selling pressure once this zone is directly tested.
At the moment, we’ve tested the $92,000–$90,000 buy zone (strong buying imbalance) and are already seeing a reaction from it. The main expectation is the continuation of the long position and a test of the mentioned resistance zones. This is supported by the relatively weak nature of the pullback, absorption of market selling pressure on cumulative delta, and the presence of strong support.
Sell Zones:
$95,000–$96,700 (accumulated volumes)
$97,500–$98,400 (aggressive pushing volumes)
$107,000–$109,000 (volume anomalies)
Buy Zones:
$92,000–$90,000 (strong buying imbalance)
$88,100–$87,000 (market sell absorption)
$85,500–$84,000 (accumulated volumes)
$82,700–$81,400 (high volume area)
Level at $74,800
$69,000–$60,600 (accumulated volumes)
This publication does not constitute financial advice.

BTC Pumped Hard – Is It Time for a Pullback to Fill CME GAP!?Bitcoin ( BINANCE:BTCUSDT ) started pumping after the pullback, as I expected in my previous post , I hope you were able to take profits.
Bitcoin is trading in the upper areas of the Heavy Resistance zone ($95,000-$88,500) , near the Resistance lines and the upper line of the ascending channel .
Also, we can see the Regular Divergence(RD-) between Consecutive Peaks .
From the Elliott Wave theory perspective , it seems that Bitcoin has completed the main wave 3 and we can expect the completion of the main wave 4 today .
I expect Bitcoin to correct in the next few hours and drop to the targets I have specified on the chart and fill the CME Gap($93,465-$91,415) .
Cumulative Short Liquidation Leverage: $95,700-$94,542
Cumulative Long Liquidation Leverage: $92,666-$91,415
Cumulative Long Liquidation Leverage: $90,276-$89,160
Note: If Bitcoin can break the upper line of the ascending channel, we should wait for the next pump.
Please respect each other's ideas and express them politely if you agree or disagree.
Bitcoin Analyze (BTCUSDT), 1-hour time frame.
Be sure to follow the updated ideas.
Do not forget to put a Stop loss for your positions (For every position you want to open).
Please follow your strategy and updates; this is just my Idea, and I will gladly see your ideas in this post.
Please do not forget the ✅' like '✅ button 🙏😊 & Share it with your friends; thanks, and Trade safe.

CME Gap Between 91,050 and 91,659 – Market Might Revisit🧠 A CME gap has formed between 91,050 and 91,659 🕳️
Price could retrace to fill this zone after the recent bounce 🔁
This area is often revisited — watch out for a possible reaction ⚠️


Bitcoin Cycle Update – Are We Nearing the Peak?Check out this BTCUSDT chart – we’re at GETTEX:92K today, and seems like things are heating up!
▸We’ve seen a Cycle Bottom in late 2022 - early 2023, followed by strong Bull runs in 2023 and 2024.
▸Those Consolidation phases (sideways channels) gave us the perfect setup for massive pumps!
▸Right now, we’re in a Pause Triangle after a big rally – but the Cycle Top could be just around the corner in mid-2025.
▸After that? A potential Bear phase – time to plan your moves!
💡 What’s your strategy? Are you riding this wave to the top, or preparing for the next dip? Let’s discuss 📨

btcusdt mega dumpGreetings everyone. here I just closed the price in a triangle that goes from the $15k low and the price in it perfectly walks on its boundaries, we just tested it from bottom to top and now I think it will go down, also note that this is an inverted classical pattern. This is my pattern, just follow the ideas on tradingview.
