The decisive day of major data (BTCUSD)Yesterday, it was mentioned that the expectation of continuing to buy after a retracement of 96k was completely correct. Followers also made good profits.
BTCUSD bulls are still strong. The retracement is mainly long trading, which needs to be paid attention to at present. 96k/95k are both good buying opportunities.
TP98K-100K
Btcusdtanalysis

#BTC/USDT Update. Bitcoin is currently trading around a key resistance zone.
The immediate support lies near $95,554, while a confirmed breakout above $97,300 could trigger an uptrend toward $104,000.
Until then, trade with caution.
DYOR. NFA.

Can BTCUSD continue to be purchased? The answer is definitely.Can BTCUSD continue to be purchased? The answer is definitely.
The current trend is a rebound trend after a volatile decline. The space for a short-term increase of 1,500 points is very simple. The target position is 94,700-95,200. Friends who like to do short-term swing trading can follow.

Buy@9500096000: This represents the resistance level adjacent to the upper trend-line of the current ascending wedge. The price has repeatedly probed this zone but hasn't managed to achieve a decisive breakthrough, underscoring significant selling pressure at this crucial juncture 💥.
97500: It stands as a more elevated resistance milestone. Should the price powerfully breach the 96000 resistance barrier and sustain its upward momentum, it could potentially challenge this level 🎯.
⚡⚡⚡ BTCUSD ⚡⚡⚡
🚀 Buy@95000
🚀 TP 96000 - 97000
Accurate signals are updated every day 📈 If you encounter any problems during trading, these signals can serve as your reliable guide 🧭 Feel free to refer to them! I sincerely hope they'll be of great help to you 🌟

BTCUSD Short Setup Rejection from Major Resistance Targeting 89kThis BTC/USD chart shows a clear sell bias as the price repeatedly fails to break above a major resistance zone marked near the $95,500 level. Multiple rejections (highlighted with red arrows) indicate strong selling pressure. The suggested path shows a potential drop toward the 1st target around $91,530, and if momentum continues, further decline toward the 2nd target near $89,000, which aligns with a broader support zone.
Entry Zone:
Between $94,800 – $95,300 (inside the major resistance zone)
Stop-Loss (SL):
Just above the resistance zone, around
Take Profit Levels (TPs):
TP1: $93,200 – First minor support zone (lock partial profits, move SL to entry)
TP2: $91,500 – Key horizontal support (major reaction zone, good for larger partials)
TP3: $89,200 – Close to the lower support zone (final target for full exit)
This setup offers a solid Risk-Reward Ratio of approximately 1:2.5 to 1:3, depending on exact entry.

BTC/USD 1-hour timeframe chart, showing a bearish setup.
This is a BTC/USD 1-hour timeframe chart, showing a bearish setup. Here are the key elements:
Sell Zone (Resistance Area):
The zone around 95,379 to 95,622 is marked as a "SELL ZONE" (highlighted in green and yellow).
This area has acted as strong resistance multiple times in the past.
Current Price:
BTC is currently trading around 94,145.
Support Levels:
First support is marked at 93,079.
The next major support level (and likely target for the bearish move) is 91,572.
Price Projection:
The expectation is that price will move up slightly into the sell zone, then get rejected.
After rejection, the price is projected to break below support and fall toward 91,572 (as indicated by the red arrow).
Market Bias:
The setup shows a bearish bias, suggesting a short (sell) trade from the resistance zone.

BTCUSD:Adopt range trading before the breakout.Given that a number of important data are about to be released intensively, the market volatility is rising sharply. Before a clear breakout signal in the price is formed, it is recommended that within the range of $93,000 - $96,000, the range trading strategy be flexibly applied: sell at highs, and then buy at lows to build positions when the price drops back to the support level, so as to seize the band trading opportunities in the volatile market. At the same time, strictly control the position size to prevent the risk of sudden and significant fluctuations triggered by the data release.
BTCUSD
buy@93000-93500
tp:95000-95500
sell@96000-95500
tp:94000-93500
In the future, we will continue to monitor the market changes and update the trading strategies in real time.
I am committed to sharing trading signals every day. Among them, real-time signals will be flexibly pushed according to market dynamics. All the signals sent out last week accurately matched the market trends, helping numerous traders achieve substantial profits. Regardless of your previous investment performance, I believe that with the support of my professional strategies and timely signals, I will surely be able to assist you in breaking through investment bottlenecks and achieving new breakthroughs in the trading field.

BTCUSDT 1W UpdateYes, history is likely to repeat itself, making it possible for Bitcoin to reach a new all-time high in the range of $130K to $150K this year.
Are you ready?

BTCUSD:Adopt range trading before the breakout.Given that a number of important data are about to be released intensively, the market volatility is rising sharply. Before a clear breakout signal in the price is formed, it is recommended that within the range of $93,000 - $96,000, the range trading strategy be flexibly applied: sell at highs, and then buy at lows to build positions when the price drops back to the support level, so as to seize the band trading opportunities in the volatile market. At the same time, strictly control the position size to prevent the risk of sudden and significant fluctuations triggered by the data release.
In the future, we will continue to monitor the market changes and update the trading strategies in real time.
I am committed to sharing trading signals every day. Among them, real-time signals will be flexibly pushed according to market dynamics. All the signals sent out last week accurately matched the market trends, helping numerous traders achieve substantial profits. Regardless of your previous investment performance, I believe that with the support of my professional strategies and timely signals, I will surely be able to assist you in breaking through investment bottlenecks and achieving new breakthroughs in the trading field.

BTCUSD:Wait for a breakthroughToday, the price of BTC strongly broke through the threshold of $93,000. Subsequently, it started a rebound trend. After consolidating near $95,500, it failed to further break through the resistance level of $96,000 and dropped back to around $94,000. It may fall again and break below the support level of $93,000.
The breakthrough of these two key price levels will serve as an important dividing line for the subsequent trend of BTC, indicating the direction of its future price movement.
Special Reminder: A number of important economic data will be intensively released this week, and market volatility is likely to increase significantly. It is recommended that everyone trade with caution and strictly control risks.
I am committed to sharing trading signals every day. Among them, real-time signals will be flexibly pushed according to market dynamics. All the signals sent out last week accurately matched the market trends, helping numerous traders achieve substantial profits. Regardless of your previous investment performance, I believe that with the support of my professional strategies and timely signals, I will surely be able to assist you in breaking through investment bottlenecks and achieving new breakthroughs in the trading field.

BTCUSD:Ascending Wedge Trend and StrategiesI. Trends and Patterns
From the 4 - hour chart, BTCUSD has shown complex volatility characteristics recently:
1.Consolidation phase: The price oscillated within a narrow range in the early stage, forming a rectangular consolidation pattern. The forces of bulls and bears were relatively balanced, and there was a strong wait - and - see sentiment in the market.
2.Breakout and current pattern: After breaking through the consolidation range, the price moved upward, indicating that the bulls were dominant in the short term. However, it has now entered an ascending wedge pattern - which is a common reversal signal in technical analysis.
- Pattern characteristics: Although the price has been making short - term new highs, the upward slope has gradually flattened, suggesting that the bullish momentum is fading and the bearish momentum is gradually accumulating. Be vigilant against the risk of trend reversal.
II. Key Support and Resistance Levels
S1: $93,000. It is near the lower trend line of the ascending wedge and also a previous pullback low. If the price drops, this could form a strong support. If it is broken, it may open up a downward space, and we need to be vigilant against trend reversal.
S2: $91,500. It is the upper edge of the previous consolidation range. If the price drops significantly, this may form a secondary support to slow down the decline.
R1: $96,000. It is near the upper trend line of the ascending wedge. The price has tested it several times without a valid breakthrough, indicating strong selling pressure here and a significant short - term suppression effect.
R2: $98,000. It is a higher - level resistance target. If the price breaks through $96,000 strongly and holds above it, it may further rise to this level.
III. Trading Strategy Recommendations
1.Bullish strategy:
- Entry conditions: The price finds support near $93,000 (such as the appearance of bullish candlestick patterns like hammer candlesticks), and does not break below this level.
- Target price: $96,000 (testing the upper wedge), and if broken, look towards $97,500.
- Stop - loss setting: Break below $92,500 (below the lower edge of the support level).
2.Bearish strategy:
- Entry conditions: The price effectively breaks below the support level of $93,000 (such as closing below it for two consecutive candlesticks), or encounters resistance and falls back near $96,000 (the appearance of bearish patterns like shooting star candlesticks).
- Target price: $91,500 (the upper edge of the previous consolidation), and if it further drops, it can look towards $86,000.
- Stop - loss setting: Break above $96,500 (above the upper wedge).
3.Risk warnings:
- The reversal signal of the ascending wedge needs to be verified with trading volume (for example, if there is a significant increase in volume during the breakout, the signal is more reliable).
- Pay close attention to fundamental factors such as the expected Fed policy and regulatory dynamics of cryptocurrencies. Be vigilant against breakout movements triggered by unexpected news.
IV. Conclusion
Currently, BTCUSD is in a critical observation period of the ascending wedge. Technical analysis shows that the bullish momentum is waning, and it faces a directional choice in the short term. Aggressive traders can lightly test the waters near support/resistance levels, while conservative traders are advised to wait for clear breakout signals (such as a volume - based breakout of the upper wedge or an effective breakdown of the lower wedge) before entering the market. At the same time, strictly control positions and stop - losses to avoid volatility risks before the pattern is confirmed.

BTCUSD:Ascending Wedge Trend and StrategiesI. Trends and Patterns
From the 4 - hour chart, BTCUSD has shown complex volatility characteristics recently:
1.Consolidation phase: The price oscillated within a narrow range in the early stage, forming a rectangular consolidation pattern. The forces of bulls and bears were relatively balanced, and there was a strong wait - and - see sentiment in the market.
2.Breakout and current pattern: After breaking through the consolidation range, the price moved upward, indicating that the bulls were dominant in the short term. However, it has now entered an ascending wedge pattern - which is a common reversal signal in technical analysis.
- Pattern characteristics: Although the price has been making short - term new highs, the upward slope has gradually flattened, suggesting that the bullish momentum is fading and the bearish momentum is gradually accumulating. Be vigilant against the risk of trend reversal.
II. Key Support and Resistance Levels
S1 : $93,000. It is near the lower trend line of the ascending wedge and also a previous pullback low. If the price drops, this could form a strong support. If it is broken, it may open up a downward space, and we need to be vigilant against trend reversal.
S2 : $91,500. It is the upper edge of the previous consolidation range. If the price drops significantly, this may form a secondary support to slow down the decline.
R1 : $96,000. It is near the upper trend line of the ascending wedge. The price has tested it several times without a valid breakthrough, indicating strong selling pressure here and a significant short - term suppression effect.
R2 : $98,000. It is a higher - level resistance target. If the price breaks through $96,000 strongly and holds above it, it may further rise to this level.
III. Trading Strategy Recommendations
1.Bullish strategy:
- Entry conditions: The price finds support near $93,000 (such as the appearance of bullish candlestick patterns like hammer candlesticks), and does not break below this level.
- Target price: $96,000 (testing the upper wedge), and if broken, look towards $97,500.
- Stop - loss setting: Break below $92,500 (below the lower edge of the support level).
2.Bearish strategy:
- Entry conditions: The price effectively breaks below the support level of $93,000 (such as closing below it for two consecutive candlesticks), or encounters resistance and falls back near $96,000 (the appearance of bearish patterns like shooting star candlesticks).
- Target price: $91,500 (the upper edge of the previous consolidation), and if it further drops, it can look towards $86,000.
- Stop - loss setting: Break above $96,500 (above the upper wedge).
3.Risk warnings:
- The reversal signal of the ascending wedge needs to be verified with trading volume (for example, if there is a significant increase in volume during the breakout, the signal is more reliable).
- Pay close attention to fundamental factors such as the expected Fed policy and regulatory dynamics of cryptocurrencies. Be vigilant against breakout movements triggered by unexpected news.
IV. Conclusion
Currently, BTCUSD is in a critical observation period of the ascending wedge. Technical analysis shows that the bullish momentum is waning, and it faces a directional choice in the short term. Aggressive traders can lightly test the waters near support/resistance levels, while conservative traders are advised to wait for clear breakout signals (such as a volume - based breakout of the upper wedge or an effective breakdown of the lower wedge) before entering the market. At the same time, strictly control positions and stop - losses to avoid volatility risks before the pattern is confirmed.

#BTCUSDT: From $74,000 to $88,000 Moving Well! More Growth CominIt’s been on a steady climb from $74,000 to $88,000. We’re expecting even more growth in the coming weeks. The price has finally broken free from its consolidation phase and is now on the rise. We think it’ll reach $94,000, then $100,000, and maybe even go up to $120,000 by the end of the year.
What do you think? Let me know in the comments below!
Thanks!
Team Setupsfx_

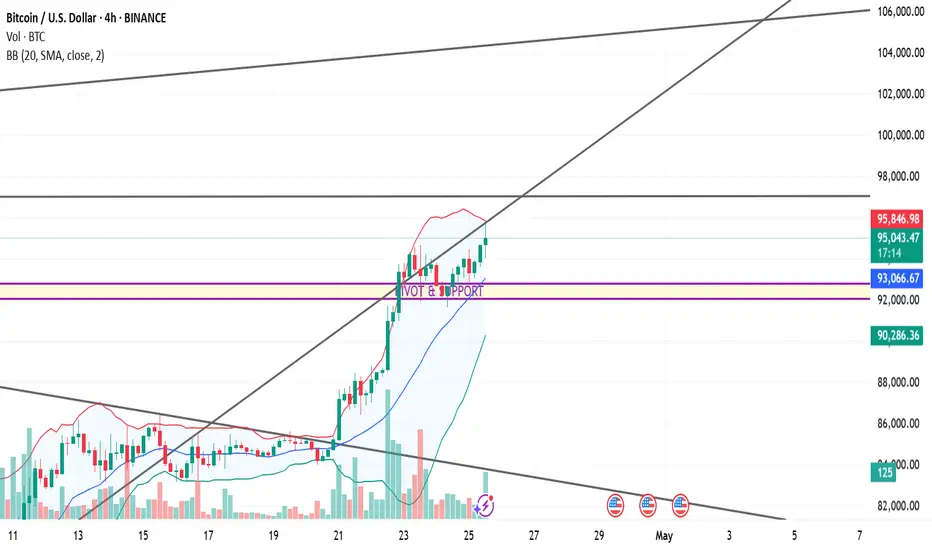
Bitcoin Technicals & FundamentalsBitcoin/US Dollar (BTC/USD)
Price Action Observations:
Trend: Strong bullish trend — price is above the middle Bollinger Band and riding the upper band.
Current Price: ~$95,410 (as of the chart time).
Immediate resistance near the upper Bollinger Band (~$95,921).
A major horizontal resistance is at around $98,000 (thick black line).
Local pivot/support zone marked around $92,400 – $93,100 (purple horizontal lines).
20-SMA (middle BB) acts as dynamic support (~$93,085).
Stronger support around $90,200 (lower BB).
Volume increasing on the bullish candles after the breakout around the 21st-22nd April.
Higher volume on green candles suggests genuine buying interest — not just a low-volume rally.
Bollinger Bands: Bands are expanding — classic signal for a volatile move.
Price is walking the upper band → continuation pattern as long as price doesn't break below the 20-SMA.
Trendlines: Ascending trendline beneath the current price → confirming higher lows.
There is a larger upper channel line sloping upwards targeting ~$105,000–$106,000.
Bias: Strong Bullish
Above 92,400–93,100 pivot zone = bullish structure maintained.
Immediate target: $98,000
Stretch target: $100,000 - $105,000 (upper channel resistance)
Invalidation: If price closes below ~$92,000 (break below pivot + mid-BB).
Fundamental Analysis (as of April 25, 2025):
If US Dollar (DXY) is weakening, it favors Bitcoin.
Fed policies — if there’s talk of rate cuts or holding rates steady, Bitcoin rallies.
Halving hype: Bitcoin halving happened earlier in 2024. Historically, it leads to a delayed but strong rally about 12-18 months later — we are now entering that "parabolic" zone.
ETF Inflows: BTC ETFs launched earlier have been drawing huge institutional interest.
Supply Shock: Fewer Bitcoins available on exchanges post-halving = price pressure upwards.
Global uncertainty (recession fears, wars, bank failures) = safe-haven demand for BTC.
Bitcoin being seen as "digital gold" strengthens its position.
My Final View:
Bitcoin remains in a strong bullish structure technically and fundamentally.
As long as it holds above ~$92,000–$93,000 zone, expect moves toward $98,000–$100,000+. A deeper retrace to $90,200 could still maintain the bull trend, but below that would signal weakness.
BTCUSDT 1W AnalysisBTC ~ 1W Analysis
#BTC It is necessary to wait until this pattern is successfully broken to confirm a sustained bullish trend.

Market Analysis: #BTCUSDT💰 On the BYBIT:BTCUSDT.P chart, a clear symmetrical triangle pattern has formed and already broken down, leading to a confirmed bearish impulse. Price has now returned below the POC level at $93,370.4 (Point of Control by volume), indicating weakness from buyers.
📊 Key Levels
🔴 POC BYBIT:BTCUSDT.P $93,370.4
— This is the highest volume area, now acting as strong resistance. As long as price remains below, short bias is favored.
🔵 Support BYBIT:BTCUSDT.P $91,905.5
— A short-term target if the bearish momentum continues.
🎯 Lower Target Zone
— Indicates the full depth of the breakdown move, aiming at the $90,800–$91,000 range.
📈 Volume
➡️ Volume increased during the breakdown, then dropped as price revisited the $93,000 zone — this signals a weak retest and seller control.
📍 Important Notes
➡️ Currently, BYBIT:BTCUSDT.P is trading between two key zones — the POC above and the $91,900 support below.
➡️ Failure to break and hold above $93,370 keeps the bearish scenario in play.
➡️ A move below $92,600 will confirm continuation of the downtrend.
📢 Strategy Recommendations:
🚨 SHORT Scenario BYBIT:BTCUSDT.P
Entry: on a retest of $93,000–$93,200 and rejection
Stop Loss: above POC ($93,450)
Targets: $92,100 → $91,900 → $90,800
🚨 Alternative LONG Scenario BYBIT:BTCUSDT.P (only if POC is broken):
Entry: after a solid breakout and hold above $93,400 with volume
Target: $94,200–$94,800
Stop Loss: below $93,000
🚨 Conclusion :
BYBIT:BTCUSDT.P has completed the triangle pattern and is now in a retest phase. So far, signs still point to bearish continuation, with final confirmation coming from a break below $92,600.

BTCUSDT TRIANGLE PATTERN IN 30-MI Created This BTCUSDT Chart Analysis In 30-M Tf
ENTRY LEVEL. 84600
Resistance zone : 84800
Target Well Be : 82800
BTCUSDT made Triangle Pattern, It's Take Resistance BTC went to Downtrend Soon

Safe-haven funds continue to drive BTC higher.Yesterday, Bitcoin approached $94,000 with bulls maintaining strength, and $95,000 may become the next target. As a high-quality safe-haven asset, Bitcoin is currently still supported by uncertainties surrounding U.S. trade policies and the Federal Reserve's interest rate path. In trading operations, the strategy of going long on pullbacks should still be adhered to, with attention paid to the support level at $90,000 below.
BTCUSD
buy@93K-94K
tp:95K-96k
I hope this strategy will be helpful to you.
When you find yourself in a difficult situation and at a loss in trading, don't face it alone. Please get in touch with me. I'm always ready to fight side by side with you, avoid risks, and embark on a new journey towards stable profits.

Bitcoin 15-Minute Chart – Projected Target PriceCurrently, the trend appears to be upward.
If the bullish trend continues, the price is expected to rise toward approximately 90,452.
On the other hand, if it declines, a drop toward around 83,808 is expected.
However, considering the current time of day, the market seems to be losing some momentum, so it's more reasonable to expect a short-term uptrend or sideways movement for now.

Risk-averse funds drive BTC higher.The sharp collapse of the DXY has triggered violent fluctuations in the global monetary system. As risk aversion heats up, investors are adjusting their asset allocations, with substantial capital flowing into "digital gold," which has enabled BTC to break last week's sideways consolidation and initiate an upward trend.
BTCUSD
buy@86500-87500
tp:88500-89500
I hope this strategy will be helpful to you.
When you find yourself in a difficult situation and at a loss in trading, don't face it alone. Please get in touch with me. I'm always ready to fight side by side with you, avoid risks, and embark on a new journey towards stable profits.

BTCUSDT at daily resistance, likely to head to 84kThe price has hit the daily resistance as expected in the quoted post. I see a pullback here which is already started. A short trade setup is favorable gere, We take a short in this zone and target towards daily support DS1. The correction can go upto weekly suppor WS1 but lets focus on this short trade first. risking 1.5% for 4.5% win.

BTCUSDT 1D Analysis UpdateBTC ~ 1D Analysis Update
#BTC Alright let's continue this bullish, a minimum of $ 130,000 - $ 150,000 in 2025.

BTC/USD "Bitcoin vs U.S.Dollar" Crypto Market Heist (Swing/Day)🌟Hi! Hola! Ola! Bonjour! Hallo! Marhaba!🌟
Dear Money Makers & Robbers, 🤑💰✈️
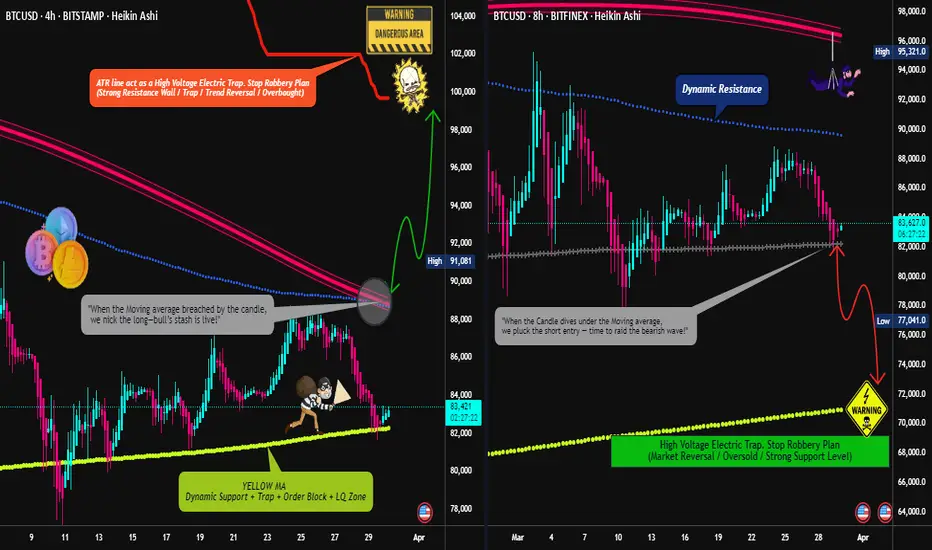
Based on 🔥Thief Trading style technical and fundamental analysis🔥, here is our master plan to heist the BTC/USD "Bitcoin vs U.S.Dollar" Crypto Market. Please adhere to the strategy I've outlined in the chart, which emphasizes long entry and short entry. 🏆💸Be wealthy and safe trade.💪🏆🎉
Entry 📈 :
"The loot's within reach! Wait for the breakout, then grab your share - whether you're a Bullish thief or a Bearish bandit!"
🏁Buy entry above 89000
🏁Sell Entry below 81000
📌However, I recommended to place buy stop for bullish side and sell stop for bearish side.
Stop Loss 🛑:
🚩Thief SL placed at 84000 for Bullish Trade
🚩Thief SL placed at 88000 for Bearish Trade
Using the 4H period, the recent / swing low or high level.
SL is based on your risk of the trade, lot size and how many multiple orders you have to take.
Target 🎯:
🏴☠️Bullish Robbers TP 99000 (or) Escape Before the Target
🏴☠️Bearish Robbers TP 72000 (or) Escape Before the Target
BTC/USD "Bitcoin vs U.S.Dollar" Crypto Market Heist Plan is currently experiencing a neutral trend,., driven by several key factors.
📰🗞️Get & Read the Fundamental, Macro, COT Report, On Chain Analysis, Sentimental Outlook, Intermarket Analysis, Future trend targets.. go ahead to check 👉👉👉🔗
⚠️Trading Alert : News Releases and Position Management 📰 🗞️ 🚫🚏
As a reminder, news releases can have a significant impact on market prices and volatility. To minimize potential losses and protect your running positions,
we recommend the following:
Avoid taking new trades during news releases
Use trailing stop-loss orders to protect your running positions and lock in profits
💖Supporting our robbery plan 💥Hit the Boost Button💥 will enable us to effortlessly make and steal money 💰💵. Boost the strength of our robbery team. Every day in this market make money with ease by using the Thief Trading Style.🏆💪🤝❤️🎉🚀
I'll see you soon with another heist plan, so stay tuned 🤑🐱👤🤗🤩