BTCUSDT: Key Levels and Trading StrategiesMACD histogram turned positive, indicating emerging short-term bullish momentum despite a $2843 daily drop. RSI (14) at 43.54 shows a neutral-to-weak state, with bears slightly ahead but not in oversold territory, suggesting limited room for further declines. Bitcoin's volatility and recent drop have made investors cautious or even panicked. Some are exiting the market, while others are looking for opportunities to buy the dip or go short. Unstable sentiment is reducing trading activity.
In summary, although BTCUSDT is currently down, bullish signals are strengthening. Key support levels remain crucial. A rebound could occur if prices hold these levels, but a break below may lead to further declines.
BTCUSDT
sell@85000-86000
tp:84000-83500-83000
buy@82000-83000
tp:84000-84500-8500
I will share trading signals every day. All the signals have been accurate for a whole month in a row. If you also need them, please click on the link below the article to obtain them.
Btcusdtidea

BTC: Daily AnalysisThe chart shows a bullish reversal pattern, likely an inverse head and shoulders or a bullish triangle breakout.
The price has broken out of the triangle formation, indicating a potential continuation of the uptrend.
The setup suggests a bullish outlook with a well-defined entry, stop loss, and take-profit levels.
If the price holds above the entry level and breaks resistance, the next targets could be achieved.
If BTC drops below the stop loss, the trade would be invalidated, signaling a potential downtrend or retest of lower support.
Trading Plan:
BUY@83,710 USDT
SL: Placed around 83,256 USDT to manage risk.
Targets:
1st Target: ~84,500 USDT
2nd Target: ~85,500 USDT
I always firmly believe that profit is the sole criterion for measuring strength. I will share accurate trading signals every day. Follow my lead and wealth will surely come rolling in. Click on my profile for your guide.

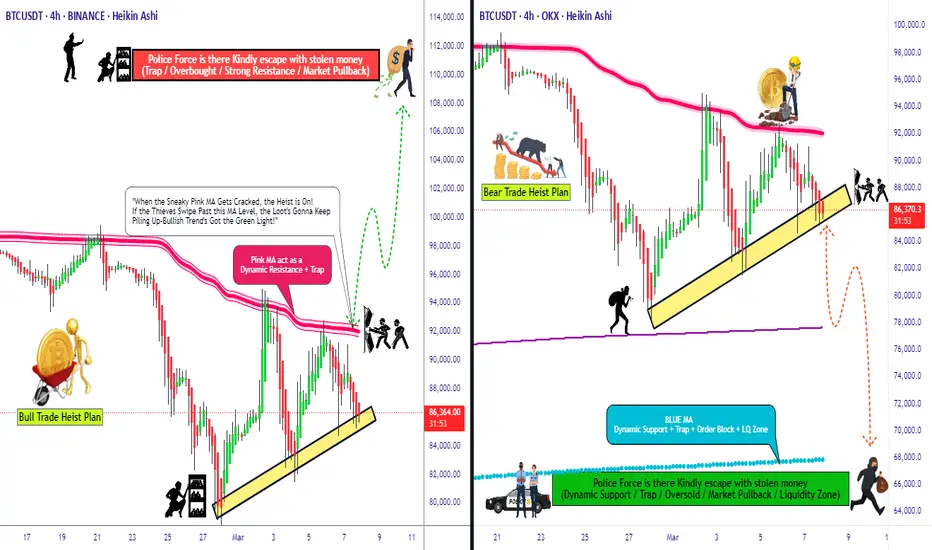
BTC/USDT "Bitcoin vs Tether" Crypto Market Heist Plan🌟Hi! Hola! Ola! Bonjour! Hallo! Marhaba!🌟
Dear Money Makers & Robbers, 🤑💰✈️
Based on 🔥Thief Trading style technical and fundamental analysis🔥, here is our master plan to heist the BTC/USDT "Bitcoin vs Tether" Crypto market. Please adhere to the strategy I've outlined in the chart, which emphasizes long entry and short entry. 🏆💸Be wealthy and safe trade.💪🏆🎉
Entry 📈 :
"The loot's within reach! Wait for the breakout, then grab your share - whether you're a Bullish thief or a Bearish bandit!"
🏁Buy entry above 93000
🏁Sell Entry below 84000
📌However, I recommended to place buy stop for bullish side and sell stop for bearish side.
Stop Loss 🛑:
🚩Thief SL placed at 88000 (swing Trade Basis) for Bullish Trade
🚩Thief SL placed at 92000 (swing Trade Basis) for Bearish Trade
Using the 4H period, the recent / swing low or high level.
SL is based on your risk of the trade, lot size and how many multiple orders you have to take.
Target 🎯:
🏴☠️Bullish Robbers TP 11000 (or) Escape Before the Target
🏴☠️Bearish Robbers TP 68000 (or) Escape Before the Target
📰🗞️Fundamental, Macro, COT Report, On Chain Analysis, Sentimental Outlook, Intermarket Analysis, Future Prediction:
BTC/USDT "Bitcoin vs Tether" Crypto market is currently experiencing a Neutral Trend (slightly Bearish🐼),., driven by several key factors.
1. Fundamental Analysis⭐⚡🌟
Fundamental analysis evaluates Bitcoin’s intrinsic drivers:
Adoption Trends:
Institutional inflows via Bitcoin ETFs remain strong, with $1.5 billion added in Q1 2025. MicroStrategy holds 300,000 BTC, reinforcing corporate adoption—bullish.
Regulatory Environment:
The U.S. signals a pro-crypto stance with talks of a strategic Bitcoin reserve, boosting confidence—bullish. However, global regulatory uncertainty (e.g., EU tax proposals) adds mild bearish pressure.
Halving Impact:
Post-2024 halving (April), supply issuance dropped to 450 BTC/day. Historical patterns suggest price appreciation 12-18 months later, supporting a bullish outlook for 2025.
Network Usage:
Transaction volume is up 10% year-over-year, driven by Layer 2 solutions (e.g., Lightning Network)—bullish for utility and value.
Inflation Hedge Narrative:
With U.S. inflation at 3.0%, Bitcoin’s appeal as a store of value grows—bullish, though tempered by short-term risk-off sentiment.
Detailed Explanation: Fundamentals are strongly bullish long-term due to adoption, supply scarcity, and macro trends. Short-term bearish pressures from regulatory uncertainty and profit-taking explain the current dip to 87,000.
2. Macroeconomic Factors⭐⚡🌟
Macroeconomic conditions influencing BTC/USD:
U.S. Economy:
Fed rates at 3.0% with no immediate cuts signal tighter conditions—bearish short-term as capital favors yield-bearing assets.
Unemployment steady at 4.2% supports economic stability—neutral.
Global Growth:
China’s GDP growth slows to 4.2%, reducing demand for risk assets like Bitcoin—bearish.
Eurozone PMI at 47.8 indicates contraction, pressuring global markets—bearish.
Currency Markets:
USD strength (DXY at 106) weighs on BTC/USD, as a stronger dollar reduces Bitcoin’s appeal—bearish short-term.
Commodity Prices:
Oil at 668/BBL
and gold at $2,950 reflect a mixed risk environment—neutral for Bitcoin.
Geopolitical Risk:
Middle East tensions elevate safe-haven demand, but Bitcoin’s correlation with gold is weakening—neutral to mildly bearish.
Detailed Explanation: Macro factors tilt bearish short-term due to USD strength and global slowdown, countering Bitcoin’s long-term bullish fundamentals. This tension explains the current downward trend from higher levels.
3. Commitments of Traders (COT) Data⭐⚡🌟
COT data reflects futures positioning:
Speculative Traders:
Net long positions at 15,000 contracts, down from 25,000 at the 95,000 peak. Reduced bullishness suggests caution—bearish signal.
Commercial Hedgers:
Net short at 20,000 contracts, stable. Hedgers locking in gains indicate no panic—neutral.
Open Interest:
45,000 contracts, down 10% from February highs. Declining participation hints at fading momentum—bearish.
Detailed Explanation: COT data supports a bearish short-term view. Speculators unwinding longs and falling open interest align with the downward trend, though hedgers’ stability prevents a sharper collapse.
4. On-Chain Analysis⭐⚡🌟
On-chain metrics provide insights into Bitcoin’s network activity:
Exchange Balances:
2.6 million BTC on exchanges, up 5% in March. Rising supply suggests selling pressure—bearish.
Transaction Volume:
Daily volume at $10 billion, flat month-over-month. Lack of growth signals reduced buying interest—neutral to bearish.
HODLing Behavior:
70% of BTC unmoved for over a year (13.8 million coins). Strong holder conviction limits downside—bullish long-term.
Miner Activity:
Miners hold 1.8 million BTC, with minimal outflows. Stable miner behavior supports price floors—mildly bullish.
Realized Price Levels:
Realized cap indicates a cost basis of 78,000 for recent buyers, acting as support—bullish if held.
Detailed Explanation: On-chain data is mixed. Short-term bearish signals from exchange inflows contrast with long-term bullishness from HODLing and miner stability, suggesting a correction rather than a collapse.
5. Intermarket Analysis⭐⚡🌟
Correlations with other markets:
USD Strength:
DXY at 106 pressures BTC/USD inversely—bearish short-term.
S&P 500:
At 5,900, down 2% this week, reflecting risk-off sentiment. Bitcoin’s 0.6 correlation with equities adds downward pressure—bearish.
Gold:
At $2,950, gold rises as a safe haven, decoupling from Bitcoin—neutral to bearish.
Bond Yields:
U.S. 10-year yields at 3.8% attract capital away from risk assets—bearish.
Altcoins:
ETH/BTC ratio at 0.035, with altcoins underperforming Bitcoin, reinforcing BTC’s relative strength—mildly bullish.
Detailed Explanation: Intermarket signals are bearish short-term due to USD strength, equity declines, and yield competition. Bitcoin’s resilience versus altcoins offers some support, but broader risk-off trends dominate.
6. Market Sentiment Analysis⭐⚡🌟
Investor and trader mood:
Retail Sentiment:
Social media analysis shows 45% bullish sentiment, down from 60% at 95,000. Fear of further drops prevails—bearish.
Analyst Views:
Consensus targets range from 80,000 (short-term support) to 100,000 (Q3 2025), reflecting uncertainty—mixed.
Options Market:
Call/put ratio at 0.9, with balanced positioning. No strong directional bias—neutral.
Fear & Greed Index:
At 40 (neutral), down from 70 (greed) in February, indicating cooling enthusiasm—bearish shift.
Detailed Explanation: Sentiment has turned bearish short-term as retail investors react to the decline from 95,000. Analysts’ mixed views and neutral options activity suggest a wait-and-see approach, aligning with the current trend.
7. Next Trend Move and Future Trend Prediction⭐⚡🌟
Price projections across timeframes:
Short-Term (1-2 Weeks):
Range: 84,000 - 88,500
Likely to test support at 86,000-84,000 if selling persists; a bounce to 88,500 possible on relief rally.
Catalysts: U.S. economic data (e.g., CPI on March 12), ETF flows.
Medium-Term (1-3 Months):
Range: 80,000 - 92,000
Below 84,000 targets 80,000 (realized price support); above 88,500 aims for 92,000 if risk appetite returns.
Catalysts: BOJ policy update, institutional buying.
Long-Term (6-12 Months):
Bullish Target: 100,000 - 110,000
Driven by halving cycle, adoption, and inflation hedging—65% probability.
Bearish Target: 70,000 - 75,000
Triggered by global recession or regulatory crackdown—35% probability.
Catalysts: U.S. strategic reserve decision, Q3 GDP data.
Detailed Explanation: Short-term downside to 84,000 aligns with current bearish momentum. Medium-term consolidation reflects macro uncertainty, while long-term upside to 100,000+ hinges on fundamentals prevailing over temporary setbacks.
8. Overall Summary Outlook⭐⚡🌟
BTC/USD at 87,000 is in a short-term bearish correction within a broader bullish cycle. Fundamentals (adoption, halving) and on-chain HODLing support long-term gains, but macro headwinds (USD strength, global slowdown), COT unwinding, and risk-off sentiment drive the current downward trend. Exchange inflows and declining sentiment reinforce near-term weakness, with support at 84,000-80,000 likely to hold. Medium-term recovery to 92,000 and long-term growth to 100,000+ remain plausible if catalysts align.
📌Keep in mind that these factors can change rapidly, and it's essential to stay up-to-date with market developments and adjust your analysis accordingly.
⚠️Trading Alert : News Releases and Position Management 📰 🗞️ 🚫🚏
As a reminder, news releases can have a significant impact on market prices and volatility. To minimize potential losses and protect your running positions,
we recommend the following:
Avoid taking new trades during news releases
Use trailing stop-loss orders to protect your running positions and lock in profits
💖Supporting our robbery plan 💥Hit the Boost Button💥 will enable us to effortlessly make and steal money 💰💵. Boost the strength of our robbery team. Every day in this market make money with ease by using the Thief Trading Style.🏆💪🤝❤️🎉🚀
I'll see you soon with another heist plan, so stay tuned 🤑🐱👤🤗🤩
BTCUSDT SHORT (FIXED 1-ST target NOW) I fix the 1st take at $80,913 and move the stop order to breakeven .
1- the position itself is correct, but such manipulations with the news background and constant volume shift do not allow to correctly assess the moment of price reversal
2- Key markings before opening the position also took the format of price manipulation and should not have reached the value of $84,000 again in a normal market
In this regard, I decide to secure the position and take part of the profit in order to calmly continue trading while respecting the risks .
Main overview:
Further targets remain unchanged

BTC/USDT "Bitcoin vs Tether" Crypto Market Heist Plan🌟Hi! Hola! Ola! Bonjour! Hallo! Marhaba!🌟
Dear Money Makers & Robbers, 🤑💰✈️
Based on 🔥Thief Trading style technical and fundamental analysis🔥, here is our master plan to heist the BTC/USDT "Bitcoin vs Tether" Crypto market. Please adhere to the strategy I've outlined in the chart, which emphasizes long entry and short entry. 🏆💸Be wealthy and safe trade.💪🏆🎉
Entry 📈 :
"The loot's within reach! Wait for the breakout, then grab your share - whether you're a Bullish thief or a Bearish bandit!"
🏁Buy entry above 89000
🏁Sell Entry below 78000
📌However, I recommended to place buy stop for bullish side and sell stop for bearish side.
Stop Loss 🛑:
🚩Thief SL placed at 84000 (swing Trade Basis) for Bullish Trade
🚩Thief SL placed at 92000 (swing Trade Basis) for Bearish Trade
Using the 4H period, the recent / swing low or high level.
SL is based on your risk of the trade, lot size and how many multiple orders you have to take.
Target 🎯:
🏴☠️Bullish Robbers TP 110000 (or) Escape Before the Target
🏴☠️Bearish Robbers TP 62000 (or) Escape Before the Target
📰🗞️Fundamental, Macro, COT Report, On Chain Analysis, Sentimental Outlook, Intermarket Analysis, Future Prediction:
BTC/USDT "Bitcoin vs Tether" Crypto market is currently experiencing a 🐼Bearish Trend in short term (Trend will expect to move on 🐂Bullish in future),., driven by several key factors.
⭐⚡🌟Fundamental Analysis⭐⚡🌟
Fundamental analysis for BTC involves assessing its intrinsic value based on adoption, utility, network security, and regulatory developments.
Adoption & Utility: By March 2025, Bitcoin adoption has likely continued to grow, with more institutions (e.g., ETFs, corporate treasuries) and countries (e.g., El Salvador-style experiments) integrating BTC. The Lightning Network and other scaling solutions may have matured, enhancing transaction speed and reducing costs, boosting its use case as a payment system.
Network Security: Bitcoin’s hash rate is likely at an all-time high, reflecting robust miner participation despite rising energy costs. Halving cycles (last one in 2024) reduce issuance, reinforcing scarcity at $84,000.
Regulatory Environment: Global regulation remains mixed—some nations embrace BTC (e.g., pro-crypto U.S. policies under a potentially favorable administration), while others (e.g., China) maintain bans. Regulatory clarity in major markets could be a tailwind.
Development Activity: Ongoing upgrades (e.g., Taproot enhancements) signal a healthy ecosystem.
Conclusion: Fundamentals are strong, with scarcity and adoption supporting a bullish outlook, though regulatory risks linger.
⭐⚡🌟Macro Economics⭐⚡🌟
Macro factors influence BTC as both a risk asset and a "digital gold" hedge.
Inflation & Monetary Policy: By 2025, inflation may have moderated from 2022 peaks, but persistent debt levels (e.g., U.S. debt-to-GDP >130%) and money printing could bolster BTC’s appeal as an inflation hedge. If central banks (e.g., Fed) maintain loose policies or cut rates, BTC benefits.
Interest Rates: Higher rates in 2025 (e.g., 3-4%) could pressure risk assets, but BTC’s decoupling from equities (observed in prior cycles) suggests resilience.
Geopolitical Tensions: Ongoing conflicts (e.g., Russia-Ukraine, U.S.-China trade wars) and sanctions drive capital flight to decentralized assets like BTC.
Dollar Strength: A weakening USD (DXY potentially below 100) supports BTC’s rise as an alternative store of value.
Conclusion: Macro conditions lean bullish, with BTC thriving amid uncertainty and dollar erosion.
⭐⚡🌟COT Data (Commitment of Traders)⭐⚡🌟
COT reports from futures markets (e.g., CME Bitcoin futures) provide insight into institutional positioning.
Commercial Hedgers: Likely net short at $84,000, locking in profits after a rally from 2024 lows.
Large Speculators: Net long, reflecting bullish bets by hedge funds and institutions anticipating further upside post-halving.
Small Traders: Overly long and crowded, a contrarian signal of potential short-term exhaustion.
Open Interest: Rising OI at $84,000 suggests strong conviction, but a spike could signal an overleveraged market ripe for a pullback.
Conclusion: Mixed signals—bullish institutional bias with short-term caution due to retail crowding.
⭐⚡🌟On-Chain Analysis⭐⚡🌟
On-chain data reflects real-time network activity.
HODLing Behavior: High percentage of BTC unmoved for 1+ years (e.g., 65%+ of supply) indicates strong holder conviction at $84,000.
Exchange Reserves: Declining BTC on exchanges (e.g., 1.8M BTC vs. 2.5M in 2021) signals reduced selling pressure.
Transaction Volume: Stable or rising volume supports price legitimacy, though a drop could hint at waning momentum.
Realized Cap: Likely near all-time highs, reflecting long-term holders’ profits and new capital inflows.
MVRV Ratio: If above 3 (market value significantly exceeds realized value), BTC may be overbought short-term.
Conclusion: On-chain metrics are bullish, with accumulation outweighing distribution, though overbought risks emerge.
⭐⚡🌟Intermarket Analysis⭐⚡🌟
BTC’s correlation with other markets shapes its trajectory.
Equities (S&P 500): Correlation may have weakened by 2025, but a tech-led rally (e.g., AI stocks) could spill over to BTC.
Gold: Inverse correlation strengthens as BTC gains "digital gold" status—gold at $2,500/oz could coincide with BTC at $84,000.
USD: A declining DXY (e.g., 95) supports BTC’s rise.
Bonds: Rising yields (e.g., 10-year Treasury at 4%) pressure risk assets, but BTC’s safe-haven narrative mitigates this.
Altcoins: If ETH/BTC or other pairs are strong, altcoin outperformance could cap BTC dominance (e.g., 45% vs. 60% historically).
Conclusion: Intermarket trends favor BTC, with selective decoupling from risk assets.
⭐⚡🌟Market Sentiment Analysis (All Investor Types)⭐⚡🌟
Sentiment varies by cohort.
Retail Investors: Euphoric at $84,000 (e.g., X posts screaming "to the moon"), a contrarian sell signal.
Institutional Investors: Optimistic but cautious—ETF inflows (e.g., BlackRock’s BTC ETF) remain steady but not parabolic.
Whales: Accumulating dips (per on-chain data), signaling long-term confidence.
Miners: Selling pressure eases post-halving as higher prices offset lower rewards.
Social Media Trend: Search reveals polarized views—bullish memes dominate, but bearish "bubble" warnings grow louder.
Conclusion: Sentiment is overheated short-term (retail FOMO) but structurally bullish (institutional/whale support).
⭐⚡🌟Next Trend Move Prediction (Short, Medium, Long Term Targets)⭐⚡🌟
Based on technicals, cycles, and above factors:
Short-Term
Target: $92,000 (potential upside) or $78,000 (potential downside)
Prediction: A moderate level of buying pressure could push BTC towards the $92,000 level. However, if selling pressure increases, BTC could drop to $78,000.
Medium-Term
Target: $110,000 (potential upside) or $60,000 (potential downside)
Prediction: A sustained level of buying pressure could push BTC towards the $110,000 level. However, if macroeconomic conditions deteriorate, BTC could drop to $60,000.
Long-Term
Target: $140,000 (potential upside) or $40,000 (potential downside)
Prediction: A strong level of adoption and favorable regulatory environment could push BTC towards the $140,000 level. However, if the global economic outlook worsens, BTC could drop to $40,000.
⭐⚡🌟Overall Summary Outlook⭐⚡🌟
Current State: BTC at $84,000 reflects a strong rally, likely post-2024 halving, supported by fundamentals and macro conditions.
Risks: Regulatory crackdowns, overleverage, or a macro shock (e.g., recession) could trigger sharp declines.
Opportunities: Institutional adoption, dollar weakness, and scarcity drive upside.
Final Call: Short-term Bearish (correction imminent), Medium/Long-term Bullish (uptrend intact).
📌Keep in mind that these factors can change rapidly, and it's essential to stay up-to-date with market developments and adjust your analysis accordingly.
⚠️Trading Alert : News Releases and Position Management 📰 🗞️ 🚫🚏
As a reminder, news releases can have a significant impact on market prices and volatility. To minimize potential losses and protect your running positions,
we recommend the following:
Avoid taking new trades during news releases
Use trailing stop-loss orders to protect your running positions and lock in profits
💖Supporting our robbery plan 💥Hit the Boost Button💥 will enable us to effortlessly make and steal money 💰💵. Boost the strength of our robbery team. Every day in this market make money with ease by using the Thief Trading Style.🏆💪🤝❤️🎉🚀
I'll see you soon with another heist plan, so stay tuned 🤑🐱👤🤗🤩

BITCOIN, SCARED ? After all good News FOMO ?Dear crypto investors / Traders,
always follow the PA. after all positive news by US Govt. newbie wondering why this happening,
its a PA by not News. if you wanna reserve something, you need best price like fresh meat for long to preserve with ice burg. same as it is price will tell you all. Just spend time on charts it will tell you all of it, just need to wait like a leopard. follow the Process for all and everywhere.

#BTCUSD 1DAYBTCUSD (1D Timeframe) Analysis
Market Structure:
The price is approaching a key support level, which has previously acted as a strong zone for price reversals. This level is crucial for determining the next directional move.
Forecast:
It is advisable to wait for the price to reach the identified support level. If the market shows signs of a bullish reversal, such as bullish candlestick patterns or strong buying pressure, a buy opportunity may be considered.
Key Levels to Watch:
- Entry Zone: Monitor the price action near the support level and consider buying if there is confirmation of a bounce.
- Risk Management:
- Stop Loss: Placed below the support zone to manage risk in case of a breakdown.
- Take Profit: Target the next resistance levels for potential upside gains.
Market Sentiment:
Market sentiment will be confirmed upon testing the support level. A strong bounce would indicate bullish interest, while a breakdown may signal further downside. Waiting for confirmation will help in making a more informed decision.

BTCUSDT 1WBTC ~ 1W Analysis
#BTC Expect good news to continue this pattern of increase. Maybe the next few weeks.
BTCUSDT: On the way back up to $110k!Dear traders,
Hope you are doing great, we have an excellent buying opportunity coming up or currently forming. Price has reversed with strong bullish volume, indicating a strong bullish impulse. A possible entry will be at breakthrough of inducement trend line.
If you agree with the idea, then please consider liking and commenting the idea which will encourage us to post more such ideas.
❤️

BTC/USDT "Bitcoin vs Tether" Crypto Market Bearish Heist Plan🌟Hi! Hola! Ola! Bonjour! Hallo!🌟
Dear Money Makers & Robbers, 🤑 💰🐱👤🐱🏍
Based on 🔥Thief Trading style technical and fundamental analysis🔥, here is our master plan to heist the BTC/USDT "Bitcoin Tether" Crypto Market. Please adhere to the strategy I've outlined in the chart, which emphasizes short entry. Our aim is the high-risk Green Zone. Risky level, oversold market, consolidation, trend reversal, trap at the level where traders and bullish robbers are stronger. 🏆💸Book Profits Be wealthy and safe trade.💪🏆🎉
Entry 📈 : The heist is on! Wait for the breakout of (94000) then make your move - Bearish profits await!"
however I advise placing Sell stop below the support line or Sell limit orders within a 15 or 30 minute timeframe. Entry from the most recent or closest low or high level should be in swing/retest.
I highly recommend to use alert in your trading platform.
Stop Loss 🛑: Thief SL placed at 97000 (swing Trade Basis) Using the 4H period, the recent / swing high or low level.
SL is based on your risk of the trade, lot size and how many multiple orders you have to take.
Target 🎯: 86500 (or) Escape Before the Target
🧲Scalpers, take note 👀 : only scalp on the Short side. If you have a lot of money, you can go straight away; if not, you can join swing traders and carry out the robbery plan. Use trailing SL to safeguard your money 💰.
📰🗞️Fundamental, Macro, COT, Sentimental Outlook:
The BTC/USDT "Bitcoin Tether" Crypto Market is currently experiencing a Neutral trend (there is a higher chance for Bullishness).., driven by several key factors.
🌟☀ Fundamental Analysis
Institutional adoption (e.g., MicroStrategy) remains strong, but ETF outflows (650.8M last week) signal caution.
Hash rate near all-time highs supports network security; post-2024 halving supply reduction is a bullish long-term factor.
Pro-crypto US regulatory shifts are positive, though global uncertainty persists.
🌟☀ Macro Economics
Potential US rate cuts in 2025 could weaken USD, boosting BTC; tighter policy may pressure it.
Recession fears in Europe vs. US resilience create mixed risk sentiment; BTC correlates with equities.
Geopolitical tensions enhance Bitcoin’s store-of-value appeal.
🌟☀ Commitments of Traders (COT) Data
Large speculators slightly net long, showing cautious optimism; no extreme positioning.
Hedgers net short, typical for futures; retail longs are moderate, not overcrowded.
🌟☀ On-Chain Analysis
Exchange outflows exceed inflows (ratio ~0.98), indicating accumulation.
Long-term holders steady, short-term holder realized price at 96,000 acts as support.
Whale activity mixed: some profit-taking, but accumulation persists below 97,000.
🌟☀ Market Sentiment Analysis
Retail sentiment neutral, cautious on X; no extreme greed or fear.
Institutional hesitancy (ETF outflows) offsets professional traders’ accumulation views.
🌟☀ Positioning
Support at 96,000, resistance at 98,500-99,000; liquidity pools suggest breakout potential.
RSI (~50) neutral, MACD shows fading bearish momentum.
🌟☀ Overall Summary Outlook
Short-term: Consolidation between 94,000-100,000, slight upward bias.
Medium-term: Bullish if macro aligns (104,000-110,000); downside risk to 90,000.
Long-term: Fundamentals favor 120,000 by mid-2025.
⚠️Trading Alert : News Releases and Position Management 📰 🗞️ 🚫🚏
As a reminder, news releases can have a significant impact on market prices and volatility. To minimize potential losses and protect your running positions,
we recommend the following:
Avoid taking new trades during news releases
Use trailing stop-loss orders to protect your running positions and lock in profits
📌Please note that this is a general analysis and not personalized investment advice. It's essential to consider your own risk tolerance and market analysis before making any investment decisions.
📌Keep in mind that these factors can change rapidly, and it's essential to stay up-to-date with market developments and adjust your analysis accordingly.
💖Supporting our robbery plan will enable us to effortlessly make and steal money 💰💵 Tell your friends, Colleagues and family to follow, like, and share. Boost the strength of our robbery team. Every day in this market make money with ease by using the Thief Trading Style.🏆💪🤝❤️🎉🚀
I'll see you soon with another heist plan, so stay tuned 🤑🐱👤🤗🤩

Bitcoin at a Critical Level: Will Support Hold or Break?CRYPTOCAP:BTC is currently accumulating within a marked zone, fluctuating within a broad range of approximately $17,800. The previous resistance line has now acted as support, indicating a key retest level.
If BTC fails to hold this support, a further decline toward the key support zone could be expected. The RSI is near 42.83, suggesting neutral momentum, with no strong bullish signs yet.
A breakdown below this range could trigger a bearish move, while a breakout above resistance would confirm bullish continuation.
DYOR, NFA
Thank you for your attention! If you found this valuable, please hit the like button and share your thoughts in the comments below.

BTC Breach Alert: Long Positions at Risk!CRYPTOCAP:BTC has broken below the broad accumulation zone.
Exercise caution with long positions.

Bitcoin Plunges Below Support: $70k Looms Amid Selling Pressure● Bitcoin has broken below its key support level of $91,000, sparking concerns of a deeper correction.
● If selling pressure persists, a sharp drop to $70,000 could be imminent.
● Market sentiment has shifted decisively bearish, reflecting growing investor anxiety.

BTC Bitcoin - Upside Likely THIS WEEK (Thanks Retail Liquidity)Here's a challenge for you:
How many places of built-up liquidity can you spot on this chart that indicated where price is heading to...?
Post your chart below.
Admittedly this isn't the easiest environment to trade in, but still the clues are there.
Plus: DXY Dollar is weak for now, so XXXUSD seem more likely to be Bullish.
Now we stalk it and wait to see the flip to the Upside (if it happens). The invalidation point is the clear last Wick low.
There could be more opportunities later to scale in.
------------------
Are you seeing price action here the same as I am?
If not, comment below and tell me if I'm missing something...

New bitcoin pattern on 1WUsually on Monday we publish analytics with a local perspective, but this time we have not enough information for a full-quality forecast.
Nevertheless, this week is notable for the fact that a new EXP pattern has formed on INDEX:BTCUSD on the weekly timeframe.
It is notable that we have an earlier pattern from May 21👇
And the new pattern is essentially the "big brother" of the smaller pattern and gives us more distant target levels (as is often the case with higher-level patterns, most likely not all of them will be reached).
The fact that the formation of this model occurred through the touch of the trend line increases the probability of a test of $73,757 and $77,723 (but only increases, the level of uncertainty is still high).

Bitcoin Trapped in a Range – Which Way Will It Break?BTC is currently accumulating within a marked zone, trading within a broad range of approximately $17,800. The previous resistance line has now turned into support, indicating a possible consolidation phase before the next move.
The price is fluctuating near the 50 EMA ($97,811.26), which may act as dynamic resistance. A breakout above this level could signal renewed bullish momentum, while failure to hold support may lead to further downside.

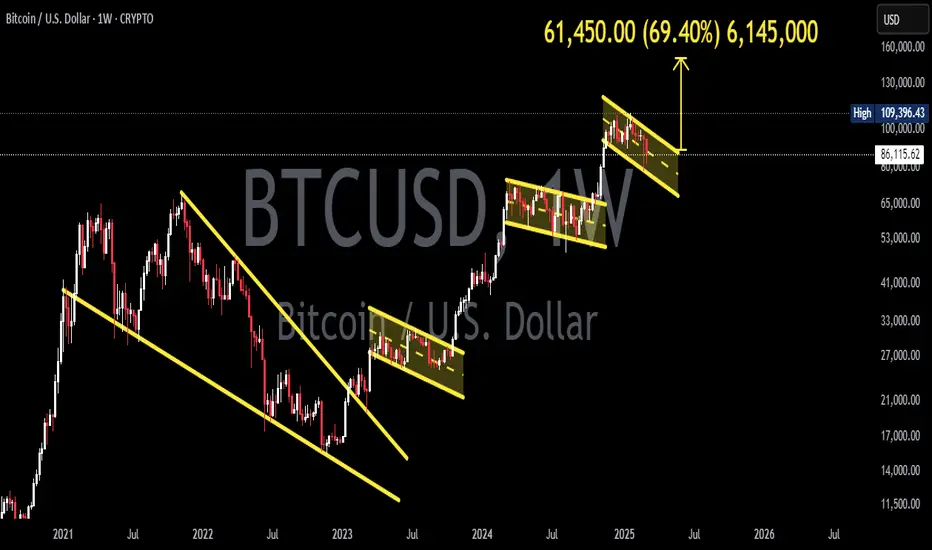
Comprehensive analysis of Bitcoin (exclusive)Bitcoin is currently in a critical consolidation period. Both technical and fundamental factors point to the approaching change. The short-term trend needs to focus on the choice after the volatility rebounds. If it breaks through $109,000, it will accelerate the rise. If it falls below $91,000, it will cause a correction. However, David believes that the 50-day and 200-day moving averages form a "golden cross", which usually indicates a medium- to long-term bullish trend. In the long run, the price of Bitcoin may continue to rise.
If you agree with my analysis, please keep paying attention. I will share my views for free later-(David). BITSTAMP:BTCUSD COINBASE:BTCUSD BITSTAMP:BTCUSD

Bitcoin latest trend analysis (exclusive)Dear traders
At present, from the short-term moving average of Bitcoin, MA5 is 96076.33, MA10 is 96058.60, MA30 is 96094.49, and MA60 is 96047.77. The moving average values of different periods are relatively close, indicating that the overall price fluctuations in the short term are not large and are in a relatively stable state. From the market situation, the slight decline of Bitcoin has not caused panic and selling in the market. The overall market is relatively stable, but David believes that Bitcoin still has a small increase.
Suggestions:
Buy: 95500
Tp: 96000
Tp: 97000
Sl: 95000
If you agree with my analysis, please continue to pay attention. I will share my views for free later. (David) COINBASE:BTCUSD BITSTAMP:BTCUSD BITSTAMP:BTCUSD

BTCUSDT - plz 80k My strategy
1. Trend to continue
2. There should be min 3 slashes + V + lead in the same direction
3. it is possible to enter at the trend level if there is activity in the feed or volumes will be substituted.
4. We enter at the breakdown of the level, if there is volume, then the breakdown of this level, if not, then at the price of the spot level (rubber futures).
5. Tape activity or volume substitution in our direction
6. if they start to put volumes against us or no activity.
of the tape is gone, it is better to exit (it is possible to pre-enter if conditions appear)
if you like the idea, please "Like" it. This is the best "Thanks!" for the author 😊 P.S. Always do your own analysis before a trade. Put a stop loss. Fix profits in installments. Withdraw profits in fiat and please yourself and your friends.

Bitcoin Latest Trend Analysis (David)Dear traders
Bitcoin is currently between $95,825 and $97,297. David believes that Bitcoin will continue to fall. What do you think?
The reasons are:
1. The US non-agricultural employment data in January 2025 was lower than expected (143,000 new jobs), and the unemployment rate dropped to 4%, but the Federal Reserve may only cut interest rates once, and interest rates remain relatively high, causing risk assets to be under pressure
2. The "reciprocal tariff" measures announced by Trump may escalate trade conflicts and intensify market volatility. Geopolitical risks such as the Middle East will cause funds to flow to traditional safe-haven assets, triggering a sell-off of Bitcoin
What do you think about this? You are welcome to discuss with me
If you agree with my analysis, please continue to pay attention. I will share my views for free later-(David) COINBASE:BTCUSD BITSTAMP:BTCUSD COINBASE:BTCUSD

Exclusive - comprehensive analysis of Bitcoin trendsHello everyone:
Currently, Bitcoin has received strong support near $95,000 and has been fluctuating in the $100,000 range. However, due to macroeconomic uncertainties (such as the strengthening of the US dollar index), the price fell from $100,000 to $95,000, indicating short-term selling pressure.
Summary and strategic suggestions
Currently, Bitcoin is in the key range of $95,000-$100,000. In the short term, it is affected by policy and macroeconomic disturbances, but in the medium and long term, it is still supported by institutional demand and halving cycle logic.
If you agree with my analysis, please keep paying attention. I will share my views for free later. (David)
BITSTAMP:BTCUSD COINBASE:BTCUSD

Bitcoin’s Price Squeeze—What’s Next?Bitcoin (BTC) is currently consolidating within a marked accumulation zone after facing resistance near its all-time high (ATH). The price is fluctuating within a broad range of approximately $17,800, indicating a phase of indecision between buyers and sellers.
The key observation is that a previous resistance trendline has now flipped into support, showing a potential shift in market sentiment. Additionally, the 100-day EMA around $93,458 is providing dynamic support, reinforcing this bullish structure.
The key support zone (highlighted in green) remains critical; as long as BTC holds above this area, the bias leans bullish. A breakout above the accumulation range could trigger a strong upward move, potentially retesting the ATH. Conversely, if BTC loses the support of both the trendline and the 100 EMA, it may lead to a deeper correction toward lower support levels.

BTCUSDT to bounce from 4h support towards weekly resistanceHere is the next trade setup for long. The price is likely to dip into 4h support zone deeper, but we will keep building position as the price dips further into the zone. Target is first 4h resistance 4HR1 then daily resistance DR1 and then weekly resistance WR1. We will evaluate the price action as it will reach these resistance milestones. There are retracement possible from these levels and therefore we will book some profit at these levels and will add on the retracements depdending on the charactersitics of the retracements.
