Btcusdtlong

BTCUSDT 1WBTC ~ 1W Analysis
#BTC I hope this is the last decline, Bitcoin is tired of the current decline. Selling pressure is decreasing we think.

BTCUSDT:Consider going long at a lower priceIt can be seen from the chart that BTC has successfully broken through the support level of 86,000 over the past few days and has approached the historical resistance level. We can monitor the latest support level around 83,500. If this level is not broken through within a short period of time, one may consider initiating a long position at a relatively low price.
BTC Trading strategy:
buy@83500-84000
TP:86500-87500
Get daily trading signals that ensure continuous profits! With an astonishing 90% accuracy rate, I'm the record - holder of an 800% monthly return. Click the link below the article to obtain accurate signals now!

BTC:Today's Profit-making StrategyThe price of BTCUSDT has been moving steadily for many days and is now forming a potential bullish continuation setup.
A retracement to the 86,500 area is expected. If the price respects this area and shows a bullish reaction, a long - position opportunity emerges.
BTC Trading strategy:
buy@86500
TP:87500-88500
Get daily trading signals that ensure continuous profits! With an astonishing 90% accuracy rate, I'm the record - holder of an 800% monthly return. Click the link below the article to obtain accurate signals now!

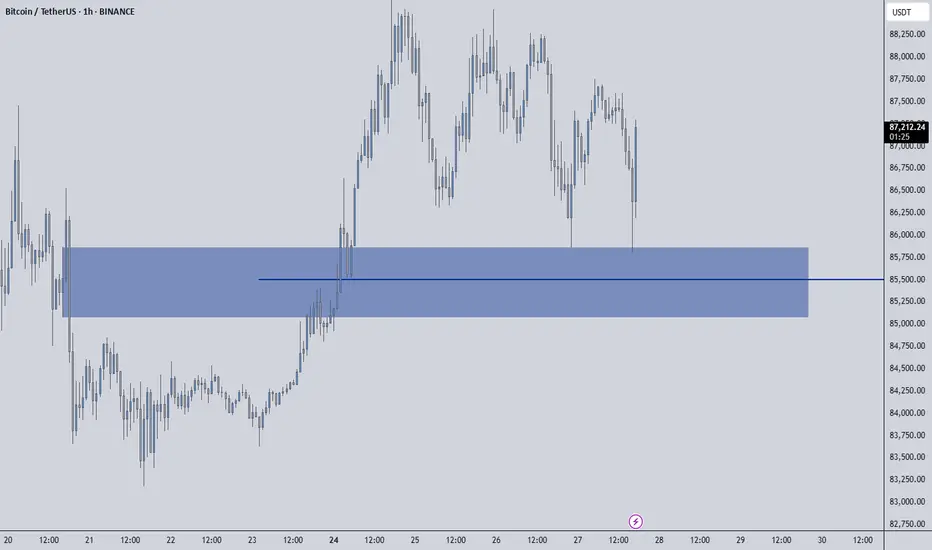
BTCUSDT - Low Time Frame Support Level I believe that BTCUSDT is at a critical level right now, and this blue box combined with the blue line is where we could see some price reaction. However, don't expect a major move, this is a low timeframe zone that might only give us smaller, more precise opportunities.
🔹 What To Watch For:
Reaction Potential: If the price touches this blue box and blue line, there may be a short-term reaction, but don't overestimate it.
Low Timeframe Focus: Keep an eye on the lower timeframes for breakouts or rejections around these areas.
Patience Is Key: This isn't a large move zone, so we will wait for confirmation before acting.
💡 Stay Smart: Always trade with confirmation. If the price moves fast and unexpectedly, we won't chase it. Stay in control, and wait for the right signals!
📌I keep my charts clean and simple because I believe clarity leads to better decisions.
📌My approach is built on years of experience and a solid track record. I don’t claim to know it all but I’m confident in my ability to spot high-probability setups.
📌If you would like to learn how to use the heatmap, cumulative volume delta and volume footprint techniques that I use below to determine very accurate demand regions, you can send me a private message. I help anyone who wants it completely free of charge.
🔑I have a long list of my proven technique below:
🎯 ZENUSDT.P: Patience & Profitability | %230 Reaction from the Sniper Entry
🐶 DOGEUSDT.P: Next Move
🎨 RENDERUSDT.P: Opportunity of the Month
💎 ETHUSDT.P: Where to Retrace
🟢 BNBUSDT.P: Potential Surge
📊 BTC Dominance: Reaction Zone
🌊 WAVESUSDT.P: Demand Zone Potential
🟣 UNIUSDT.P: Long-Term Trade
🔵 XRPUSDT.P: Entry Zones
🔗 LINKUSDT.P: Follow The River
📈 BTCUSDT.P: Two Key Demand Zones
🟩 POLUSDT: Bullish Momentum
🌟 PENDLEUSDT.P: Where Opportunity Meets Precision
🔥 BTCUSDT.P: Liquidation of Highly Leveraged Longs
🌊 SOLUSDT.P: SOL's Dip - Your Opportunity
🐸 1000PEPEUSDT.P: Prime Bounce Zone Unlocked
🚀 ETHUSDT.P: Set to Explode - Don't Miss This Game Changer
🤖 IQUSDT: Smart Plan
⚡️ PONDUSDT: A Trade Not Taken Is Better Than a Losing One
💼 STMXUSDT: 2 Buying Areas
🐢 TURBOUSDT: Buy Zones and Buyer Presence
🌍 ICPUSDT.P: Massive Upside Potential | Check the Trade Update For Seeing Results
🟠 IDEXUSDT: Spot Buy Area | %26 Profit if You Trade with MSB
📌 USUALUSDT: Buyers Are Active + %70 Profit in Total
🌟 FORTHUSDT: Sniper Entry +%26 Reaction
🐳 QKCUSDT: Sniper Entry +%57 Reaction
📊 BTC.D: Retest of Key Area Highly Likely
📊 XNOUSDT %80 Reaction with a Simple Blue Box!
📊 BELUSDT Amazing %120 Reaction!
I stopped adding to the list because it's kinda tiring to add 5-10 charts in every move but you can check my profile and see that it goes on..
Bitcoin Nears Breakout: Can Bulls Push Past $89K?Currently, the key support level for the price of Bitcoin is around $86,000. This level has played a supporting role several times in the recent price fluctuations. If the price can hold this position, it will provide strong support for subsequent upward movements. The key resistance level above is at $89,000. If the price of Bitcoin can break through and firmly stand above this resistance level, it is highly likely to initiate a new round of upward market; if it fails to break through, the price may continue to experience small - scale oscillatory rebounds within the current range.
From a technical indicator perspective, the moving average indicates that Bitcoin has a short - term upward trend. The price has broken through the area where the signal line is located, indicating that the pressure from "digital gold" buyers is relatively high, and the asset value is likely to continue the upward momentum from the current level. However, the MACD indicator experienced a bearish crossover at the beginning of this week. Although the signal line is currently downward, the MACD line has started to move upward. Nevertheless, a trend reversal is unlikely to occur in the short term. In terms of the Relative Strength Index (RSI), this indicator has moved out of the oversold area and is currently in the neutral zone, indicating that the seller's market may have ended. The price of Bitcoin is expected to maintain its current position and may further rise within the next 5 - 7 days.
BTCUSDT
buy@86000-86500
tp:87500-88500
I will share trading signals every day. All the signals have been accurate for a whole month in a row. If you also need them, please click on the link below the article to obtain them.

BTC's Bull Run: Profit Realized, Resistance AheadCurrently, BTC is hovering around $88,000. We had already achieved our profit target yesterday. Ever since BTC broke through the $85,000 mark, it has been rising continuously. The market is in a bullish - dominated trend, with strong buying power driving the price up steadily. Although it's in an uptrend, there's uncertainty about its future movement as it hasn't broken through the $89,000 - $90,000 resistance range. If it fails to break through this resistance zone effectively, the price may decline again eventually.
I will share trading signals every day. All the signals have been accurate for a whole month in a row. If you also need them, please click on the link below the article to obtain them.

BTC Rejected at $89K, Uptrend Holds. Bullish Bets?BTC faced rejection at the $89,000 resistance level yesterday, triggering a pullback. However, the overall uptrend remains intact. Investors may consider long positions on signs of stabilization after this corrective move.
BTCUSDT
buy@84500-85500
tp:87000-88000
I will share trading signals every day. All the signals have been accurate for a whole month in a row. If you also need them, please click on the link below the article to obtain them.

BTCUSDT Rally: From $85K to $88K+, What's NextToday, the price of BTCUSDT has shown a robust upward trend. Bullish forces are extremely active, steadily propelling the price to continuously climb, demonstrating a sharp offensive momentum.
From a technical perspective, upon in - depth analysis, the current price is gradually approaching the crucial resistance range of 89,000 - 90,000.
This range has played a significant role in past price movements. Its breakthrough situation will be a pivotal turning point determining the subsequent price trend.
Once a successful breakthrough occurs, it is highly likely to attract more capital inflows, driving the price to initiate a new round of upward price action.
I will share trading signals every day. All the signals have been accurate for a whole month in a row. If you also need them, please click on the link below the article to obtain them.

Bitcoin (BTC/USD) Bullish Momentum: Key Levels and Trade Setupuddy'S dear friend 👋 SMC Trading Signals Update 🗾 🗺️
Technical Analysis:
Timeframe: 4-hour chart
Current Price: $88,244
Trend: Uptrend within an ascending channel
Supply Resistance Zone: $92,721 (Potential reversal area)
Fair Value Gap (FVG) Support Zone: $87,200 - $87,600
200 MA Resistance: Price is approaching the 200 Moving Average, which could act as resistance.
Key Levels:
1. Support:
FVG Zone (~$87,200 - $87,600) – Potential buy zone
Major Support: $86,649
2. Resistance:
$92,721 (Supply Zone) – Key target level
$90,000 Psychological Resistance
3. RSI Indicator:
Currently at 76.37, indicating overbought conditions.
A potential pullback could occur before further upside.
Mr SMC Trading point
Risk Management Strategy:
Long Entry: Near FVG Zone (~$87,200 - $87,600) if price retraces.
Stop Loss: Below $86,649 to limit downside risk.
Take Profit: Around $92,721 for a risk-reward trade.
Market Outlook:
Bitcoin remains bullish, but the RSI suggests a possible pullback before continuation.
A retracement into the FVG Zone may provide a better buying opportunity before the next leg up.
If price breaks below the FVG zone, the uptrend could weaken.
Pales support boost 🚀 analysis follow)

BTCUSDT: Target Achieved, What's Next for 87,500 Resistance?Upon reviewing the trading strategy devised last week, the current market price has successfully rallied to the targeted level. Bitcoin against Tether (BTCUSDT) is quoted at 86,780, registering an intraday gain of 0.84%. From the vantage points of technical analysis and market dynamics, the robust resistance level in the vicinity of 87,500 above emerges as a pivotal factor in determining whether the price can sustain its upward trajectory.
I will share trading signals every day. All the signals have been accurate for a whole month in a row. If you also need them, please click on the link below the article to obtain them.
$BTC FINALLY BULL RALLY ON CHART NOW & 2nd TAKE PROFIT DONEJUST IN NEWS : BTC Bear Market To Last 90 Days, Analyst Predicts, as Trade War Fears and Whale Activity Impact Prices
Bitcoin has entered a bear market, with its price dropping over 20% from its all-time high. Market analyst Timothy Peterson expects the downturn to last 90 days, arguing that this decline is weaker than most past bear markets. He noted that out of the 10 previous downturns, only four—2018, 2021, 2022, and 2024—have been worse in terms of duration. Peterson does not see BTC sinking far below $50,000 but says a slide in the next 30 days could be followed by a 20-40% rally after April 15. He believes this could trigger renewed buying interest and push Bitcoin higher.
Investor sentiment has been affected by global trade war concerns following tariffs imposed by U.S. President Donald Trump and retaliatory measures from multiple trading partners. The uncertainty has led to a decline in speculative investments. The Glassnode Hot Supply metric, which tracks BTC held for a week or less, has fallen from 5.9% in November 2024 to 2.3% by March 20, signaling reduced short-term trading activity. A CryptoQuant report also suggests that most retail investors are already in the market, countering expectations that a surge of new traders would drive prices up.
Ether has also struggled, losing over 51% in three months since peaking above $4,100 on December 16, 2024. Analysts say ETH must reclaim the $2,200 range to gain upward momentum. “If price can generate a strong enough reaction here, then #ETH will be able to reclaim the $2,196-$3,900 Macro Range (black),” wrote crypto analyst Rekt Capital in a March 19 X post. Despite positive regulatory developments, such as the U.S. Securities and Exchange Commission dropping its lawsuit against Ripple, ETH has yet to see significant gains.
Market uncertainty remains high, with some analysts expecting economic pressures to last until at least April 2025. Despite short-term volatility, long-term projections remain optimistic. VanEck has predicted a $6,000 cycle top for ETH and a $180,000 peak for BTC in 2025.
Disclaimer: This article is for informational purposes only and does not constitute financial advice. Always conduct your own research before making any investment decisions.

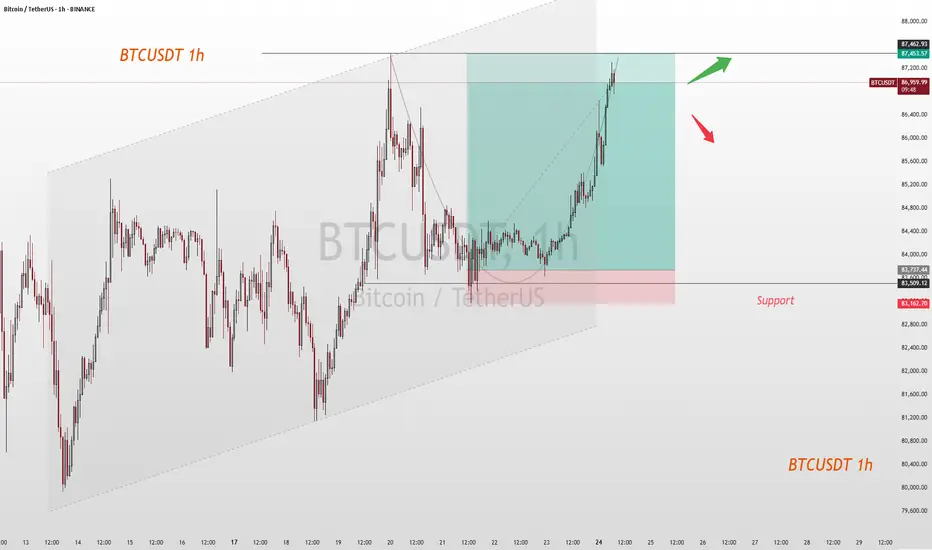
Bitcoin (BTC/USD) 4H Analysis: Bullish Breakout or Pullback?🔍 Key Observations:
🔹 📈 Trendline Breakout: The descending trendline (white) has been broken, signaling a potential uptrend.
🔹 📍 Support & Resistance Zones:
🟢 Strong Support (~$80,349 - $82,000): 📉 If price drops, this zone could act as a bounce area. 🛑 Stop-loss is placed below.
🟡 Resistance (~$86,000 - $88,000): 🔄 Currently testing this level—either a breakout or a rejection could follow.
🔵 Next Target (~$94,000): 🚀 If Bitcoin pushes above resistance, this could be the next stop.
📊 Possible Price Action Scenarios:
✅ Bullish Path:
🟢 Breaks Above $86,000 → Targets $94,000 🚀
🔄 Small retest of support before continuing up 📈
❌ Bearish Path:
❌ Rejected at $86,000 → Pullback to $82,000 🔽
📉 If support fails, price may drop further
🎯 Conclusion:
🔥 Bullish Bias: 🟢 A breakout above $86,000 increases the chance of hitting $94,000+.
⚠️ Watch for retests! 🔄 A pullback before an upward move is possible.
🚀 Final Thought: If BTC **

BTCUSD BUY NEXT MOVE 1. Bearish Reversal Scenario:
Alternative Outlook: Instead of continuing upward to the next target, Bitcoin may fail to breach the resistance and reverse downward due to a potential "bull trap."
Trigger: A rejection at or near the double-top resistance around $88,000 could initiate a sell-off toward the trendline support near $85,000 or lower.
Bearish Volume Confirmation: If there is a significant bearish divergence on indicators like RSI or MACD, it could confirm the weakening bullish momentum.
2. Range-Bound Consolidation:
Alternative Setup: BTC might get stuck in a sideways consolidation range between $85,000 (support) and $88,000 (resistance), reflecting indecision in the market.
Trigger: This could be driven by mixed macro signals (like interest rate policies, crypto market sentiment) and lack of volume to push the price strongly in either direction.
3. False Breakout (Bull Trap):
Alternative Bearish Scenario: If BTC spikes slightly above the double-top resistance (around $88,000) but fails to hold the breakout level, it could trap late buyers and drop quickly.
Trigger: A false breakout pattern often occurs with low volume on the breakout attempt followed by a sharp reversal.
Potential Drop Target: BTC may then fall toward $83,000 or even retest $82,000 as deeper support

BTC Nears Key Breakout: Can It Push Past 84.5K?Right then, BTC/USDT is at a bit of a crucial point at the moment. The buying range we flagged earlier, 82,000 - 83,500, has been left behind, with the price now sitting at 84,139.51 – up 0.06% on the day.
The target for taking profits is still 84,500 - 86,000, and we’re currently hovering near the lower end of that at 84,500. If it manages to break through that level, there’s a decent chance it could push higher – but it’s worth keeping an eye on whether the rally’s got enough steam to keep going.
Things to watch:
84,500 Breakout: If it cracks this level and holds, we could be in for more upside.
Momentum: Keep tabs on volume and market sentiment to see if this move’s got legs.
Pullback Risk: If it doesn’t break through, don’t be surprised if we see a bit of a dip.
BTCUSDT
Buy82000-83500
tp:84500-86000
I will share trading signals every day. All the signals have been accurate for a whole month in a row. If you also need them, please click on the link below the article to obtain them.

BTCUSDT:Wait for retracement and go longBTC has been fluctuating around 84,000, showing an overall upward trend in its movement. It is advisable to continue waiting for a pullback before taking a long position.
BTC Trading strategy:
buy@83500
TP1:85500
TP2:86500
Get daily trading signals that ensure continuous profits! With an astonishing 90% accuracy rate, I'm the record - holder of an 800% monthly return. Click the link below the article to obtain accurate signals now!

BTCUSDT , we near to bullish runHello everyone
According to the chart that you see , we were in correction wave from the top until now , but the wave of correction is weakness and we think that the price wanna re-check the downward trendline and after that is ready to start bull run.
if you have any question and need help for managing your portfolio send us messages
Thank you
AA

BTCUSDT TRDAING POINT UPDATE > READ THE CHAPTIAN Buddy'S dear friend
SMC Trading Signals Update 🗾🗺️ crypto Traders SMC-Trading Point update you on New technical analysis setup for crypto BTC USDT list time post signals 💯 reached target 🎯✔️ New technical analysis Setup two said fisrt make close above ground that expect bullish trend 🚀 target point 88k 90k. Next patterns if close below 👇 ⬇️ 83k 80k strong 💪 support level up trand target point 88k 90k fisrt entry risk 🙏. Good luck 💯💯
Key Resistance level 87k + 80k + 90k
Key Support level 83k - 80k
Mr SMC Trading point
Pales support boost 🚀 analysis follow)

Long Term Bitcoin SituationRemember the time that we broke out the major bull flag in Bitcoin? It caused many new all time high levels in recent months. The problem is that Bitcoin lost its 5 waved bullish momentum. We see an upwards move only because of the fundemantel news.
I believe we are currently in a correction phase known as A-B-C pattern according to Elliot Waves theory. In order for Bitcoin to create another all time high level, there some requirements to achieve.
First, another bullish fundemantel actor in macro economic events. This could be an interest rate cuts, something about ETF's or even some crayz idea from Trump himself. Problably, it will be about intrest rates to be cut down in next june.
Second, Bitcoin needs to gain its delta momentum back (it's called CVD). For many weeks while Bitcoin has risen up, there were some significant movements in futures section. Bulls and long term holders were keeping their positions. With acceptence of the ETF's, spot Bitcoin volume was increased as well. The problem about this part of the story is, big instutial money that carried Bitcoin upwards is leaving. It's mostly because of the new politics that Trump has brought to the US. Instutial money or simple retail traders don't really like when there is an uncertainity about the economy. Fear and uncertainity is taking smart money away from Bitcoin. When this situation changes, money flow will change again and Bitcoin may catch the momentum it needs.
As the last requirement, Bitcoin hasn't actualy swept all the remaining liquidtiy below the lastly formed bullish flag. It's important for two reasons:
1: In technical terms, it will be fine retest and safe entry.
2: All the rookies who play around with futures sections in exchanges will be eliminated. So there will enough liquidty to go upwards again.
Remember, market always run for the liquidty and all the tecnical things you heard from people around is shaped by this consept. We will meet below 70K again before this summer.
For short term, I believe there will be another uprising move before upcoming pullback. It will be a short one and will get people in.
You see RSI below the chart that it's broken a trendline. Usually it's something good but in this case, even though some other indicators tells us that Bitcoin catch is momentum back again, I don't believe its that simple. As an another example, MACD also screaming out for Bitcoin to rise at the this moment in the daily chart. As I mentioned earlier, it's all caused because of the fundemantel news. Nothing real.
Good Luck to us all .

#BTC #BTCUSDT #BITCOIN #LONG #Scalp #Scalping #Eddy#BTC #BTCUSDT #BITCOIN #LONG #Scalp #Scalping #Eddy
BTCUSDT.P Scalping Long Setup
Important areas of the upper time frame for scalping are identified and named.
This setup is based on a combination of different styles, including the volume style with the ict style.
Based on your strategy and style, get the necessary confirmations for this scalping setup to enter the trade.
Don't forget risk and capital management.
The entry point, take profit point, and stop loss point are indicated on the chart along with their amounts.
The responsibility for the transaction is yours and I have no responsibility for not observing your risk and capital management.
Be successful and profitable.


BTCUSDT EA MAN UPDATE >READ THE CHAPTAIN **BTCUSDT EA MAN Update – Analysis in English**
---
### **BTC/USDT Analysis (15 min) – Bullish Trend in Sight**
#### **Key Observations:**
- **FVG Support Zone (Fair Value Gap):** The price has reacted positively to this zone and is showing signs of a bullish recovery.
- **EMA Confluence:** The price is currently below the 30 EMA (red), but a breakout above could confirm stronger bullish momentum.
- **Target Point:** The analysis anticipates a move towards **85,104 USDT**, possibly after a slight pullback to test the support zone.
If the price sustains above the 30 EMA and breaks through the minor resistance, the bullish target seems achievable.

BTCUSDT - UniverseMetta - Signal#BTCUSDT - UniverseMetta - Signal
D1 - Potential formation of Double Bottom + formation of the 3rd wave from the level. It is better to reduce risks - news background + correction. Stop at the minimum of the 2nd wave.
Entry: 85302.95
TP: 87193.74 - 90677.11 - 94083.46 - 99390.73
Stop: 81089.58
