BTCUSDT likely to head to 29800 and aboveIt seems price would like to hit the top of the weekly resistance zone which is around 30000. Likely that a long is favorable here. I am in a long trade here targeting 29800.
Btcusdtlong

BTC on long-term basisHello traders, after the current dump of BTC, I expect a retest back to the area of 30-31k, and then we can short it from there again and our last target is the area of 20,000..
enjoy trading <3

BTCUSDT at 4h support, likely to head to daily resistance againSo the price did hit the daily resistance as mentioned in the last post, however, could not breach it. The price has now fell down to 4HS2 level which is another long opportunity. Lets try this long from that support to the daily resistance.

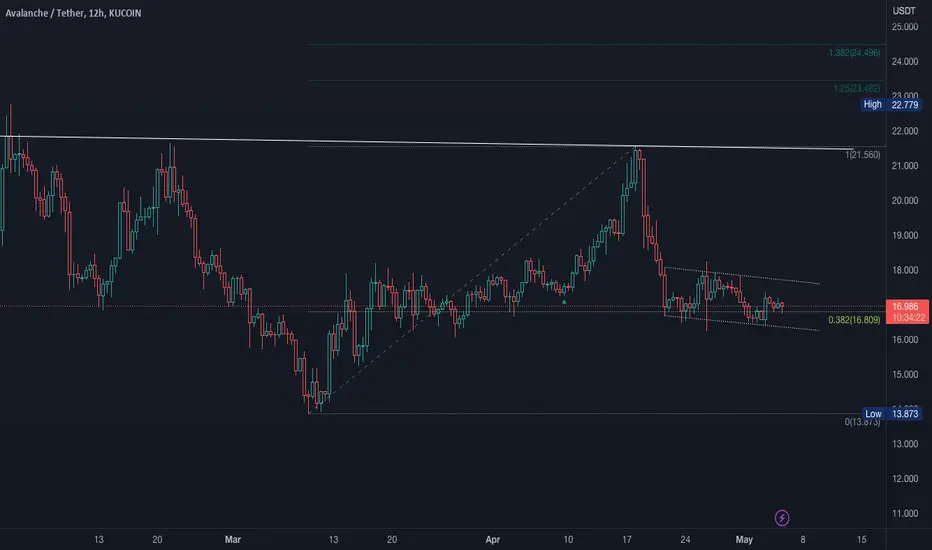
AVAX FLAG!KUCOIN:AVAXUSDT
AVAX sitting in a possible bear flag and looks like retesting the 382 (tempting!).
In consolidation at the moment. Break upwards will provide potential to 21.56 zone.
Break down, look for holding to 13.87 zone.
Uncertainty in US markets with potential of further bank collapses.
Bitcoin will run in this event providing upside to this potential setup.
Key: Let the market show you the direction.
Always having Plan A and Plan B scenarios so we can react once the markets provide an opportunity to execute our edge.
If you liked this idea or if you have your own opinion about it, write in the comments.
The information and publications are not meant to be, and do not constitute, financial, investment, trading, or other types of advice or recommendations.
BTCUSDT likley to head above daily resistance around 29360The price was pushed back from daily resistance and found support on 4h support area around 29050. I believe the price is going to push higher here. Not sure if it can break the resistance conclusively but there will be a fair attempt for the same.

BTCUSDT trading under daily and weekly resistanceThe price again hit the daily resistance overnight but got pushed down again and it is trading again below that resistance. But there is more case for the price to push up through the resistance rather than breaking down. I will observe it for while and then post a trade setup.

Btc analysis Well I would love to see price gyrate higher to collect liquidity ( buystops) that is to the 30k region and am okay
Guys Ur comments and like would be appreciated
Also don't forget to follow

Btc Quick Update Btcusdt
1h Time-frame
Breakout Was Already Confirmed Retest In process imcaae of successful retest expecting price to retest 30200 resistance
Dyor

Btc Latest Update Btcusdt
As I mentioned in my previous update, I remain bullish on BTC and expect it to continue trading above 27k. My current expectation is that the price of BTC will reach 32,000 to 35,000 .
Brc only needs to break 29450 level for bullish move.
However, if BTC breaks down from the current triangle pattern and closes below it on a candle, I may change my outlook to bearish. As of now, there are no indications of a bearish trend.

BTC can see a bounce from this OB before further lossesThe 1-hour bullish order block (cyan) at $27,750 could see a minor bounce in prices.
However the 4-hour and daily timeframe structures were bearish and showed that the trend pointed downward
The RSI and OBV noted declines to reflect selling pressure in recent hours
A session close below bullish hourly OB will invalidate the idea
Entry: $27,917
Exit: $28,750 (next LTF resistance)
Stop-loss: $27,620 (below OB)
R:R- 2.8

Bitcoin is still bullish | Update Btcusdt
BTC is currently moving with an ascending triangle pattern, which suggests a bullish trend. The price of BTC is expected to remain bullish as long as it stays above 27,000. Based on this scenario it is likely that the price of BTC will reach 32,000. However, incase of breakdown we could see a significant drop towards 25,000.
Risk is under you control
Dyor

Bitcoin (BTC) forming bullish BAT for another price reversalHi dear friends, hope you are well and welcome to the new trade setup of Bitcoin (BTC)
Previously we caught nice pump of BTC as below:
Now on a 1-hr time frame, Bitcoin is about to complete a bullish BAT move for the next price reversal.
Note: Above idea is for educational purpose only. It is advised to diversify and strictly follow the stop loss, and don't get stuck with trade

📈Bitcoin fake bullish scenario📉Hey everyone, first take a look at my previous analysis and positions.
Bitcoin can first test the green levels in the bullish scenario, then return to levels below 27,000 with more supply pressure.
Price divergences and important pivot levels are marked on the chart.
Don't forget to risk-free your position.
Consider the impact of the ISM Manufacturing PMI.
PMI above 50 is seen as positive for the DXY, whereas a result below 50 is seen as negative (or bearish).
Please share ideas and leave a comment, 1
let me know what's your idea.
CrazyS✌

BTCUSDT holding well, likely to head to daily resist. at 29230The price has closed above the 4h resistance which provides a good reason for price to move higher to the next resistance which is a daily resistance around 29230. A long is favorable here.

BTCUSDT likely to head up towards 28366 and 28560As mentioned in the previous post, a long from 27878 is still active. I believe the price would move up from here targeting towards 28366 first and then 28560.

BITCOIN - GEARING UP for another ATH ⬆Hi Traders, Investors and Speculators of the Charts 📈📉
In today's analysis, I take a look at a fractal that played out on Bitcoin during March 2019 over a few months. This was the beginning of the bull cycle that led to BTC's all time high.
Fractals can be very helpful to give an idea how the price action behaves after certain trends, which is where trend lines become especially useful in conjunction with fractal strategy.
I believe there is an important balance between trend line analysis / chart analysis, and technical indicator analysis. I find that trend analysis ( trend lines , support zone and resistance zone , Fibonacci ) is really helpful for longer term, whilst technical indicators such as RSI can be very useful for the shorter term. Important to note that today's analysis is focused on longer term, in other words potentially more than 3 months.
This analysis on Bitcoin corresponds with my previous in depth analysis on BTC , which you can find here 👇 This update uses BTC .D ( bitcoin dominance) and TOTAL2 (total market cap of alts) to speculate shorter term price action for Bitcoin .
_______________________
📢Follow us here on TradingView for daily updates and trade ideas on crypto , stocks and commodities 💎Hit like & Follow 👍
We thank you for your support !
CryptoCheck
