BTCUSDT SHORT M15At the moment, the BTCUSDT trading pair is experiencing a distribution moment. Taking into account the liquidity collected at the top, I open a position in SHORT from the POI and FGV m15 I indicated with the target:
80,607.65$
79,058.00$
76,606.00$
Risk for stop order -1%
Btcusdtsignal

BTCUSD buy signal. Don't forget about stop-loss.
Write in the comments all your questions and instruments analysis of which you want to see.
Friends, push the like button, write a comment, and share with your mates - that would be the best THANK YOU.
P.S. I personally will open entry if the price will show it according to my strategy.
Always make your analysis before a trade

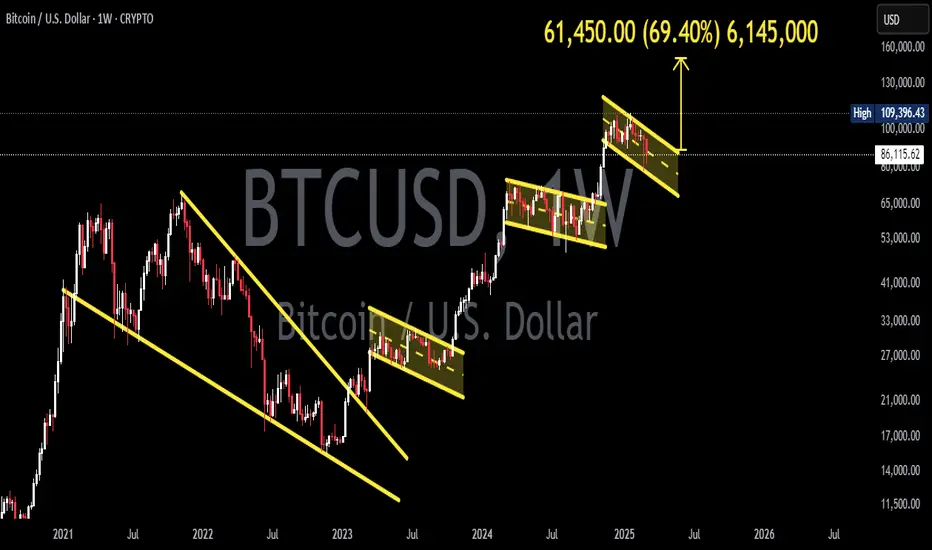
BTCUSDT 1WBTC ~ 1W Analysis
#BTC We hope Bitcoin does not damage this bullish structure. Or everything will get worse.

There are no failed investments, only failed operationsI. Trend analysis
🔹 overall trends:
Since the beginning of 2024, Bitcoin has experienced a clear upward trend, peaking at nearly $115,000.
The price has recently fallen below several key support levels and entered a downward trend, with prices testing support in the 80,000-85,000 range.
The short-term trend remains weak, and the market may continue to seek lower support levels.
🔹 moving average system:
The short-term moving average (red, 10th) indicating that the market is still dominated by short-term bears.
The long-term moving average (blue, 60 days) has also started to turn downward, suggesting a weakening of the medium-term trend.
Conclusion: The market is still in a downward trend, and the moving average system shows no obvious signs of stabilization.
Structural analysis (K-line morphology)
📌 head and shoulders may have been completed:
From the high level formed by 93,000 to 115,000, there is a more obvious head and shoulder structure, which is currently falling below the neckline (82,000) and accelerating the decline.
If this pattern holds, the target decline level may test the 77,000-80,000 area.
📌 M head shape:
The previous two highs (around 100,000) formed an M-head and fell below key support, remaining weak in the short term.
📌 support area:
77000 (important support, if broken, the medium-term trend may accelerate to short)
72000~ 75000 (target in extreme cases)
📌 resistance areas:
89000~ 90000 (early neckline, has turned to strong resistance)
93000 (if the market rebounds, it needs to break through this level to reverse the trend)

Bitcoin Collapses $80K, What’s Next?Its price briefly stabilized around $86K over the weekend before heading south at the start of the business week. It dropped to around $80K, leaving millions in liquidations on a 24-hour basis. Later, bulls stepped in and pushed the valuation to nearly $84K. The resurgence, however, was short-lived and was followed by another free fall to as low as $79,500. As of this writing, BTC is trading around $79,000, representing a 5% drop on the day. Its market cap dropped below $1.6 trillion.
While many industry players are hopeful that this is another temporary pullback that can be replaced by a new bull run, others are not so optimistic. Next up is a re-estimation of $78K for BTCUSD, “if that fails, the next $76300, 75,500 in the crosshairs.” BINANCE:BTCUSDT BITSTAMP:BTCUSD COINBASE:BTCUSD BYBIT:BTCUSDT.P

Bitcoin bullish moveFollow up on my last bitcoin post which hit my TP
Bitcoin will probably return to the resistance zone.
Stop loss: 80 K
Take profit: Around 95/96k

BTCUSDT TRADING POINT UPDATE >READ THE CHAPTIAN Buddy's dear friend 👋
SMC Trading Signals Update 🗾🗺️ crypto Traders SMC-Trading Point update you on New technical analysis setup for crypto BTC USDT BTC still rejected supply zone. Again. Back Short Trade. FVG level) 83k I'm want to Sell now short trend 📈
Key Resistance level 93k + 95k
Key Support level 85k - 83k
Mr SMC Trading point
Pales support boost 🚀 analysis follow)

BTCUSDT 1WBTC ~ 1W Analysis
#BTC Expect good news to continue this pattern of increase. Maybe the next few weeks.
BTC/USD Daily Forecast – Sell Setup from Supply Zone🔍 Market Breakdown Analysis:
Bitcoin has broken the key demand zone, indicating potential bearish momentum. As price pulls back, we will be looking for sell opportunities from the supply zone based on institutional order flow.
🎯 Trade Plan:
✅ Entry Zone: Supply Zone (Decision Point)
✅ Target 1: Key Structural Level (Decision Point Zone)
✅ Target 2: Extreme Order Block (Deeper Liquidity Grab)
✅ Confluence Factors: BOS (Break of Structure) + Liquidity Sweep
📊 Technical Outlook:
🔹 Market structure shift confirms a bearish bias.
🔹 Price may retest the supply zone before continuing downward.
🔹 Smart Money Concepts (SMC) suggest a high-probability short setup.
⚠️ Risk Management:
Always use a proper stop-loss and follow your trading plan. Stay disciplined and patient for the best entry.
💬 Drop your thoughts below! Are you bearish or bullish on BTC/USD? 👇🔥

BTCUSDT: On the way back up to $110k!Dear traders,
Hope you are doing great, we have an excellent buying opportunity coming up or currently forming. Price has reversed with strong bullish volume, indicating a strong bullish impulse. A possible entry will be at breakthrough of inducement trend line.
If you agree with the idea, then please consider liking and commenting the idea which will encourage us to post more such ideas.
❤️

BTC/USDT "Bitcoin vs Tether" Crypto Market Bearish Heist Plan🌟Hi! Hola! Ola! Bonjour! Hallo!🌟
Dear Money Makers & Robbers, 🤑 💰🐱👤🐱🏍
Based on 🔥Thief Trading style technical and fundamental analysis🔥, here is our master plan to heist the BTC/USDT "Bitcoin Tether" Crypto Market. Please adhere to the strategy I've outlined in the chart, which emphasizes short entry. Our aim is the high-risk Green Zone. Risky level, oversold market, consolidation, trend reversal, trap at the level where traders and bullish robbers are stronger. 🏆💸Book Profits Be wealthy and safe trade.💪🏆🎉
Entry 📈 : The heist is on! Wait for the breakout of (94000) then make your move - Bearish profits await!"
however I advise placing Sell stop below the support line or Sell limit orders within a 15 or 30 minute timeframe. Entry from the most recent or closest low or high level should be in swing/retest.
I highly recommend to use alert in your trading platform.
Stop Loss 🛑: Thief SL placed at 97000 (swing Trade Basis) Using the 4H period, the recent / swing high or low level.
SL is based on your risk of the trade, lot size and how many multiple orders you have to take.
Target 🎯: 86500 (or) Escape Before the Target
🧲Scalpers, take note 👀 : only scalp on the Short side. If you have a lot of money, you can go straight away; if not, you can join swing traders and carry out the robbery plan. Use trailing SL to safeguard your money 💰.
📰🗞️Fundamental, Macro, COT, Sentimental Outlook:
The BTC/USDT "Bitcoin Tether" Crypto Market is currently experiencing a Neutral trend (there is a higher chance for Bullishness).., driven by several key factors.
🌟☀ Fundamental Analysis
Institutional adoption (e.g., MicroStrategy) remains strong, but ETF outflows (650.8M last week) signal caution.
Hash rate near all-time highs supports network security; post-2024 halving supply reduction is a bullish long-term factor.
Pro-crypto US regulatory shifts are positive, though global uncertainty persists.
🌟☀ Macro Economics
Potential US rate cuts in 2025 could weaken USD, boosting BTC; tighter policy may pressure it.
Recession fears in Europe vs. US resilience create mixed risk sentiment; BTC correlates with equities.
Geopolitical tensions enhance Bitcoin’s store-of-value appeal.
🌟☀ Commitments of Traders (COT) Data
Large speculators slightly net long, showing cautious optimism; no extreme positioning.
Hedgers net short, typical for futures; retail longs are moderate, not overcrowded.
🌟☀ On-Chain Analysis
Exchange outflows exceed inflows (ratio ~0.98), indicating accumulation.
Long-term holders steady, short-term holder realized price at 96,000 acts as support.
Whale activity mixed: some profit-taking, but accumulation persists below 97,000.
🌟☀ Market Sentiment Analysis
Retail sentiment neutral, cautious on X; no extreme greed or fear.
Institutional hesitancy (ETF outflows) offsets professional traders’ accumulation views.
🌟☀ Positioning
Support at 96,000, resistance at 98,500-99,000; liquidity pools suggest breakout potential.
RSI (~50) neutral, MACD shows fading bearish momentum.
🌟☀ Overall Summary Outlook
Short-term: Consolidation between 94,000-100,000, slight upward bias.
Medium-term: Bullish if macro aligns (104,000-110,000); downside risk to 90,000.
Long-term: Fundamentals favor 120,000 by mid-2025.
⚠️Trading Alert : News Releases and Position Management 📰 🗞️ 🚫🚏
As a reminder, news releases can have a significant impact on market prices and volatility. To minimize potential losses and protect your running positions,
we recommend the following:
Avoid taking new trades during news releases
Use trailing stop-loss orders to protect your running positions and lock in profits
📌Please note that this is a general analysis and not personalized investment advice. It's essential to consider your own risk tolerance and market analysis before making any investment decisions.
📌Keep in mind that these factors can change rapidly, and it's essential to stay up-to-date with market developments and adjust your analysis accordingly.
💖Supporting our robbery plan will enable us to effortlessly make and steal money 💰💵 Tell your friends, Colleagues and family to follow, like, and share. Boost the strength of our robbery team. Every day in this market make money with ease by using the Thief Trading Style.🏆💪🤝❤️🎉🚀
I'll see you soon with another heist plan, so stay tuned 🤑🐱👤🤗🤩

BTCUSDT 1WBTC ~ 1W Analysis
#BTC We hope there will be a lot of good news after this dips. To support the next increase to the top of Elliot Wave 5.

BTCUSDT TRADING POINT UPDATE >READ THE CHAPTIAN Buddy'S dear friend 👋
SMC Trading Signals Update 🗾🗺️ crypto Traders SMC-Trading Point update you on New technical analysis setup for BTC USDT signals 🚀. BTC list 3 months. Drop 💧. moment close below 👇 big support level now. See tow Big support level. One said close that expect it buying or selling position. 80k close below 1D candle that expect more selling position 49k. ) if not close below 1D back up trand close above 82k 83k expect it more Bullish trend 📈 📈
Key Resistance level 104k
Key Support level 80k 49k
Mr SMC Trading point
Plaes support boost 🚀 analysis follow)

BTCUSDT, Bearish Scenarios for upcoming days ...Hello Traders, Hope you're great.
for Upcoming days, I anticipate 2 Bearish scenarios :
In First Scenario, I expect price does an upward correction to the nearest broken support level that became to an important supply zone around 91-93K and after that starts to drop.
in Second scenario, I expect price does a further upward correction and goes to the supply zone around 95-97K and after that start a major downward movement.
Targets are 85K, 82K and my final target is 77K.
Don't forget to use proper risk management.
And finally tell me what do you think about BTCUSDT, UP or DOWN ? comment your opinion below this post.

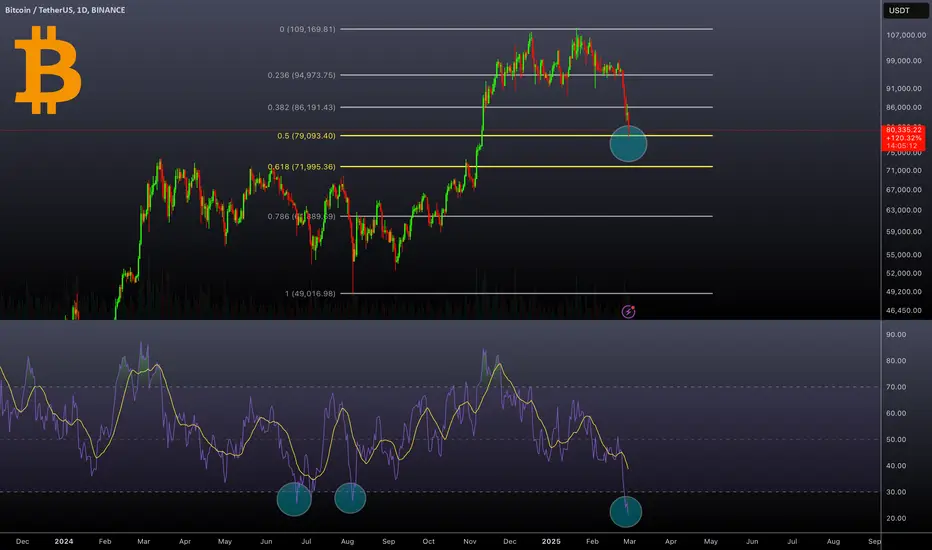
Bitcoin- Fibonacci Retest and Oversold RSIBitcoin's daily chart shows a significant price retracement, currently testing the key 0.5 Fibonacci level around $79,000. This level historically acts as a strong support zone during corrective phases. If BTC holds above this level, it could signal a potential rebound. However, if it breaks lower, the next major support is near $72,000 (0.618 Fibonacci level).
Additionally, the Relative Strength Index (RSI) has dropped to the 20 level, indicating extreme oversold conditions. Historically, such low RSI readings have led to strong reversals. If buying pressure emerges, BTC could see a recovery from these levels.
Regards
Hexa
BTCUSDT 1WBTC ~ 1W Analysis
#BTC It's hard to say this, but this is the end.
We are still sure bullish isn't over yet.

BTCUSDT Potentially BearishBINANCE:BTCUSDT took a really long time before finally loosing the 91,479.96 consolidation support zone, to this effect, I would expect to see price returning to retest that zone as a newly found resistance and if that holds, we just might see price dropping further to (potentially) the 70,000 area.
Results are not typical, do your due diligence before taking any trade as past results does not guarantee future results.

Why Bitcoin is going down, Reason? - fxdollars- {13/01/2025}Educational Analysis says BTCUSD may move DOWN from this range, according to my technical.
Broker - COINBASE
Because the BTCUSD pair showed some bullish weakness, it finally did liquidity, which was taken out on buy-side orders to show a sign of a downtrend, and I am looking to counter-trend this position.
Let's see what this pair brings to the table for us in the future.
Please check the comment section to see how this turned out.
DISCLAIMER:-
This is not an entry signal. THIS IS ONLY EDUCATIONAL PURPOSE ANALYSIS.
I have no concerns with your profit and loss from this analysis.
I HAVE NO CONCERNS WITH YOUR PROFIT OR LOSS,
Happy Trading, Fx Dollars.

BTCUSDT, What will happen in upcoming weeks ?Hello Traders, Hope you're great.
for Upcoming weeks, I anticipate 2 Bearish scenarios :
In First Scenario, I expect price goes to the demand zone at first and does an upward correction to supply zone around 104-108K and after that starts to drop below 90K.
in Second scenario, I expect price does an upward movement and goes to grab liquidity above 110K and after that starts a major fall and drops to below 80K.
Targets have determined by Blue dashed lines.
and finally tell me what do you think about BTCUSDT, UP or DOWN ? comment your opinion below this post.

#BTCUSDT remains in a bearish trend📉 SHORT BYBIT:BTCUSDT.P from $94,831.0
🛡 Stop Loss: $95,276.0
⏱ 4H Timeframe
✅ Overview:
➡️ BYBIT:BTCUSDT.P is trading within a descending range after forming a Head and Shoulders pattern, indicating potential further downside.
➡️ Volume Profile suggests that the main liquidity (POC) is positioned above the current price ($95,933.6), reinforcing seller dominance.
➡️ A break below $94,831.0 will strengthen the bearish impulse and confirm buyer weakness.
➡️ The main downside targets are in the $94,470.0 – $94,120.0 range, where a short-term bounce may occur.
⚡ Plan:
➡️ Short entry after breaking $94,831.0, confirming bearish momentum.
➡️ Stop-Loss at $95,276.0—placed above the nearest resistance level to minimize risk.
➡️ Main targets: $94,470.0 and $94,120.0, where demand may emerge.
🎯 TP Targets:
💎 TP 1: $94,470.0
🔥 TP 2: $94,120.0
🚀 BYBIT:BTCUSDT.P remains in a bearish trend—expecting further downside!
📢 BYBIT:BTCUSDT.P is forming a bearish trend, and consolidation below $94,831.0 will reinforce it.
📢 Watch for price reactions near $94,120.0, where a slowdown might occur.

#BTCUSDT maintains bearish momentum — expecting further decline!📉 SHORT BYBIT:BTCUSDT.P from $94,547.0
🛡 Stop Loss: $95,027.0
⏱️ 1H Timeframe
✅ Overview:
➡️ BYBIT:BTCUSDT.P is forming a downtrend after testing the resistance zone.
➡️ Volume Profile suggests that the main liquidity (POC) is positioned above the current price ($96,258.3), indicating volume distribution in favor of sellers.
➡️ A break below $94,830.7 will confirm buyer weakness and open the potential for further decline.
➡️ The $94,286.0 and $94,090.0 levels may act as profit-taking zones, while $93,900.0 is a key support level.
⚡️ Plan:
➡️ Short entry upon breaking $94,547.0, confirming further downside.
➡️ Stop-Loss at $95,027.0—placed above the nearest liquidity level to minimize risk.
➡️ Main targets are in the $94,286.0 – $93,900.0 zone, where a bounce is possible.
🎯 TP Targets:
💎 TP 1: $94,286.0
🔥 TP 2: $94,090.0
⚡️ TP 3: $93,900.0
🚀 BYBIT:BTCUSDT.P maintains bearish momentum—expecting further decline!
📢 BYBIT:BTCUSDT.P continues its downward movement. If the price consolidates below $94,547.0, this will strengthen selling pressure and accelerate movement toward $93,900.0.
📢 However, buying activity may emerge at this level, so partial profit-taking is recommended.

There are unexpected profits after BTCUSD dropped sharply.Many people work hard to save money and manage their finances, but their assets continue to shrink. In fact, you have not mastered the correct asset allocation method. For example, the current price of Bitcoin is 94738, so should you short or go long now? How do you make a decision?
David believes that the current support point of Bitcoin is 94100. Combining technical indicators and basic factors, David believes that Bitcoin will bottom out and rebound.
BUY:94738
TP:9600
TP:9700
SL:94100
COINBASE:BTCUSD BITSTAMP:BTCUSD BITSTAMP:BTCUSD

Comprehensive analysis of BitcoinAt present, the 50-day and 200-day moving averages of Bitcoin form a "golden cross", which usually indicates a medium- to long-term bullish trend.
David's suggestion to buy long is reasonable. If you like the following profits, you can buy
Buy: 95600
TP: 95700
TP: 95800
SL: 95555
If you agree with my analysis, please continue to pay attention. I will share my views for free later - (David)
If you don't know which time to trade and want to avoid risks, you can continue to pay attention BITSTAMP:BTCUSD COINBASE:BTCUSD
