Bullish Flag or a Bullish Pennant for TNY?Bullish flag formations are found in stocks with strong uptrends.
They are called bull flags because the pattern resembles a flag on a pole. The pole is the result of a vertical rise in a stock and the flag results from a period of consolidation.
The flag can be a horizontal rectangle, but is also often angled down away from the prevailing trend.
Another variant is called a bullish pennant, in which the consolidation takes the form of a symmetrical triangle.
The shape of the flag is not as important as the underlying psychology behind the pattern.
Basically, despite a strong vertical rally, the stock refuses to drop appreciably, as bulls snap up any shares they can get.
The breakout from a flag often results in a powerful move higher, measuring the length of the prior flag pole.
It is important to note that these patterns work the same in reverse and are known as bear flags and pennants.
What is a Pennant?
In technical analysis, a pennant is a type of continuation pattern formed when there is a large movement in a security, known as the flagpole, followed by a consolidation period with converging trend lines - the pennant - followed by a breakout movement in the same direction as the initial large movement, which represents the second half of the flagpole.
Bullish pennants, just like its name suggests, signals that bulls are about to go a-charging again.
This means that the sharp climb in price would resume after that brief period of consolidation, when bulls gather enough energy to take the price higher again.
Pennants are often continuation chart patterns formed after strong moves.
After a big upward or downward move, buyers or sellers usually pause to catch their breath before taking the pair further in the same direction.
Because of this, the price usually consolidates and forms a tiny symmetrical triangle, which is called a pennant.
Higher lows on the RSI & it is trading at approximately 52. Traditional interpretation and usage of the RSI dictates that values of 70 or above suggest that a security is becoming overbought or overvalued and may be primed for a trend reversal or corrective price pullback. An RSI reading of 30 or below indicates an oversold or undervalued condition.
Bullflags
Silver bull flag points to $17,3We could see here an upward move over the coming weeks. Thing is Gold also has a very bullish setup, so something might be up which will cause the rise in precious metals. Fact is coin mints aren't working and mines are shutting down all around the world. We'll see...
Is Tinley trading in a Bullish Flag?Possibly a descending triangle as well, but with the Long Beach facility license imminent I'm strongly leaning towards a bullish outcome.
The RSI looks like it recently made a Triple Bottom.
Only time will tell.
Next BULL FLAG! EthereumHey there,
Please support this idea with your likes and follow me!
Next bull flag on Ethereum coming up. Looking for a break on BTC and on ETH.
ETH might break out sooner than Bitcoin will, so keep an eye out for that.
Most likely a major move coming up soon.
I think bullish breakout is currently more likeley.
Cheers,
Konrad
How to Trade Bull & Bear Flag Pattern | Flag Pattern Tutorial !Bull & Bear Flag chart patterns Tutorial!
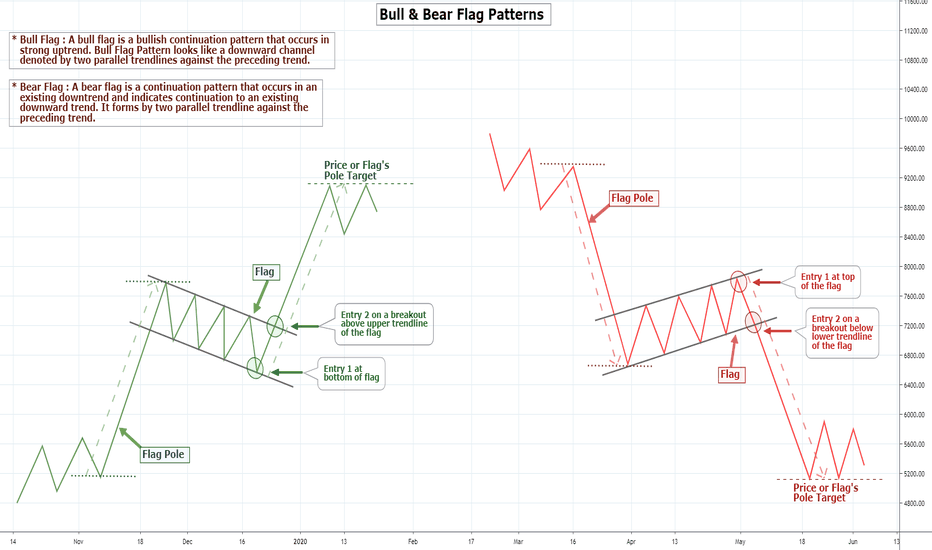
Bull Flag : A bull flag forms in bullish trending market, After a strong bullish movement when this pattern forms it signals the market is likely to move more higher. Bull flag pattern much similarly looks like a horizontal parallel channel or downward parallel channel along with a strong bullish vertical rally; when we draw the pattern it looks like flag on a pole, that's why they are called bull flags.
How to identify and Trade Bull Flags : - It is easy to identify a bull flag you just need to look for a Bullish Vertical Rally or Trend which is Pole of the Flag then identify the consolidation which will look like either horizontal channel or downward channel which will be the Flag. After identifying the pattern you can enter at the bottom of the flag or you can enter when price breaks the upper trendline of the flag which is more safe.
The breakout may also be a fakeout that's why we will take help of Volume and RSI Indicator to confirm the breakout. As shown on the below example you can see when price breaked the uppper trend of the flag the Trend drawn on the RSI was also broke and the Volume was high.
()
( *Key things to know : If the retracement measured from the vertical rally or Flag Pole retrace more than 50% the pattern becomes weak and it may not be a Flag Pattern but sometimes it stays valid if it breakouts above the uppertrend of the flag.)
Bear Flag : Bear Flag is just the opposite of the Bull Flag Pattern. A bear Flag forms in bearish trending market. Bear Flag pattern signals the market is likely to drop more lower. You need to identify Bear Flag in bearish trend when the price of a financial asset drops then if the price forms a horizontal channel or upward channel which will look like a inverted flag whose flag pole will be upside and the flag will be downside.
Stay Tuned; 👍
Like this tutorial & share your comment below and also
check other tutorials with example linked below;
Thank You-


