Asianpaint at golden ratioAsianpaint on trendline support with rsi regualar positive diveregence and fib golden ration. Target on chart...
Bullish Divergence

BTC.D Looks ready to beggar altcoinsThe chart is pretty simple and most the details are already on the main chart. Triangles are some of the easiest patterns to recognize and some of the worst at meeting full performance and are the most likely to bust if they are not nested in a larger macro structure. The pattern recognition is easy, we have three alternating points of support and resistance. Due to the size of this ascending triangle there is no larger structure.
At the blue 3 we see that BTC.D is at double support, both the top of the channel and the rising support of the triangle. Triangles are the most likely to bust but since we are at double support I feel we have a good chance of increasing our odds to the upside. Target area is of between the 0.618 and 0.786 fib extension levels but there may be the basic price action behaviors, such as going to a fib extension and pulling back to retest the neckline as support.
A zoom in of the channel with the nine season's rainbow shows we are getting some basing behavior as determined by the indicator showing blue. The light red indicates selling is relatively weak. Read up on the indicator here:
The standard indicators are showing a massive amount of hidden bullish divergence on the daily. which is a great place to be if we are forecasting BTC.D will go up. MACD very likely to have a bullish cross and the histogram is divergent to price. Generally speaking, if RSI hits over-sold on the daily with hidden bullish divergence there is a strong chance that there will be a move to the upside.
Below are the times that btc.d went up while the price of bitcoin actually traded down. Which means that quite simply the alts sold of at a higher rate than bitcoin. It does not necessarily suggest that BTC was used as a store of value because they could have been tethering up or going into fiat. This chart is therefore tagged long only for BTC.D and cannot be used to suggest BTC will go up or down at this time.
In conclusion:
The chart is suggesting we should stay away from trading alts long in the short term. We might even need to stay away from trading BTC long depending on if BTC.D and BTCUSD diverge from one another again. This is a chart to keep an eye on.

NAT - Long SetupHere’s another pretty setup, I’m taking a long here. Descending channel....bullish divergence on both oscillators on the weekly time frame. Too pretty to pass up.

Bullish divergence on hourly chart for Ford MotorsBullish Divergence spotted for Ford motor company on hourly chart
Earnings on 4 th Feb , so becareful ...
This is not financial advise, please do your own research for your trading decissions


dogecoin - cannot believe i am charting thisnever thought i would see the day... but here we are, gen z
this worthless crypto will be hitting .1 soon
short term long
- bulllish triangle consolidation
- higher lows, declining volume
- bouncing off pitchfork trendline, once we pass the 78.6 level (around .07), we can push higher
- hidden exaggerated bullish divergence
***plz be smart with your money, idk wtf this pos is gonna do***

Looking for more than a 700% spike upwards with this oneThe financial sector is in trouble and we got a lot of bullish divergence on this ETF lets aim for The Sun!

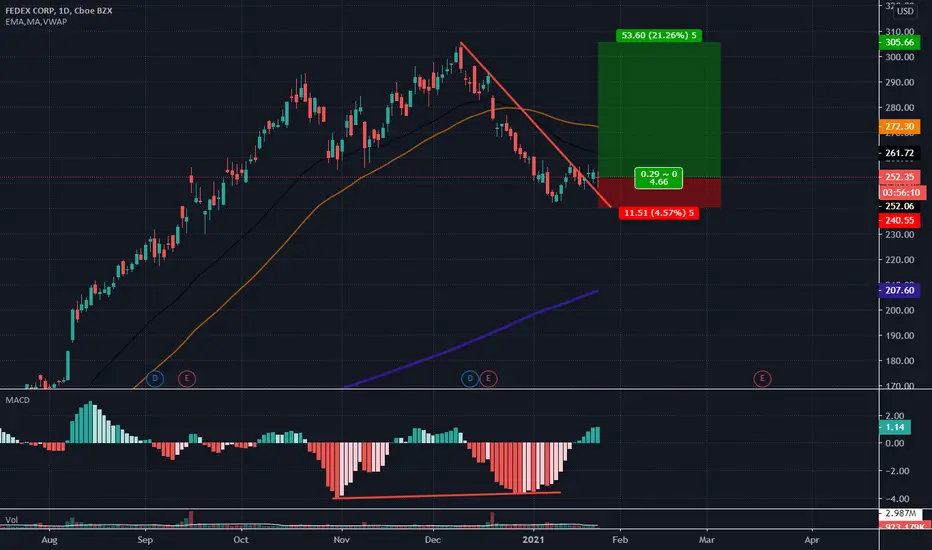
Triple Daily MACD Bullish Divergence with Diamond BreakoutWith the Help of Triple MACD Daily Bullish Divergence we maybe ready to make some higher highs!

Daily Bullish Divergence after Trendline BreakFEDEX Looks to be ready to try and make higher lows i see no harm in giving this long a shot.
Stops, Targets, and Entry are shaded on the chart.
Bitcoin make support above $30,000 USDIn this analysis, we see that Bitcoin it's showing us a bullish rising wedge, my own proyection it's around of $41,200 dollars, that are my next target profit. Now, lookng in the perspective, we have in 4 occasion that Bitcoin form a strong support above of $30,000 dollars, that mean that bulls are defend this important zone to continue our boughts. For that, I put a buy order limit a little down as $31,100 USD to be activated in some hours. And my SL it's around of $28,500 dollars.
And also, the RSI make bullish divegence and also the price action in H4 chart in the same time, just that we could see a formation of double bottom in Bitcoin in this timeframe.
Now, this it's a bullish risingw wedge more see in H8 chart!!!
And for you, I see that I'm so good in cryptocurrency than Forex, becuase I believe that my work in trading it's based more in volatile market and maybe cryptocurrency it's one of the market that I work better than another like Forex, commodities u others. But yes, I can to make the following. I can to make daily analysis on crytpocurrency, but yes reading Forex market fundamental and analysis to know the situation of the economic world ever, but my personal opinion, I don't like to trade much Forex and well, as I grew up in cryptospace, I beliee that this market it's one of my prefered. But now, I'm interesting to trade stock or maybe take any course to trade stocks market. Maybe, this market it's more relationaed with volatile market, and then, I prove that cryptocurrency I like much than Forex becuase I like to invest and trade assets. So, for that, I didn't consider that crypto are the best and more popular and international. But, in case I can to continue reading the Forex specualte news becuase I like to follow the economics trend and how it's affect the others market. Now, in case for example, Gold and Silver, maybe it's not so volatile, but yes and it's have more implication with Forex. For that, at the moment, I will continue trade cryptocurrency, and then, learn to trade stock marekt, it's my next mission for me.

XPEL ... Bullish divergence and pocket pivots on hourly chartI have been watching XPEL since a week ... it was listed as sector leader on investors.com
I see bullish divergence on hourly chart ( see the notes on above chart )
pocket pivot found ( large voulme registered today / 26th Jan 2021 )
Once it breaks the resistance level at 54.98 ( see the red line on the chart ) , it will go up further
Let me know what you think about this

SPY .... Bullish divergence on hourly chart I publish this idea whenever I see bullish divergence in SPY ...
Earlier divergence anlysis worked well , please see the below reference links ...

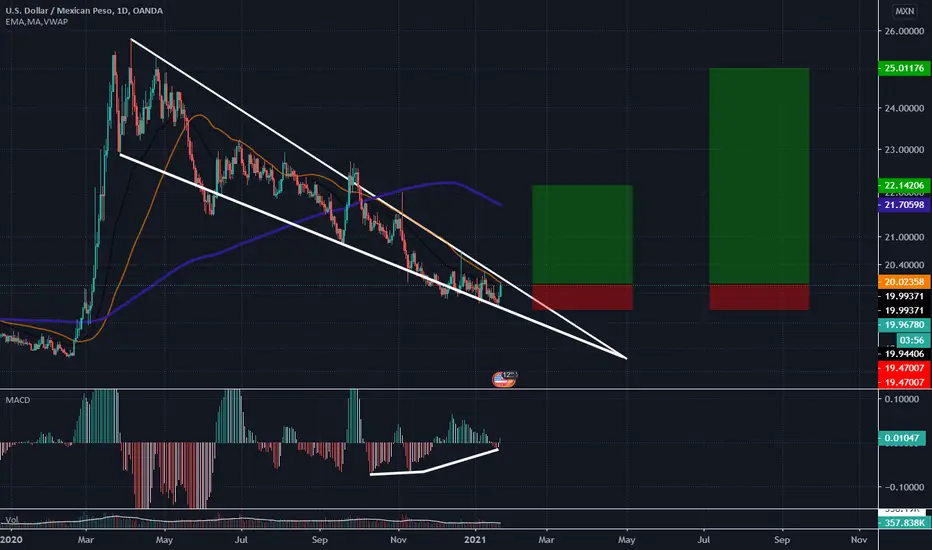
USDMXN Falling Wedge: Showing Triple MACD Bullish DivergenceIt looks like we will be breaking out of a falling wedge soon while showing triple MACD Bullish Divergence on the Daily after holding support on the 200 week SMA and log scale 786 fib retrace with Hidden Bullish Divergence on the weekly shown here:

$Art looking like a piece of art.$art is looking like a beautiful buy with a triple bottom on its new found floor, not to mention a pretty bullish indicator on the macd, stochastics and rsi. This is due to the lowering price and the rising indicators into the bullish territory making for a pop in price.
Crazy.
Pump it.
$1

USDCAD Upsidein the previous idea, we got some profit then price tag the low once again.
and now price created bullish engulfing candle and bullish divergent on the daily chart.
to jump into buy, find pullback on the smaller timeframe to get best price.
exit when price break the low
