EURAUDEURAUD was trading under declining trendline. The price was reacting well the support and resistance of trendline .
Currently the price has given the massive breakout from falling wedge and after successful retest of the level will be bullish signal and seems like the price may go for another leg higher.
If the breakout sustain to upside the optimum target could be 1.6500
What you guys think of this idea?
Bullishpattern

#NHPC Company has been maintaining a healthy dividend payout of 49.5%
The company is actively engaged in the construction of 15 Solar and Hydro Power Projects of 10449 MW Capacity (including JV & Subsidiaries). Total projects under clearance stood at 4112 MW and projects under survey stood at 4110 MW as on Dec’23.
MOUs
Company has signed a MoU on 3 Jan 2024 with GPCL for proposed investment of Rs.4000 Cr in Kuppa Pumped Storage Project (750 MW), Chhota Udaipur, Gujarat.
Company signed an MOU with Govt. of Odisha through GRIDCO Limited on 23 Jun 2023 for Development of Pumped Storage Projects and Renewable Energy in the State of Odisha.
It signed an MOU on 23 Aug 2023 with APGENCO for Implementation of Pumped Hydro Storage Projects and Renewable Energy Projects under Joint Venture Mode in Andhra Pradesh. The MOU envisages Implementation of two Identified Pumped Hydro Storage Projects namely Kamlapadu- 950 MW and Yaganti 1000 MW PSPs in the first phase.
Focus
Being a hydro power company shifting its focus toward the renewable energy segment as well. Out of 10499 MW capacity under construction 1135 MW is for Solar power. It has recently signed a contract to develop additional 2000 MW solar power capacity in Rajasthan. About 9090 MW Solar power capacity is under Tender and pipeline including as a Intermediary Procurer.

#Just Dial #JUSTDIAL
Pan-India Presence
The company has ~12000 employees in telesales, marketing, feet-on-street activities deployed across 250+ cities covering 11,000+ pincodes in India. It derives 70% of its revenues from top 11 cities including Mumbai, Ahmedabad, Hyderabad, Kolkata, Bengaluru, Chennai, Delhi, etc. Its technology and R&D division is located in Bengaluru
Business Model
Paid advertisers pay a fixed fee to run search led advertising campaigns for their businesses
on Justdial’s platforms. Various premium & non-premium listing packages available which determine placements in search results. Add-on products such as banners, own website, JD Pay, JD Ratings, etc.

#HINDUSTAN ZINC #HINDZINC"Record annual silver & metal production with strong cost resilience amidst lower zinc prices;
PAT at INR 7,759 Crore."
Key Highlights :
Hindustan Zinc is now the 3'd largest silver producer globally, with highest silver annual
production, up 5% y-o-y
Holds 2nd largest zinc reserves and resources globally
Industry leading production growth rate with best-ever annual metal production
Highest-ever quarterly refined metal production for 04 FY24, up 6% sequentially
1st decile of the global zinc mines cost curve; lowest annual COP in last 3 years at US$
1,117/MT
Quarterly Revenue up by 3% and EBITDA up by 2%
Ranked first globally in S&P Sustainability Assessment in Metals and Mining sector

Bitcoin (BTC) Price Analysis: Preparing for the Bearish AbyssIn this technical forecast, we delve into the darker recesses of Bitcoin's potential price journey. We observe a concerning configuration on the BTCUSD chart where the currency is currently grappling with critical support levels.
Current Dynamics:
The price has recently retracted from a peak, teasing the possibility of a significant downtrend.
A descending channel formation can be seen, indicating a tightening bearish grip on the market momentum.
Worst Case Trajectory:
Should the price break below the sturdy support zone, indicated by the green rectangle, we may see an accelerated drop.
The price could tumble toward the lower boundary of the channel, a line that has historically acted as a gravitational pull during bearish trends.
Key Levels to Watch:
Immediate support resides within the green rectangle zone. If this fails, the descent could be sharp and unforgiving.
Further support is hypothesized by the extended yellow trend lines, outlining a worst case range that could spell distress for bulls.
Projected Pathways:
The worst case scenario envisions a stark descent, followed by a period of consolidation below the current support.
A relief rally might attempt to reclaim lost ground, but the overarching trajectory remains bleak in this hypothesis.
Conclusion:
While we must tread with caution, preparing for a bearish eventuality is prudent. Investors and traders should brace for volatility and consider the historical behavior of the market during similar patterns. Vigilance is key as we watch for potential support breaches that could confirm this grim forecast.

what does this divergence say about indicescompared to USI:TICK , SPX/NDX is maximally diverged as stocks consolidate most heavily. the difference between indices historically closes quickly, and daily consolidation may have begun to rally the market somewhat.
the indices compared to all stocks up/down is beginning a daily bounce due to the amount of money that has gone back into risk assets as they squeeze compared to an overall down market.

SBI Bank Analysis for long term and short termAfter gave a good move till 5 March price consolidating in a range of 724-793. It's all time high level For SBIN. At 25 April price break the 793 level with a good volume. Now price try to retrace the 793 level. At 793 level if we can find any bullish candle
Swing trader can averaging there position .
For Intraday:
we will wait for taking retrace at 793 level and find any bullish candle for entry with a stop loss of 775 . Minimum Target of 1:2 for now.
Also I'll update you accordingly here.

QTK (A GEM COIN) Which Can Go 20x-30x In The Bull Market!!Calling all crypto enthusiasts! Today, we're diving deep into QTK: A GEM Coin, a project with the potential to become a true gem in the cryptocurrency world. This post will combine technical analysis (TA) with fundamental analysis (FA) to provide a well-rounded perspective on QTK.
Current Price & Trend
As of April 21, 2024, QTK is trading at $0.42 The coin is currently experiencing a consolidation phase.
Technical Analysis (TA)
Let's utilize some technical indicators to assess QTK's potential:
As you see in the chart, it forms a bull flag-like structure. Once it breaks out from this flag it can easily pump 100-150%
Fundamental Analysis (FA)
Now, let's shift gears and explore QTK's fundamentals:
QTK is the native token of Quantcheck, an AI-based platform that makes backtesting trading strategies easier than ever.
Tokenomics: The supply of this asset is remarkably low at just $120.75 million, which promises scarcity as demand increases with more users adopting the platform.
Technology: Quantcheck's drag-and-drop approach makes it accessible to new traders who may not have coding experience.
Big Exchanges listing : Currently, only listed on Mexc exchange. Once it is listed on other big exchanges it will gain more hype.
Entry range:- Buy some at CMP and add more up to $0.36
Short-term target:- 100-150%
Mid-term target:- 5x-10x
Long term target:- 20x-30x
What are your thoughts on QTK's future? Share your technical and fundamental analysis insights in the comments below!

i like a neutral set up leaning buy into mondayfutures have reclaimed some ground at the end of the trading week. i feel good about leaning buy towards the start of next week, as long as were holding a decent level according to this market structure/value area and volume range.
this ai strategy shows that the price is supportive of extending its gains if we hold this momentum to the upside.

Very Bullish can double by the end of 2024It can cross 250 levels be the end of 2024. So stay tuned.

UTI AMC BULLISH ON SHORT AND LONG TERMEntry at 725
Short term target 764
6 months target 865Rs
Top growing stock.
Invest for good returns

PEPE/USDT READY TO LIFT OFF!!Hello everyone, if you like the idea, do not forget to support it with a like and follow.
Welcome to this PEPE/USDT trade setup.
Breaks out from the falling wedge-like structure, a retest is also done and is now ready to go upside. Buy some here and add more in the dips.
Target:- 70-80%
SL:- $0.006
If you like this idea then do support it with like and follow.
Also, share your views in the comment section.
Thank You!

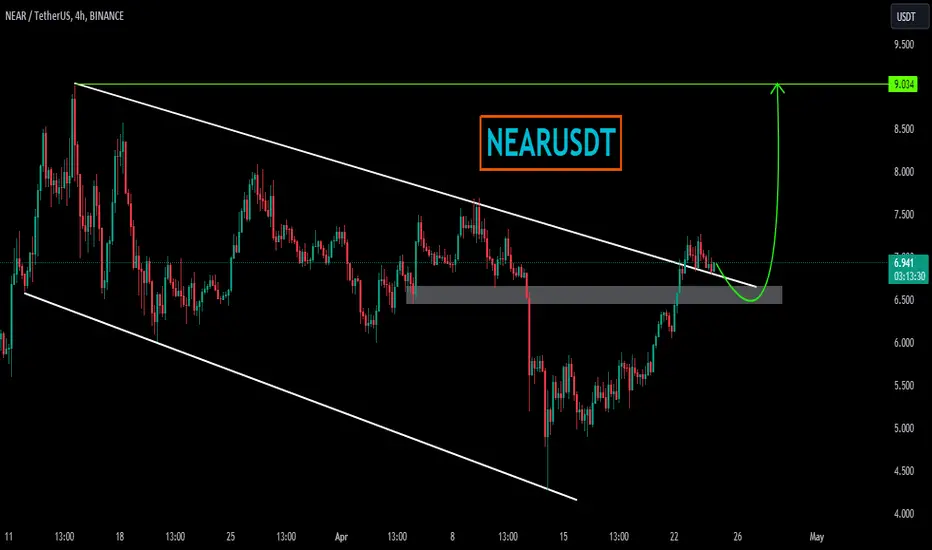
NEARUSDTNEARUSDT was trading under the declining trendline. The price was reacting well the support and resistance of trendline
Currently the price has given the breakout from declining trendline with confluence to strong bullish divergence and now seems like the bulls are getting ready for some strong upside movement.
If the bulls sustain to upside the optimum target could be 9.5
What you guys think of this idea?
ETH/USDT BULLISH PATTERN! READY TO GO UPSIDE!!Hello everyone, if you like the idea, do not forget to support it with a like and follow.
Welcome to this ETH/USDT Update.
ETH/USDT is forming a bullish Adam & Eve double bottom pattern, suggesting a potential trend reversal towards higher prices.
Analysis:
Adam's Cup: We see a clear downward movement followed by a rounded bottom reversal, forming the left cup of the Adam & Eve pattern.
Eve's Cup: The price is completed with a similar rounded bottom, potentially forming the right cup (Eve's cup) of the pattern.
Neckline: A trendline can be drawn connecting the lows of both cups, forming the neckline. A breakout above this neckline is already done and it is a bullish signal.
Indicators:
Moving Average: The price is also breaking above the 100D moving average.
Target:
The measured move target for the Adam & Eve pattern would be the height of the first cup (Adam's cup) added to the breakout point above the neckline.
Stop Loss:
A stop loss can be placed below the neckline for risk management.
If you like this idea then do support it with like and follow.
Also, share your views in the comment section.
Thank You!

EURCADEURCAD was trading under the declining trendline. The price was reacting well the support and resistance of trendline
Currently the price has given the breakout from declining trendline with confluence to strong bullish divergence and now seems like the bulls are getting ready for some strong upside movement.
If the bulls sustain to upside the optimum target could be 0.9830
What you guys think of this idea?

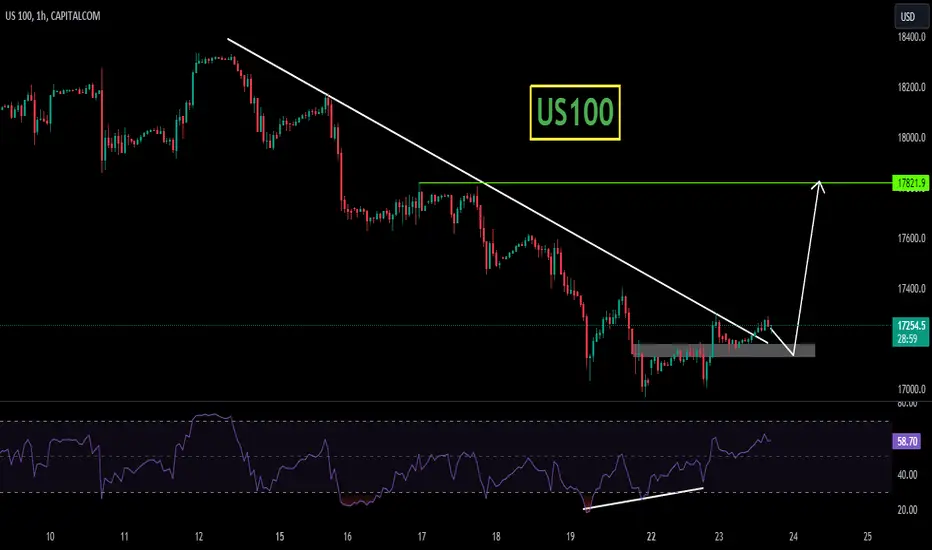
US100US100 is trading in falling wedge pattern. The price was reacting well the support and resistance of wedge.
Currently the price has given the massive breakout from falling wedge and after successful retest of the level will be bullish signal and seems like the price may go for another leg higher.
If the breakout sustain to upside the optimum target could be 17850
What you guys think of this idea?
BTC 66K Promise TARGETBINANCE:BTCUSDT
CME gap was formed at ~66113$
We hope that it will not be filled in the coming days 🙃
FYI: ±90% of CME gaps are filled sooner or later (it may be in a week, or maybe in a month).
Keep this in mind.

[ADAUSDT] - health correction done , now get bullish!ada reached the bottom 20% bearish wave as expected
it hit the lower side of broadening wedge and 0 level of fib in 2d chart...after making the H&S pattern
ada bouncing back well after that correction and expected to reach the top of the broadening wedge pattern
targets: 0.55 - 0.60 - 65 - 0.90
stoplose:0.44
if u see this idea helpful then press "like" , "follow" to provide more ideas and updates🎯

Tesla on important triangle support, great risk-rewardTesla is getting way oversold and has reached an important support of the line linking the lows which represents the bottom of its large triangle pattern.
We are expecting at least a rebound here but potentially the start of a new upleg as long as the $136 area holds.
A break above the upper line of the triangle near $235 would open much higher levels while a break below would invalidate this bullish view.

ZRX ANALYSIS💥💥#ZRX Analysis 🚀🚀
#ZRX is breaking out of a falling wedge pattern on 12HR timeframe👀
We are expecting more than 100% movement in first run✈️ 💸
👀Current Price: $0.5318
🚀 Target Price: $1.4388
⚡️What to do ?
👀Keep an eye on #ZRX price action and volume. We can trade according to the chart and make some profits⚡️⚡️
#ZRX #Cryptocurrency #TechnicalAnalysis #DYOR

GSPL: The Next Rocket StockGSPL
The Fundamentals of GSPL are good.
A profitable company.
Piotroski score of 7 on 9
Stock P/E: 14
FIIs and DIIs present in this stock.
This is a ratio chart of GSPL and Nifty 500
On ratio chart, we can see a breakout out. Which means GSPL can outperform Nifty 500 in coming weeks.

Megmani Organic Ltd Breakup Momentum - Bullish Targets UnveiledMegmani Organic Ltd (Ticker: MEGORG) has recently experienced a significant breakup with impressive trading volumes, signaling a potential bullish trend reversal. The stock is now poised for an upward trajectory, targeting key resistance levels at 101, 115, and 125.
Technical Analysis:
Breakup Confirmation: The breakup in Megmani Organic Ltd was accompanied by substantial trading volumes, indicating strong market participation and a potential shift in sentiment.
Supportive Candlestick Patterns: The recent breakup is supported by bullish candlestick patterns, suggesting increased buying interest and positive investor sentiment.
Moving Averages: Short-term moving averages (e.g., 20-day and 50-day) have crossed above long-term moving averages (e.g., 200-day), reinforcing the bullish momentum.
Potential Price Targets:
Target 1: 101
The first target represents a psychological resistance level and a potential breakout point.
Traders can consider taking partial profits at this level.
Target 2: 115
The second target indicates a further bullish move, with the potential to challenge previous highs.
Consider adjusting stop-loss levels as the stock approaches this target.
Target 3: 125
The third target signifies a more extended bullish move, with the stock aiming for new highs.
Traders may choose to reevaluate their positions and consider profit-taking strategies at this level.
Risk Management:
Stop Loss (SL): 78
A stop-loss level at 78 is recommended to mitigate potential losses in case of an unexpected reversal.
Adjust the stop-loss as the stock advances, locking in profits and managing risk accordingly.
Time Frame:
This trade idea is based on a mid-to-long-term outlook. Traders and investors should monitor the stock's performance regularly and adjust their positions as needed.
Disclaimer: This analysis is for educational purposes only and should not be considered financial advice. Traders and investors are encouraged to conduct their own research and seek professional advice before making any trading decisions. Trading involves risks, and past performance is not indicative of future results.

GBPCADGBPCAD was trading inside the descending parallel channel . The price is reacting well the support and resistance of channel.
Currently the price has given the breakout from declining trendline with confluence to strong bullish divergence and now seems like the bulls are getting ready for some strong upside movement.
If the bulls sustain to upside the optimum target could be 1.7280 followed by 1.7350
What you guys think of this idea?
